MIRA
INFORM REPORT
|
Report Date : |
14.01.2013 |
IDENTIFICATION DETAILS
|
Name : |
ZEEMAN
TEXTIELSUPERS B.V. |
|
|
|
|
Registered Office : |
De
Schans 15, 2405XX Alphen aan den Rijn |
|
|
|
|
Country : |
Netherlands |
|
|
|
|
Financials (as on) : |
31.12.2010 |
|
|
|
|
Date of Incorporation : |
16.03.1967 |
|
|
|
|
Com. Reg. No.: |
28034863 |
|
|
|
|
Legal Form : |
Besloten Vennootschap |
|
|
|
|
Line of Business : |
Festivity
halls and festivity buildings exploitation |
|
|
|
|
No. of Employees : |
375 |
RATING & COMMENTS
|
MIRA’s Rating : |
Ba |
|
RATING |
STATUS |
PROPOSED CREDIT LINE |
|
|
41-55 |
Ba |
Overall operation is considered normal. Capable to meet normal
commitments. |
Satisfactory |
|
Status : |
Satisfactory |
|
|
|
|
Payment Behaviour : |
No Complaints |
|
|
|
|
Litigation : |
Clear |
NOTES:
Any query related to this report can be made
on e-mail: infodept@mirainform.com
while quoting report number, name and date.
ECGC Country Risk Classification List – June 30th, 2012
|
Country Name |
Previous Rating (31.03.2012) |
Current Rating (30.06.2012) |
|
Netherlands |
A1 |
A1 |
|
Risk Category |
ECGC
Classification |
|
Insignificant |
A1 |
|
Low |
A2 |
|
Moderate |
B1 |
|
High |
B2 |
|
Very High |
C1 |
|
Restricted |
C2 |
|
Off-credit |
D |
Netherlands - ECONOMIC OVERVIEW
The Dutch economy is the fifth-largest economy in the euro-zone and is noted for its stable industrial relations, moderate unemployment and inflation, a sizable trade surplus, and an important role as a European transportation hub. Industrial activity is predominantly in food processing, chemicals, petroleum refining, and electrical machinery. A highly mechanized agricultural sector employs only 2% of the labor force but provides large surpluses for the food-processing industry and for exports. The Netherlands, along with 11 of its EU partners, began circulating the euro currency on 1 January 2002. After 26 years of uninterrupted economic growth, the Dutch economy - highly dependent on an international financial sector and international trade - contracted by 3.5% in 2009 as a result of the global financial crisis. The Dutch financial sector suffered, due in part to the high exposure of some Dutch banks to U.S. mortgage-backed securities. In 2008, the government nationalized two banks and injected billions of dollars of capital into other financial institutions, to prevent further deterioration of a crucial sector. The government also sought to boost the domestic economy by accelerating infrastructure programs, offering corporate tax breaks for employers to retain workers, and expanding export credit facilities. The stimulus programs and bank bailouts, however, resulted in a government budget deficit of 5.3% of GDP in 2010 that contrasted sharply with a surplus of 0.7% in 2008. The government of Prime Minister Mark RUTTE began implementing fiscal consolidation measures in early 2011, mainly reductions in expenditures, which resulted in an improved budget deficit of 3.8% of GDP.
|
Source : CIA |
CONTACTINFORMATION
|
Company name |
ZEEMAN TEXTIELSUPERS B.V. |
|
Tradename |
ZEEMALE textielSupers B.V. |
|
Address |
De Schans 15 |
|
|
2405XX Alphen aan den Rijn |
|
|
Netherlands |
|
Mail address |
Postbus 301 |
|
|
2400AH Alphen aan den Rijn |
|
|
Netherlands |
|
Telephone number |
0172482911 |
|
Telefax number |
0172482293 |
|
E-mail address |
|
|
Website |
|
|
VAT number / RSIN |
005154820 |
|
Branch(es) |
599 branches |
COMPANY INFORMATION
Handelsregisternummer 28034863
Registered in Chamber
of commerce Den Haag
Act of foundation 28-12-1979
Date of constitution 16-03-1967
Continuation date 28-12-1979
Last change in statutes 17-11-1999
Legal form Besloten
Vennootschap
Place of constitution Alphen
aan den Rijn
Issued capital 15.882,31
Paid up capital 15.882,31
|
NACE-code |
Festivity halls and festivity
buildings exploitation (702041) |
|
|
Letting of real estate n.e.c.
(702042) |
|
SBI-code |
Renting of non-residential real
estate (68204) |
|
Formal objective |
Het exploiteren van
detailhandelszaken op het gebied van textielgoederen, kleding, |
|
|
stukgoederen, huishoudelijke goods
en speelgoed |
|
Employees |
Total: 375 |
|
|
|
|
Bookyear |
|
2012 |
2011 |
2009 |
|
Number |
|
375 |
375 |
375 |
|
Change |
|
0,00% |
0,00% |
0,00% |
COMPANY STRUCTURE
|
Shareholder |
Zeeman Groep B.V. |
|
|
De Schans 15 |
|
|
2405XX ALPHEN AAN DEN RIJN |
|
|
Netherlands |
|
|
KvK: 28047313 |
|
|
Active since: 31-12-1993 |
|
|
Percentage: 100.00% |
|
Holding company |
Zeeman Groep B.V. |
|
|
De Schans 15 |
|
|
2405XX ALPHEN AAN DEN RIJN |
|
|
KvK: 28047313 |
|
Affiliated companies |
Tex-Style Europe 2000 B.V. |
|
|
De Schans 15 |
|
|
2405XX ALPHEN AAN DEN RIJN |
|
|
KvK: 34117499 |
|
Liability declaration |
Zeeman Groep B.V. (28047313) |
|
|
De Schans 15 |
|
|
2405XX ALPHEN AAN DEN RIJN |
|
Bank |
Rabobank Netherlands |
|
|
Account number: 39.17.42.744 |
|
|
ING Bank NV |
|
|
Account number: 65.24.14.184 |
|
Real estate |
Lease |
|
|
The real estate is checked at the land
registration office |
|
|
Object code: ALPHEN AAN DEN RIJN B
6975 |
|
|
Owner: DE SCHANS B.V. |
|
|
Description: De Schans 15 |
MANAGEMENT
|
Management |
A.W.M. van
Bolderen |
|
|
Albertus
Wilhelmus Maria |
|
|
Authorization:
Fully authorized |
|
|
Position:
Manager |
|
|
Date appointed:
01-06-2011 |
|
|
Date of
birth: 02-02-1955 |
|
|
B.E. Karis |
|
|
Barthold
Eduard |
|
|
Authorization:
Fully authorized |
|
|
Position:
Manager |
|
|
Date
appointed: 24-05-2007 |
|
|
Date of
birth: 11-12-1958 |
PAYMENT INFORMATION
Payment experiences Payments
are regular, no complaints are known
Payments Based
on multiple payment experiences up to € 50.000
Quarter: 2 2012:
41 Average days
Quarter: 3 2012: 37 Average days
Quarter: 4 2012: 45 Average days
Quarter: 1 2013:
47 Average days
|
|
invoices |
current
quarter |
2012 Q4 |
2012 Q3 |
2012 Q2 |
|
|
Total |
84 |
100% |
155.078 |
153.735 |
157.314 |
156.877 |
|
Within
terms |
64 |
74,1% |
114.915 |
144.825 |
141.676 |
118.064 |
|
Delayed 0
- 30 |
13 |
24,0% |
37.260 |
3.105 |
12.420 |
38.813 |
|
Delayed 31
- 60 |
|
|
|
|
|
|
|
Delayed 61
- 90 |
1 |
0,0% |
|
|
2.250 |
|
|
Delayed 91
- 120 |
3 |
0,7% |
1.161 |
2.322 |
387 |
|
|
Delayed
120+ days |
3 |
1,1% |
1.742 |
3.483 |
581 |
|
FINANCIAL INFORMATION
|
Type of
publication |
Consolidated |
|
Annual
accounts van |
Zeeman
Groep B.V. |
|
|
De Schans
15 |
|
|
2405XX
ALPHEN AAN DEN RIJN |
|
|
KvK:
28047313 |
|
Publication |
Publication
according to obligations by law |
CORE FIGURES
|
BOOKYEAR |
2010 |
2009 |
2008 |
|
Quick ratio |
0,15 |
0,20 |
0,32 |
|
Current ratio |
1,00 |
1,02 |
1,14 |
|
Nett workingcapital / Balance total |
-0,00 |
0,01 |
0,09 |
|
Capital and reserves / Balance total |
0,31 |
0,32 |
0,38 |
|
Capital and reserves / Fixed assets |
0,91 |
1,00 |
1,27 |
|
Solvency |
0,46 |
0,48 |
0,62 |
|
Nett workingcapital Capital and
reserves |
-89.000 56.949.000 |
1.726.000 54.623.000 |
14.840.000 64.347.000 |
|
Change capital and reserves change
short term liabilities |
4,26% 9,25% |
-15,11% 10,27% |
|
|
Operating profit Nett Turnover |
33.336.000 529.358.000 |
26.124.000 498.910.000 |
33.341.000 476.305.000 |
Annual accounts The published financial information is the consolidated group information.
Last annual accounts 2010
|
Type of publication |
Consolidated |
|
|
Turnover |
2010: |
529.358.000 |
|
|
2009: |
498.910.000 |
|
|
2008: |
476.305.000 |
|
|
2007: |
456.401.000 |
|
|
2006: |
433.537.000 |
|
Gross profit |
2007: |
211.348.000 |
|
|
2006: |
202.793.000 |
|
Operating profit |
2010: |
33.336.000 |
|
|
2009: |
26.124.000 |
|
|
2008: |
33.341.000 |
|
|
2007: |
33.050.000 |
|
|
2006: |
32.909.000 |
|
Result after taxes |
2010: |
22.809.000 |
|
|
2009: |
18.287.000 |
|
|
2008: |
32.185.000 |
|
|
2007: |
20.399.000 |
|
|
2006: |
18.428.000 |
Tendency capital and reserves
Capital and reserves 2010
56.949.000
Total debt 2010
124.951.000
Current ratio 2010
1,00
Quick ratio 2010
0,15
Nett workingcapital 2010
-89.000
Profitability More
than sufficient
Solvency Sufficient
Liquidity Limited
Current- & Quickratio

Balance
|
BOOKYEAR |
2010 |
2009 |
2008 |
|
End of bookyear |
31-12-2010 |
31-12-2009 |
31-12-2008 |
|
Other intangible assets |
1.115.000 |
|
|
|
Intangible assets |
1.115.000 |
|
|
|
Tangible assets |
59.095.000 |
54.611.000 |
50.727.000 |
|
Financial assets |
2.098.000 |
|
|
|
Fixed assets |
62.308.000 |
54.611.000 |
50.727.000 |
|
|
|||
|
Stocks and work in progress |
105.502.000 |
93.181.000 |
85.526.000 |
|
Trade debtors |
71.000 |
24.000 |
117.000 |
|
Other amounts receivable |
4.126.000 |
7.505.000 |
17.521.000 |
|
Accounts receivable |
4.197.000 |
7.529.000 |
17.638.000 |
|
Liquid assets |
14.557.000 |
14.828.000 |
14.886.000 |
|
Current assets |
124.256.000 |
115.538.000 |
118.050.000 |
|
Total assets |
186.564.000 |
170.149.000 |
168.777.000 |
|
|
|||
|
Capital and reserves |
56.949.000 |
54.623.000 |
64.347.000 |
|
Provisions |
4.664.000 |
1.714.000 |
1.220.000 |
|
other long term debts |
606.000 |
|
|
|
Long term liabilities |
606.000 |
|
|
|
Other short term debts |
124.345.000 |
|
103.210.000 |
|
Total short term debt |
124.345.000 |
113.812.000 |
103.210.000 |
|
Total debt |
124.951.000 |
113.812.000 |
104.430.000 |
|
Total Liabilities |
186.564.000 |
170.149.000 |
168.777.000 |
|
|
|||
|
PROFIT & LOSS ACCOUNT |
|
|
|
|
BOOKYEAR |
2010 |
2009 |
2008 |
|
Turnover |
529.358.000 |
498.910.000 |
476.305.000 |
|
Nett Turnover |
529.358.000 |
498.910.000 |
476.305.000 |
|
Wages employees |
112.962.000 |
109.478.000 |
101.018.000 |
|
Depreciation and amortization |
14.744.000 |
13.634.000 |
12.640.000 |
|
Raw materials |
280.390.000 |
267.430.000 |
254.729.000 |
|
Other operating charges |
87.926.000 |
82.244.000 |
74.577.000 |
|
Operating charges |
496.022.000 |
472.786.000 |
442.964.000 |
|
Operating profit |
33.336.000 |
26.124.000 |
33.341.000 |
|
Financial income |
16.000 |
404.000 |
1.357.000 |
|
Financial charges |
3.946.000 |
3.551.000 |
4.405.000 |
|
Financial result |
-3.930.000 |
-3.147.000 |
-3.048.000 |
|
Result before taxes |
29.406.000 |
22.977.000 |
30.293.000 |
|
Income taxes |
6.388.000 |
4.690.000 |
-2.221.000 |
|
Result after taxes |
23.018.000 |
18.287.000 |
32.514.000 |
|
Extraordinary charges |
209.000 |
|
329.000 |
|
Extraordinary result |
209.000 |
|
329.000 |
|
Taxes on extraordinary result |
-209.000 |
|
-329.000 |
|
Extraordinary result after taxes |
-209.000 |
|
-329.000 |
|
Nett result |
22.809.000 |
18.287.000 |
32.185.000 |
History
|
Consent statements |
Over
bookyear 2011 a consent agreement is filed Over bookyear 2010 a consent
agreement is filed Over bookyear 2009 a consent agreement is filed |
|
Management |
Per 31
-05-2011 manager Eric Jan van der Woude out of office. Per
01-06-2011 manager Albertus Wilhelmus Maria van Bolderen appointed. |
Company structure
·
Zeeman
Groep B.V. (28047313)
ALPHEN
AAN DEN RIJN
o Zeeman Textielsupers B.V. (28034863) Alphen aan den Rijn
Subsidiary (100%)
o Tex-Style Europe 2000 B.V.
(34117499)
ALPHEN AAN DEN RIJN Subsidiary
(100%)
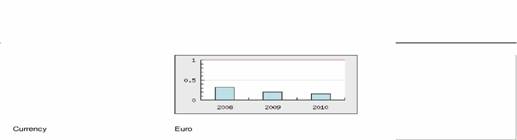
FOREIGN EXCHANGE RATES
|
Currency |
Unit
|
Indian Rupees |
|
US Dollar |
1 |
Rs.54.54 |
|
UK Pound |
1 |
Rs.88.05 |
|
Euro |
1 |
Rs.72.29 |
INFORMATION DETAILS
|
Report Prepared
by : |
SDA |
RATING EXPLANATIONS
|
RATING |
STATUS |
PROPOSED CREDIT LINE |
|
|
>86 |
Aaa |
Possesses an extremely sound financial base with the strongest
capability for timely payment of interest and principal sums |
Unlimited |
|
71-85 |
Aa |
Possesses adequate working capital. No caution needed for credit
transaction. It has above average (strong) capability for payment of interest
and principal sums |
Large |
|
56-70 |
A |
Financial & operational base are regarded healthy. General
unfavourable factors will not cause fatal effect. Satisfactory capability for
payment of interest and principal sums |
Fairly Large |
|
41-55 |
Ba |
Overall operation is considered normal. Capable to meet normal
commitments. |
Satisfactory |
|
26-40 |
B |
Capability to overcome financial difficulties seems comparatively
below average. |
Small |
|
11-25 |
Ca |
Adverse factors are apparent. Repayment of interest and principal sums
in default or expected to be in default upon maturity |
Limited with
full security |
|
<10 |
C |
Absolute credit risk exists. Caution needed to be exercised |
Credit not
recommended |
|
---- |
NB |
New Business |
---- |
This score serves as a reference to assess SC’s credit risk
and to set the amount of credit to be extended. It is calculated from a
composite of weighted scores obtained from each of the major sections of this
report. The assessed factors and their relative weights (as indicated through
%) are as follows:
Financial
condition (40%) Ownership
background (20%) Payment
record (10%)
Credit history
(10%) Market trend
(10%) Operational
size (10%)
This report is issued at your request without any
risk and responsibility on the part of MIRA INFORM PRIVATE LIMITED (MIPL)
or its officials.