MIRA INFORM REPORT
|
Report Date : |
29.01.2013 |
IDENTIFICATION DETAILS
|
Name : |
CYTEC
INDUSTRIES B.V. |
|
|
|
|
Registered Office : |
Burgemeester
Van Lierplein 75 3134ZB Vlaardingen |
|
|
|
|
Country : |
Netherlands |
|
|
|
|
Financials (as on) : |
31.12.2011 |
|
|
|
|
Date of Incorporation : |
04.05.1965 |
|
|
|
|
Com. Reg. No.: |
24108520 |
|
|
|
|
Legal Form : |
Private Company |
|
|
|
|
Line of Business : |
Manufacture of Chemicals and Chemical Products |
|
|
|
|
No. of Employees : |
14 |
RATING & COMMENTS
|
MIRA’s Rating : |
Ba |
|
RATING |
STATUS |
PROPOSED CREDIT LINE |
|
|
41-55 |
Ba |
Overall operation is considered normal. Capable to meet normal commitments. |
Satisfactory |
|
Status : |
Satisfactory |
|
|
|
|
Payment Behaviour : |
No Complaints |
|
|
|
|
Litigation : |
Clear |
NOTES:
Any query related to this report can be made
on e-mail: infodept@mirainform.com
while quoting report number, name and date.
ECGC Country Risk Classification List – June 30th, 2012
|
Country Name |
Previous Rating (31.03.2012) |
Current Rating (30.06.2012) |
|
Netherlands |
A1 |
A1 |
|
Risk Category |
ECGC Classification |
|
Insignificant |
A1 |
|
Low |
A2 |
|
Moderate |
B1 |
|
High |
B2 |
|
Very High |
C1 |
|
Restricted |
C2 |
|
Off-credit |
D |
Netherlands - ECONOMIC OVERVIEW
The Dutch economy is the fifth-largest economy in the euro-zone and is noted for its stable industrial relations, moderate unemployment and inflation, a sizable trade surplus, and an important role as a European transportation hub. Industrial activity is predominantly in food processing, chemicals, petroleum refining, and electrical machinery. A highly mechanized agricultural sector employs only 2% of the labor force but provides large surpluses for the food-processing industry and for exports. The Netherlands, along with 11 of its EU partners, began circulating the euro currency on 1 January 2002. After 26 years of uninterrupted economic growth, the Dutch economy - highly dependent on an international financial sector and international trade - contracted by 3.5% in 2009 as a result of the global financial crisis. The Dutch financial sector suffered, due in part to the high exposure of some Dutch banks to U.S. mortgage-backed securities. In 2008, the government nationalized two banks and injected billions of dollars of capital into other financial institutions, to prevent further deterioration of a crucial sector. The government also sought to boost the domestic economy by accelerating infrastructure programs, offering corporate tax breaks for employers to retain workers, and expanding export credit facilities. The stimulus programs and bank bailouts, however, resulted in a government budget deficit of 5.3% of GDP in 2010 that contrasted sharply with a surplus of 0.7% in 2008. The government of Prime Minister Mark RUTTE began implementing fiscal consolidation measures in early 2011, mainly reductions in expenditures, which resulted in an improved budget deficit of 3.8% of GDP.
|
Source : CIA |
CONTACTINFORMATION
|
Company
name |
CYTEC
INDUSTRIES B.V. |
|
Tradename |
Cytec
Industries B.V. |
|
|
Cytec |
|
Address |
Burgemeester
Van Lierplein 75 |
|
|
3134ZB
Vlaardingen |
|
|
Netherlands |
|
Mail
address |
Postbus
155 |
|
|
3130AD
Vlaardingen |
|
|
Netherlands |
|
Telephone
number |
0107137000 |
|
Telefax
number |
0107137001 |
|
E-mail
address |
unknown |
|
Website |
|
|
VAT
number / RSIN |
001252100 |
|
Branch(es) |
Cytec
Industries B.V. (24108520.0002) |
|
|
Burgemeester
Van Lierplein 75 |
|
|
3134ZB
Vlaardingen |
COMPANY INFORMATION
Handelsregisternummer 24108520
Registered in Chamber
of commerce Rotterdam
First registration 28-02-1966
Act of foundation 04-05-1965
Date of constitution 04-05-1965
Continuation date 30-11-1972
Last change in statutes 12-05-2011
Legal form Private Company
Place of constitution Rotterdam
Issued capital 18.153.000
Paid up capital 18.153.000
NACE-code MANUFACTURE
OF CHEMICALS AND CHEMICAL PRODUCTS (24)
Manufacture of other chemical products
n.e.c. (2466)
SBI-code Manufacture of plastics in primary forms
(2016)
Wholesale of basic and industrial chemicals
(46751)
Formal objective De vervaardiging van en de
handel in chemicaliën en chemische produkten en alle aanverwante
grondstoffen/halffabrikaten en eindprodukten
|
Employees |
Total: 14 |
|
|
|
Employees
according to CoC |
Chamber of
commerce: 14 |
|
|
|
Bookyear |
2013 |
2012 |
2011 |
|
Number |
14 |
45 |
60 |
|
Change |
-68,89% |
-25,00% |
-25,00% |
Bank MeesPierson NV
ABN Amro Bank NV
Account number: 47.54.60.731
Fortis Bank (Netherlands) NV
Account number: 25.18.48.825
Real estate Lease
MANAGEMENT
Management T.J. Irwin
Thomas John
Authorization: Jointly authorized
Position: Manager
Date appointed: 15-10-2012
Date of birth: 24-04-1965
A.L. Schiebroek
Adrianus Laurentius
Authorization: Jointly authorized
Position: Manager
Date appointed: 28-04-2002
Date of birth: 24-11-1957
A. Sulce
Andra
Authorization: Jointly authorized
Position: Manager
Date appointed: 15-10-2012
Date of birth: 29-09-1968
A.L. Schiebroek
Adrianus Laurentius
Authorization: Fully authorized
Position: Proxy
Date appointed: 01-07-1997
Date of birth: 24-11-1957
PAYMENT INFORMATION
Payments Based on multiple payment experiences up to € 10.000
Quarter: 2 2012: 52 Average days
Quarter: 3 2012: 52 Average days
Quarter: 4 2012: 52 Average days
Quarter: 1 2013: 52 Average days
FINANCIAL INFORMATION
Auditor KPMG
Publication financial statement Annual accounts 2011 are published on 29-08-2012
Type of publication Corporate
Publication Steady
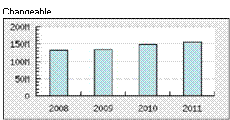
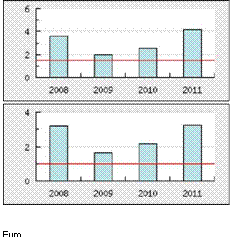
CORE FIGURES
|
BOOKYEAR |
2011 |
2010 |
2009 |
|
Quick
ratio |
3,25 |
2,15 |
1,64 |
|
Current
ratio |
4,15 |
2,56 |
1,99 |
|
Nett
workingcapital / Balance total |
0,33 |
0,28 |
0,25 |
|
Capital
and reserves / Balance total |
0,89 |
0,81 |
0,73 |
|
Capital
and reserves / Fixed assets |
1,59 |
1,49 |
1,49 |
|
Solvency |
8,48 |
4,59 |
2,85 |
|
Nett
workingcapital |
57.795.000 |
49.917.000 |
46.825.000 |
|
Capital
and reserves |
155.386.000 |
147.073.000 |
134.736.000 |
|
Change
capital and reserves |
5,65% |
9,16% |
3,09% |
|
change
short term liabilities |
-42,76% |
-32,37% |
4,66% |
|
Nett
Turnover |
134.768.000 |
165.610.000 |
168.936.000 |
|
Operating
profit |
9.820.000 |
15.224.000 |
-5.050.000 |
|
Profitability
operating profit |
positive |
positive |
negative |
Annual accounts The company is obligated to publish its annual accounts
Last annual accounts 2011
Type of publication Corporate
Turnover 2011: 134.768.000
2010: 165.610.000
2009: 168.936.000
2008: 189.280.000
2007: 201.938.000
2006: 315.163.000
Gross profit 2011: 22.512.000
2007: 18.082.000
2006: 16.483.000
Operating profit 2011: 9.820.000
2010: 15.224.000
2009: -5.050.000
2008: 5.302.000
2007: 50.457.000
2006: 11.648.000
Result after taxes 2011: 8.007.000
2010: 12.006.000
2009: -69.000
2008: 10.554.000
2007: 50.860.000
2006: -3.756.000
Tendency
Tendency capital and reserves
Capital and reserves 2011
155.386.000
Total debt 2011
18.695.000
Current ratio 2011
4,15
Quick ratio 2011
3,25
Nett workingcapital 2011
57.795.000
Profitability More
than sufficient
Solvency More
than sufficient
Liquidity Just
satisfactory
Current- & Quickratio
Balance
|
BOOKYEAR |
2011 |
2010 |
2009 |
|
End of bookyear |
31-12-2011 |
31-12-2010 |
31-12-2009 |
|
Intangible assets |
7.416.000 |
8.343.000 |
|
|
Other tangible
assets |
|
501.000 |
742.000 |
|
Tangible assets |
839.000 |
501.000 |
742.000 |
|
Other financial
assets |
|
89.708.000 |
89.733.000 |
|
Financial assets |
89.708.000 |
89.708.000 |
89.733.000 |
|
Fixed assets |
97.963.000 |
98.552.000 |
90.475.000 |
|
|
|||
|
Stocks and work in
progress |
16.625.000 |
13.034.000 |
16.462.000 |
|
Trade debtors |
10.686.000 |
23.342.000 |
22.435.000 |
|
Other amounts
receivable |
45.177.000 |
45.551.000 |
42.933.000 |
|
Accounts receivable |
55.863.000 |
68.893.000 |
65.368.000 |
|
Liquid assets |
3.630.000 |
|
12.324.000 |
|
Deferred charges
and accrued income |
|
45.551.000 |
42.933.000 |
|
Current assets |
76.118.000 |
81.927.000 |
94.154.000 |
|
Total assets |
174.081.000 |
180.479.000 |
184.629.000 |
|
|
|||
|
Capital and
reserves |
155.386.000 |
147.073.000 |
134.736.000 |
|
Provisions |
372.000 |
1.396.000 |
2.564.000 |
|
Trade debts
suppliers |
3.035.000 |
5.595.000 |
2.758.000 |
|
Other short term
debts |
15.288.000 |
26.415.000 |
44.571.000 |
|
Total short term
debt |
18.323.000 |
32.010.000 |
47.329.000 |
|
Total debt |
18.695.000 |
32.010.000 |
47.329.000 |
|
Total Liabilities |
174.081.000 |
180.479.000 |
184.629.000 |
|
|
|||
|
PROFIT & LOSS
ACCOUNT |
|
|
|
|
BOOKYEAR |
2011 |
2010 |
2009 |
|
Turnover |
137.665.000 |
165.610.000 |
168.936.000 |
|
Other operating
income |
2.897.000 |
|
|
|
Nett Turnover |
134.768.000 |
165.610.000 |
168.936.000 |
|
Gross profit |
22.512.000 |
|
|
|
Wages employees |
6.112.000 |
7.128.000 |
14.556.000 |
|
Sales costs |
112.256.000 |
|
|
|
Raw materials |
|
136.700.000 |
155.639.000 |
|
Other operating
charges |
9.477.000 |
6.558.000 |
3.791.000 |
|
Operating charges |
127.845.000 |
150.386.000 |
173.986.000 |
|
Operating profit |
9.820.000 |
15.224.000 |
-5.050.000 |
|
Financial income |
1.081.000 |
1.012.000 |
5.191.000 |
|
Financial charges |
259.000 |
1.177.000 |
79.000 |
|
Financial result |
822.000 |
-165.000 |
5.112.000 |
|
Result before taxes |
10.642.000 |
15.059.000 |
62.000 |
|
Income taxes |
2.635.000 |
3.053.000 |
131.000 |
|
Result after taxes |
8.007.000 |
12.006.000 |
-69.000 |
|
Nett result |
8.007.000 |
12.006.000 |
-69.000 |
History
Management Per
10-12-2012 is Proxy Johannes Gerardus Maria Drieman out of office.
Per 10-12-2012 is Proxy Duncan Adrian Taylor
out of office.
Per 10-12-2012 is Proxy Rowana van der Hijde
out of office.
Per 10-12-2012 is Proxy Ronald René
Bestebreurtje out of office.
Per 10-12-2012 is Proxy Peggy Maria Marcella
Martens out of office.
Per 15-10-2012 manager Andra Sulce
appointed.
Per 15-10-2012 manager Thomas John Irwin
appointed.
Per 15-10-2012 manager Johannes Gerardus
Maria Drieman out of office.
Per 15-10-2012 manager Duncan Adrian Taylor
out of office.
Company structure
- Cytec Industries B.V. (24108520)
Vlaardingen
FOREIGN EXCHANGE RATES
|
Currency |
Unit
|
Indian Rupees |
|
US Dollar |
1 |
Rs.53.89 |
|
|
1 |
Rs.84.92 |
|
Euro |
1 |
Rs.72.51 |
INFORMATION DETAILS
|
Report Prepared
by : |
SDA |
RATING EXPLANATIONS
|
RATING |
STATUS |
PROPOSED CREDIT LINE |
|
|
>86 |
Aaa |
Possesses an extremely sound financial base with the strongest capability
for timely payment of interest and principal sums |
Unlimited |
|
71-85 |
Aa |
Possesses adequate working capital. No caution needed for credit
transaction. It has above average (strong) capability for payment of interest
and principal sums |
Large |
|
56-70 |
A |
Financial & operational base are regarded healthy. General
unfavourable factors will not cause fatal effect. Satisfactory capability for
payment of interest and principal sums |
Fairly Large |
|
41-55 |
Ba |
Overall operation is considered normal. Capable to meet normal
commitments. |
Satisfactory |
|
26-40 |
B |
Capability to overcome financial difficulties seems comparatively
below average. |
Small |
|
11-25 |
Ca |
Adverse factors are apparent. Repayment of interest and principal sums
in default or expected to be in default upon maturity |
Limited with
full security |
|
<10 |
C |
Absolute credit risk exists. Caution needed to be exercised |
Credit not
recommended |
|
---- |
NB |
New Business |
---- |
This score serves as a reference to assess
SC’s credit risk and to set the amount of credit to be extended. It is
calculated from a composite of weighted scores obtained from each of the major
sections of this report. The assessed factors and their relative weights (as
indicated through %) are as follows:
Financial
condition (40%) Ownership
background (20%) Payment
record (10%)
Credit history
(10%) Market trend (10%) Operational size
(10%)
This report is issued at your request without any
risk and responsibility on the part of MIRA INFORM PRIVATE LIMITED (MIPL)
or its officials.