MIRA INFORM REPORT
|
Report Date : |
02.07.2013 |
IDENTIFICATION DETAILS
|
Name : |
AC
ANALYTICAL CONTROLS B.V. |
|
|
|
|
Registered Office : |
Innsbruckweg
35 3047AG Rotterdam |
|
|
|
|
Country : |
Netherlands |
|
|
|
|
Financials (as on) : |
31.12.2011 |
|
|
|
|
Date of Incorporation : |
21.04.1980 |
|
|
|
|
Com. Reg. No.: |
24197331 |
|
|
|
|
Legal Form : |
Private Company |
|
|
|
|
Line of Business : |
Manufacture of measuring, regulating
and control devices (not
for monitoring |
|
|
|
|
No. of Employees : |
55 |
RATING & COMMENTS
|
MIRA’s Rating : |
Ba |
|
RATING |
STATUS |
PROPOSED CREDIT LINE |
|
|
41-55 |
Ba |
Overall operation is considered normal. Capable to meet normal
commitments. |
Satisfactory |
|
Status : |
Satisfactory |
|
Payment Behaviour : |
No Complaints |
|
Litigation : |
Clear |
NOTES:
Any query related to this report can be made
on e-mail: infodept@mirainform.com
while quoting report number, name and date.
ECGC Country Risk Classification List – March, 31st, 2013
|
Country Name |
Previous Rating (31.12.2012) |
Current Rating (31.03.2013) |
|
Netherlands |
A1 |
A1 |
|
Risk Category |
ECGC
Classification |
|
Insignificant |
A1 |
|
Low |
A2 |
|
Moderate |
B1 |
|
High |
B2 |
|
Very High |
C1 |
|
Restricted |
C2 |
|
Off-credit |
D |
NETHERLANDS - ECONOMIC OVERVIEW
The Dutch economy is the sixth-largest economy in the euro-zone
and is noted for its stable industrial relations, moderate unemployment and
inflation, a sizable trade surplus, and an important role as a European
transportation hub. Industrial activity is predominantly in food processing,
chemicals, petroleum refining, and electrical machinery. A highly mechanized
agricultural sector employs only 2% of the labor force but provides large
surpluses for the food-processing industry and for exports. The Netherlands,
along with 11 of its EU partners, began circulating the euro currency on 1
January 2002. After 26 years of uninterrupted economic growth, the Dutch
economy - highly dependent on an international financial sector and
international trade - contracted by 3.5% in 2009 as a result of the global
financial crisis. The Dutch financial sector suffered, due in part to the high
exposure of some Dutch banks to U.S. mortgage-backed securities. In 2008, the
government nationalized two banks and injected billions of dollars of capital
into other financial institutions, to prevent further deterioration of a
crucial sector. The government also sought to boost the domestic economy by
accelerating infrastructure programs, offering corporate tax breaks for
employers to retain workers, and expanding export credit facilities. The
stimulus programs and bank bailouts, however, resulted in a government budget
deficit of 5.3% of GDP in 2010 that contrasted sharply with a surplus of 0.7%
in 2008. The government of Prime Minister Mark RUTTE began implementing fiscal
consolidation measures in early 2011, mainly reductions in expenditures, which
resulted in an improved budget deficit in 2011. In 2012 tax revenues dropped
nearly 9%, GDP contracted, and the budget deficit deteriorated. Although
jobless claims continued to grow, the unemployment rate remained relatively low
at 6.8 percent.
|
Source
: CIA |
CONTACTINFORMATION
|
Company
name |
AC
ANALYTICAL CONTROLS B.V. |
|
Tradename |
AC
Analytical Controls B.V. |
|
Address |
Innsbruckweg
35 |
|
|
3047AG
Rotterdam |
|
|
Netherlands |
|
Mail
address |
Postbus
10054 |
|
|
3004AB
Rotterdam |
|
|
Netherlands |
|
Telephone
number |
0104624811 |
|
Telefax
number |
0104626330 |
|
E-mail
address |
|
|
Website |
|
|
VAT number
/ RSIN |
005806240 |
COMPANY INFORMATION
Handelsregisternummer 24197331
Registered in Chamber
of commerce Rotterdam
Act of foundation 04-05-1981
Date of constitution 21-04-1980
Last change in statutes 17-07-1987
Legal form Private Company
Place of constitution Delft
Capital EUR
Issued capital EUR
399.326,59
Paid up capital EUR 399.326,59
NACE-code Manufacture of measuring, regulating and control devices
(not for monitoring
industrial processes) (3320)
SBI-code Manufacture of
instruments for measuring, testing and navigation; watches and clocks (265)
Manufacture of instruments for measuring,
testing, navigation and controlling (2651)
Formal objective The modificieren, manufacture, sell and sup-porting analysis equipment
and
accessories for the
international petrochemical market.
|
Employees |
Total:
55 |
|
|
|
Employees according
to CoC |
Chamber
of commerce: 55 |
|
|
|
Bookyear |
2013 |
2012 |
2011 |
|
Number |
55 |
55 |
70 |
|
Change |
0,00% |
-21,43% |
9,38% |
Real estate Unknown
COMPANY STRUCTURE
|
Shareholder |
AC Analytical Controls Holding B.V. |
|
|
Innsbruckweg 35 |
|
|
3047AG ROTTERDAM |
|
|
Netherlands |
|
|
KvK: 24251810 |
|
|
Active since: 29-12-1994 |
|
|
Percentage: 100.00% |
|
Ultimate
parent company |
Roper Scientific SAS |
|
|
990005507226 |
|
Holding
company |
AC Analytical Controls Holding B.V. |
|
|
Innsbruckweg 35 |
|
|
3047AG ROTTERDAM |
|
|
KvK: 24251810 |
|
Affiliated
companies |
AC Analytical Controls Services B.V. |
|
|
Innsbruckweg 35 |
|
|
3047AG ROTTERDAM |
|
|
KvK: 24259093 |
Bank ABN Amro Bank NV
ING Bank NV
Real estate Unknown
The real Estate is checked at the land registration office
MANAGEMENT
Management AC
Analytical Controls Holding B.V.
Innsbruckweg 35
3047AG ROTTERDAM
Netherlands
KvK: 24251810
Authorization: Fully authorized
Position: Manager
Date appointed: 28-12-2005
E.J. Klok
Evert Jan
Authorization: Limited authorization (max: €
500.000)
Position: Vice president
Date appointed: 01-10-2000
Date of birth: 26-07-1960
R. Moerlie
Rambhawansing
Authorization: Limited authorization
Position: Proxy
Date appointed: 01-01-1998
Date of birth: 04-05-1967
V. Otten
Vincent
Authorization: Limited authorization (max: €
500.000)
Position: Proxy
Date appointed: 01-09-2010
Date of birth: 15-04-1976
R.L. Vollering
Raymond Liduinus
Authorization: Limited authorization (max: €
500.000)
Position: Proxy
Date appointed: 28-07-2008
Date of birth: 09-12-1978
FINANCIAL INFORMATION
Auditor Accountantskantoor Unknown
Publication financial statement Annual
accounts 2011 are published on 28-08-2012
Annual accounts 2010 are published on 28-03-2012
Annual accounts 2009 are published on
04-01-2012
Annual accounts 2008 are published on
21-02-2011
Annual accounts 2007 are published on
21-02-2011
Type of publication Corporate
Publication Publication
according to obligations by law
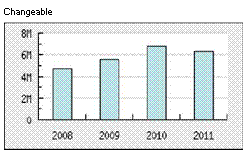
CORE FIGURES
|
BOOKYEAR |
2011 |
2010 |
2009 |
|
Quick ratio |
1,79 |
1,95 |
1,72 |
|
Current ratio |
2,39 |
2,37 |
2,23 |
|
Nett workingcapital
/ Balance total |
0,55 |
0,55 |
0,53 |
|
Capital and
reserves / Balance total |
0,60 |
0,59 |
0,56 |
|
Capital and
reserves / Fixed assets |
11,28 |
11,42 |
11,95 |
|
Solvency |
1,51 |
1,48 |
1,32 |
|
Nett workingcapital |
5.834.000 |
6.261.000 |
5.184.000 |
|
Capital and
reserves |
6.317.000 |
6.782.000 |
5.558.000 |
|
Change capital and
reserves |
-6,86% |
22,02% |
17,23% |
|
change short term
liabilities |
-8,34% |
8,35% |
-24,04% |
|
Nett Turnover |
22.867.000 |
20.273.000 |
16.779.000 |
|
Operating profit |
2.740.000 |
1.553.000 |
1.223.000 |
|
Profitability
operating profit |
positive |
positive |
positive |
Annual accounts The
company is obligated to publish its annual accounts
Last annual accounts
2011
|
Type of publication |
Corporate |
|
|
Turnover |
2011: |
22.867.000 |
|
|
2010: |
20.273.000 |
|
|
2009: |
16.779.000 |
|
|
2008: |
19.963.000 |
|
|
2007: |
19.672.000 |
|
Gross profit |
2006: |
7.104.000 |
|
|
2005: |
6.462.000 |
|
|
2004: |
5.921.000 |
|
Operating profit |
2011: |
2.740.000 |
|
|
2010: |
1.553.000 |
|
|
2009: |
1.223.000 |
|
|
2008: |
2.029.000 |
|
|
2007: |
1.391.000 |
|
|
2006: |
539.000 |
|
|
2005: |
646.000 |
|
|
2004: |
530.000 |
|
Result after taxes |
2011: |
2.008.000 |
|
|
2010: |
1.224.000 |
|
|
2009: |
817.000 |
|
|
2008: |
1.467.000 |
|
|
2007: |
981.000 |
|
|
2006: |
481.000 |
|
|
2005: |
494.000 |
|
|
2004: |
358.000 |
Tendency Changeable
Tendency capital and reserves
Capital and reserves 2011
6.317.000
Total debt 2011
4.187.000
Current ratio 2011
2,39
Quick ratio 2011
1,79
Nett workingcapital 2011
5.834.000
Profitability More
than sufficient
Solvency Sufficient
Liquidity Sufficient
BALANCE
|
BOOKYEAR |
2011 |
2010 |
2009 |
|
End of bookyear |
31-12-2011 |
31-12-2010 |
31-12-2009 |
|
Intangible
assets |
307.000 |
360.000 |
301.000 |
|
Tangible
assets |
253.000 |
234.000 |
165.000 |
|
Fixed
assets |
560.000 |
594.000 |
465.000 |
|
|
|||
|
Stocks and
work in progress |
2.516.000 |
1.939.000 |
2.130.000 |
|
Trade debtors |
3.324.000 |
4.405.000 |
3.693.000 |
|
Other amounts
receivable |
2.111.000 |
2.241.000 |
2.061.000 |
|
Accounts
receivable |
5.435.000 |
6.646.000 |
5.754.000 |
|
Liquid
assets |
2.071.000 |
2.245.000 |
1.515.000 |
|
Deferred
charges and accrued income |
2.111.000 |
2.241.000 |
2.061.000 |
|
Current
assets |
10.021.000 |
10.829.000 |
9.400.000 |
|
Total
assets |
10.581.000 |
11.424.000 |
9.865.000 |
|
|
|||
|
Capital
and reserves |
6.317.000 |
6.782.000 |
5.558.000 |
|
Provisions |
78.000 |
73.000 |
91.000 |
|
Trade debts
suppliers |
776.000 |
1.222.000 |
726.000 |
|
Short term interest
yielding debt |
656.000 |
656.000 |
656.000 |
|
Other short term
debts |
2.755.000 |
2.690.000 |
2.834.000 |
|
Total
short term debt |
4.187.000 |
4.568.000 |
4.216.000 |
|
Total debt |
4.187.000 |
4.568.000 |
4.216.000 |
|
Total
Liabilities |
10.581.000 |
11.424.000 |
9.865.000 |
|
|
|||
|
PROFIT & LOSS
ACCOUNT |
|
|
|
|
BOOKYEAR |
2011 |
2010 |
2009 |
|
Turnover |
22.867.000 |
20.273.000 |
16.779.000 |
|
Nett
Turnover |
22.867.000 |
20.273.000 |
16.779.000 |
|
Wages employees |
4.159.000 |
3.717.000 |
3.536.000 |
|
Depreciation and
amortization |
208.000 |
191.000 |
156.000 |
|
Raw materials |
11.832.000 |
11.039.000 |
8.375.000 |
|
Other operating
charges |
3.928.000 |
3.773.000 |
3.489.000 |
|
Operating
charges |
20.127.000 |
18.720.000 |
15.556.000 |
|
Operating
profit |
2.740.000 |
1.553.000 |
1.223.000 |
|
Financial income |
14.000 |
29.000 |
13.000 |
|
Financial charges |
3.000 |
|
88.000 |
|
Financial
result |
11.000 |
|
-75.000 |
|
Result
before taxes |
2.751.000 |
|
1.148.000 |
|
Income taxes |
744.000 |
358.000 |
331.000 |
|
Result
after taxes |
2.007.000 |
|
817.000 |
|
Nett
result |
2.008.000 |
1.224.000 |
817.000 |
Company structure
•
Roper Scientific SAS (990005507226)
o Roper
Scientific B.V. (30127805)
VIANEN UT
Subsidiary
■ AC
Analytical Controls Holding B.V. (24251810)
ROTTERDAM
Subsidiary
■ AC
Analytical Controls B.V. (24197331) Rotterdam
Subsidiary (100%)
■
AC Analytical
Controls Services B.V. (24259093)
ROTTERDAM
Subsidiary (100%)
■ Sinmed
Holding International B.V. (29046105)
REEUWIJK
Subsidiary
■ Sinmed
B.V. (24376183)
REEUWIJK
Subsidiary
■ Compressor
Controls Corporation B.V. (34145176) ZWANENBURG
Subsidiary
FOREIGN EXCHANGE RATES
|
Currency |
Unit
|
Indian Rupees |
|
US Dollar |
1 |
Rs.59.15 |
|
|
1 |
Rs.90.05 |
|
Euro |
1 |
Rs.77.06 |
INFORMATION DETAILS
|
Report Prepared
by : |
SDA |
RATING EXPLANATIONS
|
RATING |
STATUS |
PROPOSED CREDIT LINE |
|
|
>86 |
Aaa |
Possesses an extremely sound financial base with the strongest
capability for timely payment of interest and principal sums |
Unlimited |
|
71-85 |
Aa |
Possesses adequate working capital. No caution needed for credit
transaction. It has above average (strong) capability for payment of interest
and principal sums |
Large |
|
56-70 |
A |
Financial & operational base are regarded healthy. General
unfavourable factors will not cause fatal effect. Satisfactory capability for
payment of interest and principal sums |
Fairly Large |
|
41-55 |
Ba |
Overall operation is considered normal. Capable to meet normal
commitments. |
Satisfactory |
|
26-40 |
B |
Capability to overcome financial difficulties seems comparatively below
average. |
Small |
|
11-25 |
Ca |
Adverse factors are apparent. Repayment of interest and principal sums
in default or expected to be in default upon maturity |
Limited with
full security |
|
<10 |
C |
Absolute credit risk exists. Caution needed to be exercised |
Credit not
recommended |
|
---- |
NB |
New Business |
---- |
This score serves as a reference to assess
SC’s credit risk and to set the amount of credit to be extended. It is
calculated from a composite of weighted scores obtained from each of the major
sections of this report. The assessed factors and their relative weights (as
indicated through %) are as follows:
Financial
condition (40%) Ownership
background (20%) Payment
record (10%)
Credit history
(10%) Market trend (10%) Operational size
(10%)
This report is issued at your request without any
risk and responsibility on the part of MIRA INFORM PRIVATE LIMITED (MIPL)
or its officials.