MIRA
INFORM REPORT
|
Report Date : |
04.07.2013 |
IDENTIFICATION DETAILS
|
Name : |
MINH PHU SEAFOOD JOINT STOCK COMPANY |
|
|
|
|
Registered Office : |
Ward 8 Industrial Zone, Ward 8, Ca |
|
|
|
|
Country : |
|
|
|
|
|
Financials (as on) : |
31.03.2013 |
|
|
|
|
Year of Incorporation : |
1992 |
|
|
|
|
Com. Reg. No.: |
2000393273 |
|
|
|
|
Legal Form : |
Joint Stock Company |
|
|
|
|
Line of Business : |
Processing, importing and exporting seafood |
|
|
|
|
No. of Employees : |
Over 10,000 |
RATING & COMMENTS
|
MIRA’s Rating : |
Ba |
|
RATING |
STATUS |
PROPOSED CREDIT LINE |
|
|
41-55 |
Ba |
Overall operation is considered normal. Capable to meet normal
commitments. |
Satisfactory |
|
Status : |
Satisfactory |
|
Payment Behaviour : |
No Complaints |
|
Litigation : |
Clear |
NOTES :
Any query related to this report can be made on
e-mail: infodept@mirainform.com
while quoting report number, name and date.
ECGC Country Risk Classification List – March 31st, 2013
|
Country Name |
Previous Rating (31.12.2012) |
Current Rating (31.03.2013) |
|
Vietnam |
B1 |
B1 |
|
Risk Category |
ECGC
Classification |
|
Insignificant |
A1 |
|
Low |
A2 |
|
Moderate |
B1 |
|
High |
B2 |
|
Very High |
C1 |
|
Restricted |
C2 |
|
Off-credit |
D |
VIETNAM - ECONOMIC OVERVIEW
Vietnam is a densely-populated developing country that has
been transitioning from the rigidities of a centrally-planned economy since
1986. Vietnamese authorities have reaffirmed their commitment to economic
modernization in recent years. Vietnam joined the World Trade Organization in
January 2007, which has promoted more competitive, export-driven industries.
Vietnam became an official negotiating partner in the Trans-Pacific Partnership
trade agreement in 2010. Agriculture's share of economic output has continued
to shrink from about 25% in 2000 to less than 22% in 2012, while industry's
share increased from 36% to nearly 41% in the same period. State-owned
enterprises account for roughly 40% of GDP. Poverty has declined significantly,
and Vietnam is working to create jobs to meet the challenge of a labor force
that is growing by more than one million people every year. The global
recession hurt Vietnam's export-oriented economy, with GDP in 2012 growing at
5%, the slowest rate of growth since 1999. In 2012, however, exports increased
by more than 18%, year-on-year; several administrative actions brought the
trade deficit back into balance. Between 2008 and 2011, Vietnam's managed
currency, the dong, was devalued in excess of 20%, but its value remained stable
in 2012. Foreign direct investment inflows fell 4.5% to $10.5 billion in 2012.
Foreign donors have pledged $6.5 billion in new development assistance for
2013. Hanoi has oscillated between promoting growth and emphasizing
macroeconomic stability in recent years. In February 2011, the Government
shifted policy away from policies aimed at achieving a high rate of economic
growth, which had stoked inflation, to those aimed at stabilizing the economy,
through tighter monetary and fiscal control. Although Vietnam unveiled a broad,
"three pillar" economic reform program in early 2012, proposing the
restructuring of public investment, state-owned enterprises, and the banking
sector, little perceptible progress had been made by early 2013. Vietnam's economy
continues to face challenges from an undercapitalized banking sector.
Non-performing loans weigh heavily on banks and businesses. In September 2012,
the official bad debt ratio climbed to 8.8%, though some independent analysts
believe it could be higher than 15%.
Source
: CIA
SUBJECT IDENTIFICATION &
LEGAL FORM
|
||
|
|
||
Current legal status
|
||
|
Registered English Name |
|
MINH PHU SEAFOOD JOINT STOCK COMPANY |
|
Registered Vietnamese Name |
|
CONG TY CO PHAN TAP DOAN THUY SAN MINH PHU
|
|
Registered Short name |
|
MINH PHU SEAFOOD CORP |
|
Type of Business |
|
Joint stock company |
|
Year Established |
|
1992 |
|
Business Registration No. |
|
2000393273 |
|
Date of Registration |
|
25 Jun 2010 |
|
Place of Registration |
|
Business registration Office of Planning
and Investment Department of Ca Mau Province |
|
Chartered capital |
|
VND 700,000,000,000 |
|
Status |
|
Listed |
|
Stock symbol |
|
MPC |
|
Stock Market |
|
Ho Chi Minh Stock Exchange |
|
Tax code |
|
2000393273 |
|
Total Employees |
|
Over 10,000 |
|
Size |
|
Large |
Historical Identification & Legal form
|
List |
Changed Items |
Date of changes |
|
1 |
Subject has got former Business
Registration No: 6103000072 Changed to: 2000393273 |
25
Jun 2010 |
|
2 |
Subject has got former Registered
Vietnamese Name: CONG TY CO PHAN THUY HAI SAN MINH PHU Changed to: CONG TY CO PHAN TAP DOAN THUY
SAN MINH PHU |
25
Jun 2010 |
|
3 |
Subject has got former Stock Market: Ha Noi
Stock Exchange on 27 Dec 2006 Changed to: Ho Chi Minh Stock Exchange |
26
Dec 2007 |
|
4 |
Subject has got former Chartered capital:
600 billion VND Changed to: 700 billion VND |
25
May 2007 |
|
5 |
Subject has got former Type of Business: Liability
Limited Company Changed to: Joint Stock Company |
12
May 2006 |
|
6 |
Subject has got former Type of Business:
Private Enterprise Changed to: Limited Liability Company |
30
Dec 2002 |
|
7 |
Subject has got former Address: No.2 Str 2
- Do Thanh Collective Zone, Ward 4 - Ca Mau City - Ca Mau Province - Vietnam Changed to: Ward 8 Industrial Zone, Ca Mau
City, Ca Mau province |
N/A |
|
|
||
ADDRESSES
|
||
|
|
||
|
Head Office |
||
|
Address |
|
Ward 8 Industrial Zone, Ward 8, Ca Mau
City, Ca Mau Province, Vietnam |
|
Telephone |
|
(84-780) 3838262/ 3839391/ 3820044 |
|
Fax |
|
(84-780) 3833119/ 3668036 |
|
Email |
|
|
|
Website |
|
|
|
Notes: -
The full address
of the subject is above -
The exact tel
and fax number of the subject are above |
||
|
|
||
|
Branch in Ho Chi
Minh |
||
|
Address |
|
Floor 6 - No.21 Le Quy Don Street, Ward 6,
3 District, Ho Chi Minh City, Vietnam |
|
Telephone |
|
(84-8) 39309631 |
|
Fax |
|
(84-8) 39309624/ 39309625 |
|
Email |
|
|
|
|
||
SUBSIDIARIES AND RELATED
COMPANIES
|
||
|
|
||
|
SUBSIDIARY
COMPANIES |
||
|
1. MINH QUI
SEAFOOD COMPANY LIMITED |
||
|
Business Registration |
|
2000337293 |
|
Date of Registration |
|
18 Aug 2011 |
|
Place of Registration |
|
Ca Mau Department of Planning and Investment |
|
Chartered capital |
|
VND 200,000,000,000 |
|
Tax code |
|
2000337293 |
|
Address |
|
Ward 8 Industrial Park , Ca Mau City, Ca Mau Province, Vietnam |
|
Tel |
|
(84-780) 3839391 |
|
Fax |
|
(84-780) 3833119 |
|
|
||
|
2. MINH PHAT
SEAFOOD PROCESSING COMPANY LIMITED |
||
|
Business Registration |
|
2000369633 |
|
Date of Registration |
|
18 Aug 2011 |
|
Place of Registration |
|
Ca Mau Department of Planning and Investment |
|
Chartered capital |
|
VND 100,000,000,000 |
|
Tax code |
|
2000369633 |
|
Address |
|
Thanh Dien Hamlet, Ly Van Lam Commune, Ca Mau City, Ca Mau Province,
Vietnam |
|
Tel |
|
(84-780) 3838262 / 3820044 |
|
Fax |
|
(84-780) 3833119 |
|
|
||
|
3. MINH PHU -
KIENGIANG SEAFOOD COMPANY LIMITED |
||
|
Business Registration |
|
56-02-000417 |
|
Date of Registration |
|
16 Jan 2006 |
|
Place of Registration |
|
Kien Giang Department of Planning and Investment |
|
Chartered capital |
|
VND 27,000,000,000 |
|
Tax code |
|
1700489532 |
|
Address |
|
Hoa Dien Commune, Kien Luong District, Kien Giang Province, Vietnam |
|
Tel |
|
(84-780) 3838262 |
|
Fax |
|
(84-780) 3833119 |
|
|
||
|
4. MINH PHU
AQUATIC LARVAE COMPANY LIMITED |
||
|
Business Registration |
|
4302000139 |
|
Date of Registration |
|
09 Feb 2006 |
|
Place of Registration |
|
Ninh Thuan Department of Planning and Investment |
|
Chartered capital |
|
VND 9,000,000,000 |
|
Tax code |
|
4500249560 |
|
Address |
|
Hoa Thach Hamlet, An Hai Commune, Ninh Phuoc District, Ninh Thuan Province,
Vietnam |
|
Tel |
|
(84-780) 3838262 |
|
Fax |
|
(84-780) 3833119 |
|
|
||
|
5. MINH PHU -
HAU GIANG SEAFOOD PROCESSING CORPORATION |
||
|
Chartered capital |
|
VND 600,000,000,000 |
|
Tax code |
|
6300033769 |
|
Address |
|
Lot No. 9, Road 3A, Hau River Industrial Zone Dong Phu Commune, Chau
Thanh District, Hau Giang Province, Vietnam |
|
Tel |
|
(84-711) 2228 788 |
|
Fax |
|
(84-711) 2228 789 |
|
|
||
|
6. MINH PHU BIO
CO., LTD |
||
|
Business Registration |
|
6104000049 |
|
Date of Registration |
|
08 Jul 2008 |
|
Place of Registration |
|
Ca Mau Department of Planning and Investment |
|
Tax code |
|
2000502476 |
|
Address |
|
Hamlet 1, Tri Hai Commune, Thoi Binh District, Ca Mau Province,
Vietnam |
|
|
||
|
7. MSEAFOOD
CORPORATION |
||
|
Business Registration |
|
2370515 |
|
Date of Registration |
|
27 Dec 2001 |
|
Place of Registration |
|
California, United States |
|
Address |
|
17934 Point Sur Street, Fountain Valley, CA 92708, United States, CA 92806
, United States of America |
|
Tel |
|
+1.714. 842.7900 |
|
Fax |
|
+1.714. 842.7289 |
|
Website |
|
|
|
|
||
|
8. MINH PHU -
LOC AN AQUACULTURE COMPANY LIMITED |
||
|
Business Registration |
|
3501729783 |
|
Date of Registration |
|
10 Oct 2011 |
|
Place of Registration |
|
Ba Ria-Vung Tau Department of Planning and Investment |
|
Tax code |
|
3501729783 |
|
Address |
|
An Binh Hamlet, Dat Do District, Ba Ria-Vung Tau Province, Vietnam |
|
|
||
|
9. MINH PHU HOA
DIEN AQUACULTURE ONE MEMBER COMPANY |
||
|
Business Registration |
|
1701635962 |
|
Tax code |
|
1701635962 |
|
Address |
|
Group 2 Cang Hamlet, Kien Luong District, Kien Giang Province, Vietnam
|
|
|
||
|
ASSOCIATE
COMPANIES |
||
|
1. MINH PHU HAU
GIANG PORT CORPORATION |
||
|
Business Registration |
|
6300108975 |
|
Tax code |
|
6300108975 |
|
Address |
|
No. 227, Phu Hung hamlet, Chau Thanh District, Hau Giang Province,
Vietnam |
|
|
||
DIRECTORS
|
||
|
|
||
|
1.
NAME |
|
Mr.
LE VAN QUANG |
|
Position |
|
Chairman cum General Director |
|
Date of Birth |
|
28 Oct 1958 |
|
ID Number/Passport |
|
024038687 |
|
ID Issue Date |
|
20 Aug 2002 |
|
ID Issue Place |
|
Police Of Ho Chi Minh
City |
|
Resident |
|
No. 385/37B Dien Bien
Phu Street, Ward 4, 3 District, Ho Chi Minh City, Vietnam |
|
Nationality |
|
Vietnamese |
|
Tel/Mobile phone |
|
+84 913 893 207 |
|
Qualification |
|
Management |
|
|
||
|
2.
NAME |
|
Ms.
CHU THI BINH |
|
Position |
|
Deputy General Director |
|
Date of Birth |
|
26 Jul 1964 |
|
ID Number/Passport |
|
380658194 |
|
ID Issue Date |
|
19 Jun 2001 |
|
ID Issue Place |
|
Police station of Ca
Mau Province |
|
Resident |
|
No. 112 B Phan Boi
Chau Str., 7 Ward, Ca Mau City, Ca Mau Province, Vietnam |
|
Nationality |
|
Vietnamese |
|
Qualification |
|
Management |
|
|
||
|
3.
NAME |
|
Mr.
CHU VAN AN |
|
Position |
|
Deputy General Director |
|
Date of Birth |
|
02 May 1953 |
|
ID Number/Passport |
|
381287588 |
|
Resident |
|
No. 9 Minh Phu
Quarter Collective, Ly Van Lam Commune, Ca Mau City, Ca Mau Province, Vietnam
|
|
Nationality |
|
Vietnamese |
|
|
||
|
4.
NAME |
|
Mr.
THAI HOANG HUNG |
|
Position |
|
Deputy General Director |
|
Date of Birth |
|
1964 |
|
Resident |
|
Residential Quarter
of MINH PHU SEAFOOD CORP, Ward 8, Ca Mau City, Ca Mau Province, Vietnam |
|
Nationality |
|
Vietnamese |
|
|
||
|
5.
NAME |
|
Mr.
NGUYEN TAN ANH |
|
Position |
|
Deputy General Director |
|
Date of Birth |
|
09 Jun 1974 |
|
Resident |
|
B1, Residential
Quarter of MINH PHU SEAFOOD CORP, Ward 8, Ca Mau City, Ca Mau Province,
Vietnam |
|
Nationality |
|
Vietnamese |
|
|
||
|
6.
NAME |
|
Mr.
LE VAN DIEP |
|
Position |
|
Deputy General Director and CFO |
|
Date of Birth |
|
26 Dec 1972 |
|
Resident |
|
No. 212, Nguyen Dinh
Chieu Street, Ward 8, Ca Mau City, Ca Mau Province, Vietnam |
|
Nationality |
|
Vietnamese |
|
7.
NAME |
|
Mr.
BUI ANH DUNG |
|
Position |
|
Deputy General Director |
|
Date of Birth |
|
01 Jan 1975 |
|
Resident |
|
D17-5, Long Thinh
Quarter, Cai Rang District, Can Tho City, Vietnam |
|
Nationality |
|
Vietnamese |
|
Qualification |
|
Management |
|
|
||
|
8.
NAME |
|
Mr.
LE NGOC ANH |
|
Position |
|
Deputy General Director |
|
Date of Birth |
|
20 Apr 1973 |
|
Resident |
|
A4, Residential
Quarter of MINH PHU SEAFOOD CORP, Ward 8, Ca Mau City, Ca Mau Province,
Vietnam |
|
Nationality |
|
Vietnamese |
|
|
||
|
9.
NAME |
|
Mr.
LUU MINH TRUNG |
|
Position |
|
Chief Accountant |
|
Date of Birth |
|
08 Jun 1970 |
|
ID Number/Passport |
|
361628755 |
|
Nationality |
|
Vietnamese |
|
|
||
BUSINESS NATURE AND ACTIVITIES
|
|
|
|
- Processing, importing and exporting seafood |
|
|
IMPORT & EXPORT ACTIVITIES
|
||
|
|
||
|
IMPORT: |
||
|
·
Types of products |
|
Materials, machinery |
|
·
Market |
|
Thailand, Indonesia, the Philippines, Taiwan, Japan, etc |
|
·
Mode of payment |
|
L/C, T/T |
|
|
||
|
EXPORT: |
||
|
·
Types of products |
|
Seafood products |
|
·
Market |
|
USA, Japan, EU countries, Canada, Australia, Hong Kong, Korea, etc. |
|
·
Mode of payment |
|
L/C, T/T |
|
|
||
BANKERS
|
||
|
|
||
|
1.
JOINT STOCK COMMERCIAL BANK FOR FOREIGN TRADE OF VIETNAM CA MAU BRANCH |
||
|
Address |
|
No.3-4C Au Co Street,No.7 Ward, Ca Mau City, Ca Mau Province, Vietnam |
|
Telephone |
|
(84-780) 3835027 |
|
Fax |
|
(84-780) 3833466 |
|
|
||
|
2.
SAIGON THUONG TIN COMMERCIAL JOINT STOCK BANK CA MAU BRANCH |
||
|
Address |
|
No.44 Ly Bon, Ca Mau City, Ca Mau Province, Vietnam |
|
Telephone |
|
(84-780) 3812001 |
|
Fax |
|
(84-780) 3812006 |
|
|
||
|
3.
VIET NAM JOINT STOCK COMMERCIAL BANK FOR INDUSTRY AND TRADE CA MAU BRANCH |
||
|
Address |
|
No.94 Ly Thuong Kiet, Ca Mau City, Ca Mau Province, Vietnam |
|
Telephone |
|
(84-780) 3831102 |
|
|
||
|
4.
BANK FOR INVESTMENT AND DEVELOPMENT OF VIETNAM CA MAU BRANCH |
||
|
Address |
|
No.53 De Tham Street, Ward 2, Ca Mau City, Ca Mau Province, Vietnam |
|
Telephone |
|
(84-780) 3832089 |
|
|
||
|
5.
THE VIETNAM DEVELOPMENT BANK MINH HAI BRANCH |
||
|
Address |
|
No. 7 An Duong Vuong Street, Ward 7, Ca Mau City, Ca Mau Province,
Vietnam |
|
Telephone |
|
(84-780) 3835018 |
|
Fax |
|
(84-780) 3836016 |
|
|
||
SHAREHOLDERS
|
||
|
|
||
Following is founding shareholders of the subject
|
||
|
1.
NAME |
|
Mr.
LE VAN QUANG |
|
Position |
|
Chairman cum General Director |
|
Date of Birth |
|
28 Oct 1958 |
|
ID Number/Passport |
|
024038687 |
|
Issued on |
|
20 Aug 2002 |
|
Issued Place |
|
Police Of Ho Chi Minh City |
|
Resident |
|
No. 385/37B Dien Bien Phu Street, Ward 4,
3 District, Ho Chi Minh City, Vietnam |
|
Home phone |
|
+84 913 893 207 |
|
Nationality |
|
Vietnamese |
|
Number of Shares |
|
15,950,000 |
|
Value of shares |
|
VND 159,500,000,000 |
|
Percentage |
|
22.79% |
|
|
||
|
2.
NAME |
|
Ms.
CHU THI BINH |
|
Position |
|
Deputy General Director |
|
Date of Birth |
|
26 Jul 1964 |
|
ID Number/Passport |
|
380658194 |
|
Issued on |
|
19 Jun 2001 |
|
Issued Place |
|
Police station of Ca Mau Province |
|
Resident |
|
No. 112 B Phan Boi Chau Str., 7 Ward, Ca
Mau City, Ca Mau Province, Vietnam |
|
Nationality |
|
Vietnamese |
|
Number of Shares |
|
15,950,000 |
|
Value of shares |
|
VND 159,500,000,000 |
|
Percentage |
|
22.79% |
|
|
||
|
3.
NAME |
|
Mr.
CHU VAN AN |
|
Position |
|
Deputy General Director |
|
Date of Birth |
|
02 May 1953 |
|
ID Number/Passport |
|
381287588 |
|
Resident |
|
No. 9 Minh Phu Quarter Collective, Ly Van Lam
Commune, Ca Mau City, Ca Mau Province, Vietnam |
|
Nationality |
|
Vietnamese |
|
Number of Shares |
|
1,100,000 |
|
Value of shares |
|
VND 11,000,000,000 |
|
Percentage |
|
1.57% |
|
|
||
FINANCIAL DATA
|
|||
|
|
|||
|
BALANCE
SHEET |
|||
Unit: One VND
|
|||
|
Balance sheet
date |
31/03/2013 |
31/12/2012 |
31/12/2011 |
|
Number of weeks |
13 |
52 |
52 |
|
Audit status |
Unaudited |
Audited |
Audited |
|
Consolidated status |
Unconsolidated |
Consolidated |
Consolidated |
ASSETS
|
|||
|
A – CURRENT
ASSETS |
2,925,830,602,482
|
4,388,614,632,763
|
4,269,271,984,792
|
|
I. Cash and cash
equivalents |
839,326,059,117 |
1,298,619,003,857
|
1,092,050,143,361
|
|
1. Cash |
2,935,671,574 |
31,485,118,507 |
107,660,976,207 |
|
2. Cash equivalents |
836,390,387,543 |
1,267,133,885,350 |
984,389,167,154 |
|
II. Short-term
investments |
214,231,194,189 |
128,384,747,714 |
79,837,226,370 |
|
1. Short-term investments |
224,013,474,189 |
138,167,027,714 |
89,761,306,370 |
|
2. Provisions for devaluation of short-term investments |
-9,782,280,000 |
-9,782,280,000 |
-9,924,080,000 |
|
III. Accounts
receivable |
586,307,448,638 |
577,285,119,435 |
472,712,160,466 |
|
1. Receivable from customers |
510,258,738,077 |
534,722,242,679 |
440,462,646,656 |
|
2. Prepayments to suppliers |
35,746,673,298 |
23,369,903,794 |
26,649,799,035 |
|
3. Inter-company receivable |
0 |
0 |
0 |
|
4. Receivable according to the progress of construction |
0 |
0 |
0 |
|
5. Other receivable |
48,402,885,197 |
28,275,058,286 |
19,018,384,867 |
|
6. Provisions for bad debts |
-8,100,847,934 |
-9,082,085,324 |
-13,418,670,092 |
|
IV. Inventories |
1,222,938,665,231
|
2,228,389,598,540
|
2,408,809,317,557
|
|
1. Inventories |
1,232,512,472,672 |
2,301,566,070,320 |
2,462,562,328,071 |
|
2. Provisions for devaluation of inventories |
-9,573,807,441 |
-73,176,471,780 |
-53,753,010,514 |
|
V. Other Current
Assets |
63,027,235,307 |
155,936,163,217 |
215,863,137,038 |
|
1. Short-term prepaid expenses |
112,161,168 |
1,495,455,602 |
3,358,294,400 |
|
2. VAT to be deducted |
61,381,589,154 |
92,657,134,536 |
155,420,150,276 |
|
3. Taxes and other accounts receivable from the State |
0 |
8,942,525,760 |
8,763,287,256 |
|
4. Other current assets |
1,533,484,985 |
52,841,047,319 |
48,321,405,106 |
|
B. LONG-TERM
ASSETS |
1,786,940,130,475
|
1,881,317,171,189
|
2,056,194,027,466
|
|
I. Long term
accounts receivable |
0 |
112,489,382,844 |
92,225,592,536 |
|
1. Long term account receivable from customers |
0 |
0 |
0 |
|
2. Working capital in affiliates |
0 |
0 |
0 |
|
3. Long-term inter-company receivable |
0 |
0 |
0 |
|
4. Other long-term receivable |
0 |
112,489,382,844 |
92,225,592,536 |
|
5. Provisions for bad debts from customers |
0 |
0 |
0 |
|
II. Fixed assets
|
198,494,571,155 |
1,645,650,809,029
|
1,648,678,615,293
|
|
1. Tangible assets |
173,469,510,813 |
1,291,876,203,564 |
1,323,306,403,936 |
|
- Historical costs |
269,573,015,871 |
1,676,913,350,862 |
1,561,336,531,019 |
|
- Accumulated depreciation |
-96,103,505,058 |
-385,037,147,298 |
-238,030,127,083 |
|
2. Financial leasehold assets |
0 |
0 |
0 |
|
- Historical costs |
0 |
0 |
0 |
|
- Accumulated depreciation |
0 |
0 |
0 |
|
3. Intangible assets |
16,244,833,451 |
99,024,434,708 |
57,062,190,693 |
|
- Initial costs |
20,384,244,603 |
104,256,753,082 |
60,896,179,479 |
|
- Accumulated amortization |
-4,139,411,152 |
-5,232,318,374 |
-3,833,988,786 |
|
4. Construction-in-progress |
8,780,226,891 |
254,750,170,757 |
268,310,020,664 |
|
III. Investment
property |
0 |
0 |
0 |
|
Historical costs |
0 |
0 |
0 |
|
Accumulated depreciation |
0 |
0 |
0 |
|
IV. Long-term
investments |
1,587,852,811,882
|
9,068,753,530 |
160,168,753,530 |
|
1. Investments in affiliates |
1,578,784,058,352 |
0 |
0 |
|
2. Investments in business concerns and joint ventures |
2,180,000,000 |
2,180,000,000 |
2,180,000,000 |
|
3. Other long-term investments |
7,000,000,000 |
7,000,000,000 |
207,000,000,000 |
|
4. Provisions for devaluation of long-term investments |
-111,246,470 |
-111,246,470 |
-49,011,246,470 |
|
V. Other
long-term assets |
592,747,438 |
97,376,707,600 |
135,300,652,221 |
|
1. Long-term prepaid expenses |
77,490,097 |
91,057,013,097 |
105,904,990,453 |
|
2. Deferred income tax assets |
515,257,341 |
6,319,694,503 |
24,839,504,113 |
|
3. Other long-term assets |
0 |
0 |
4,556,157,655 |
|
VI. Goodwill |
0 |
16,731,518,186 |
19,820,413,886 |
|
1. Goodwill |
0 |
16,731,518,186 |
19,820,413,886 |
|
TOTAL ASSETS |
4,712,770,732,957
|
6,269,931,803,952
|
6,325,466,012,258
|
|
|
|||
LIABILITIES
|
|||
|
A- LIABILITIES |
3,381,753,147,146
|
4,889,148,610,669
|
4,707,852,603,427
|
|
I. Current
liabilities |
2,879,588,395,352
|
4,056,858,838,496
|
3,565,128,372,484
|
|
1. Short-term debts and loans |
2,045,761,425,671 |
3,449,058,871,964 |
2,936,239,690,612 |
|
2. Payable to suppliers |
516,490,872,076 |
135,868,027,758 |
313,623,931,737 |
|
3. Advances from customers |
172,373,116,629 |
8,525,302,719 |
7,607,282,515 |
|
4. Taxes and other obligations to the State Budget |
6,689,647,779 |
18,446,907,372 |
64,218,324,764 |
|
5. Payable to employees |
11,895,341,269 |
38,688,257,921 |
52,666,140,501 |
|
6. Accrued expenses |
0 |
105,484,633,458 |
91,187,673,067 |
|
7. Inter-company payable |
0 |
0 |
0 |
|
8. Payable according to the progress of construction contracts |
0 |
0 |
0 |
|
9. Other payable |
52,946,014,729 |
211,370,253,272 |
35,041,880,688 |
|
10. Provisions for short-term accounts payable |
0 |
0 |
0 |
|
11. Bonus and welfare funds |
73,431,977,199 |
89,416,584,032 |
64,543,448,600 |
|
II. Long-Term
Liabilities |
502,164,751,794 |
832,289,772,173 |
1,142,724,230,943
|
|
1. Long-term accounts payable to suppliers |
0 |
0 |
0 |
|
2. Long-term inter-company payable |
0 |
0 |
0 |
|
3. Other long-term payable |
0 |
0 |
0 |
|
4. Long-term debts and loans |
500,000,000,000 |
828,632,880,684 |
1,129,764,991,861 |
|
5. Deferred income tax payable |
0 |
0 |
9,248,315,394 |
|
6. Provisions for unemployment allowances |
2,164,751,794 |
3,656,891,489 |
3,710,923,688 |
|
7. Provisions for long-term accounts payable |
0 |
0 |
0 |
|
8. Unearned Revenue |
0 |
0 |
0 |
|
9. Science and technology development fund |
0 |
0 |
0 |
|
B- OWNER’S
EQUITY |
1,331,017,585,811
|
1,310,050,470,480
|
1,538,891,403,059
|
|
I. OWNER’S
EQUITY |
1,331,017,585,811
|
1,310,050,470,480
|
1,538,891,403,059
|
|
1. Capital |
700,000,000,000 |
700,000,000,000 |
700,000,000,000 |
|
2. Share premiums |
177,876,869,236 |
177,876,869,236 |
177,876,869,236 |
|
3. Other sources of capital |
0 |
0 |
0 |
|
4. Treasury stocks |
0 |
0 |
0 |
|
5. Differences on asset revaluation |
0 |
0 |
0 |
|
6. Foreign exchange differences |
0 |
88,506,239,451 |
88,506,239,451 |
|
7. Business promotion fund |
41,040,616,012 |
58,470,998,521 |
41,298,066,764 |
|
8. Financial reserved fund |
13,769,908,805 |
13,769,908,805 |
0 |
|
9. Other funds |
0 |
0 |
0 |
|
10. Retained earnings |
398,330,191,758 |
271,426,454,467 |
531,210,227,608 |
|
11. Construction investment fund |
0 |
0 |
0 |
|
12. Business arrangement supporting fund |
0 |
0 |
0 |
|
II. Other
sources and funds |
0 |
0 |
0 |
|
1. Sources of expenditure |
0 |
0 |
0 |
|
2. Fund to form fixed assets |
0 |
0 |
0 |
|
MINORITY’S
INTEREST |
0 |
70,732,722,803 |
78,722,005,772 |
|
TOTAL
LIABILITIES AND OWNER’S EQUITY |
4,712,770,732,957
|
6,269,931,803,952
|
6,325,466,012,258
|
|
|
|||
|
PROFIT
& LOSS STATEMENT |
|||
|
|
|||
|
Description |
01/01/2013 - 31/03/2013 |
FY2012 |
FY2011 |
|
1. Total Sales |
1,243,100,323,508
|
7,965,666,905,962
|
7,083,660,612,588
|
|
2. Deduction item |
16,212,499,530 |
29,164,778,420 |
45,134,289,780 |
|
3. Net revenue |
1,226,887,823,978
|
7,936,502,127,542
|
7,038,526,322,808
|
|
4. Costs of goods sold |
1,137,486,061,502 |
7,050,386,436,392 |
5,989,259,197,437 |
|
5. Gross profit |
89,401,762,476 |
886,115,691,150 |
1,049,267,125,371
|
|
6. Financial income |
20,778,540,336 |
62,860,638,501 |
99,386,100,773 |
|
7. Financial expenses |
35,688,892,299 |
419,351,062,292 |
402,046,481,459 |
|
- In which: Loan interest expenses |
33,709,831,092 |
416,734,888,813 |
340,901,136,561 |
|
8. Selling expenses |
32,621,477,968 |
403,716,071,737 |
317,523,408,035 |
|
9. Administrative overheads |
11,528,165,512 |
89,631,724,753 |
98,280,361,276 |
|
10. Net operating profit |
30,341,767,033 |
36,277,470,869 |
330,802,975,374 |
|
11. Other income |
346,550,882 |
3,937,090,474 |
8,239,870,443 |
|
12. Other expenses |
0 |
5,763,525,895 |
1,575,586,366 |
|
13. Other profit /(loss) |
346,550,882 |
-1,826,435,421 |
6,664,284,077 |
|
14. Total accounting profit before tax |
30,688,317,915 |
34,451,035,448 |
337,467,259,451 |
|
15. Current corporate income tax |
7,672,079,479 |
9,301,474,368 |
52,822,946,649 |
|
16. Deferred corporate income tax |
0 |
9,271,494,216 |
946,468,498 |
|
17. Interest from subsidiaries/related companies |
0 |
0 |
0 |
|
18. Profit after tax |
23,016,238,436 |
15,878,066,864 |
283,697,844,304 |
|
|
||||
|
FINANCIAL RATIOS
AND AVERAGE INDUSTRY RATIOS |
||||
|
|
||||
|
Description |
01/01/2013 –
31/03/2013 |
FY2012 |
FY2011 |
Average Industry |
|
Current liquidity ratio |
1.02 |
1.08 |
1.20 |
1.24 |
|
Quick liquidity ratio |
0.59 |
0.53 |
0.52 |
0.64 |
|
Inventory circle |
0.93 |
3.04 |
3.31 |
5.02 |
|
Average receive period |
174.43 |
26.55 |
24.51 |
82.74 |
|
Utilizing asset performance |
0.26 |
1.27 |
1.11 |
1.36 |
|
Liability by total assets |
71.76 |
77.98 |
74.43 |
69.39 |
|
Liability by owner’s equity |
254.07 |
373.20 |
305.92 |
260.95 |
|
Ebit / Total assets (ROA) |
1.37 |
7.20 |
10.72 |
15.09 |
|
Ebit / Owner’s equity (ROE) |
4.84 |
34.44 |
44.08 |
49.87 |
|
Ebit / Total revenue (NPM) |
5.18 |
5.66 |
9.58 |
14.92 |
|
Gross profit / Total revenue (GPM) |
7.19 |
11.12 |
14.81 |
20.48 |
|
Note: The Average Industry was calculated by VietnamCredit based on our own
statistical data |
||||
|
|
||||
|
CASH
FLOW STATEMENT |
|||
|
(Indirect method) |
|||
|
Items |
01/01/2013 – 31/03/2013 |
FY2012 |
FY2011 |
|
I. Cash flows
from operating activities |
|||
|
1. Profit before tax |
30,688,317,915 |
34,451,035,448 |
337,467,259,451 |
|
2. Adjustments |
|
|
|
|
- Depreciation and amortization |
6,033,538,221 |
151,886,043,097 |
92,172,726,929 |
|
- Provisions |
-26,931,420,673 |
12,287,115,500 |
87,476,978,265 |
|
- Unrealized foreign exchange difference |
|
-3,207,118,308 |
-6,214,609,921 |
|
- Gain/loss from investing activities |
-40,757,402,337 |
-46,694,821,587 |
-39,445,465,790 |
|
- Interest expense |
33,709,831,092 |
412,791,349,076 |
340,901,136,561 |
|
3. Operating profit before movements in working
capital |
2,742,864,218 |
561,513,603,226 |
812,358,025,495 |
|
- (Increase)/Decrease in receivables |
-13,245,765,297 |
-71,968,071,650 |
-148,950,150,039 |
|
- (Increase)/Decrease in inventories |
-18,003,838,341 |
160,996,257,751 |
-1,180,515,168,705 |
|
- Increase/(Decrease) in accounts payable |
-5,369,382,538 |
-211,366,178,068 |
263,394,303,425 |
|
- (Increase)/Decrease in prepaid expenses |
144,214,138 |
16,710,816,154 |
0 |
|
- Interest paid |
-67,524,637,919 |
-411,196,349,073 |
-352,121,786,264 |
|
- Corporate income tax paid |
-5,245,320,589 |
-6,551,600,129 |
-64,297,557,844 |
|
- Other cash inflows |
500,000,000 |
|
0 |
|
- Other cash outflows |
-2,027,815,690 |
-46,740,849,401 |
-56,989,034,976 |
|
Net cash from (used in) operating activities |
-108,029,682,018 |
-8,602,371,190 |
-727,121,368,908 |
|
II. Cash flows
from investing activities |
|||
|
1. Acquisition of fixed assets and other long – term assets |
-2,495,903,208 |
-147,230,298,915 |
-782,724,873,995 |
|
2. Proceeds from fixed assets and long – term assets disposal |
|
919,594,405 |
0 |
|
3. Cash outflow for lending, buying debt instruments of other
companies |
-102,362,500,000 |
-114,575,988,828 |
0 |
|
4. Cash recovered from lending, selling debt instruments of other
companies |
|
66,170,267,484 |
7,340,555,968 |
|
5. Investment in other entities |
-1,331,469,190 |
|
-600,000,000 |
|
6. Cash recovered from investments in other entities |
-3,807,117,411 |
144,235,294,118 |
0 |
|
7. Interest income, dividend and profit paid |
40,757,402,337 |
57,012,378,583 |
49,790,398,143 |
|
Net cash from (used in) investing activities |
-69,239,587,472 |
6,531,246,847 |
-726,193,919,884 |
|
III. Cash flows
from financing activities |
|||
|
1. Proceeds from issuing stocks, receiving capital from owners |
|
|
900,000,000 |
|
2. Capital withdrawal, buying back issued stocks |
|
|
0 |
|
3. Proceeds from borrowings |
1,517,722,166,331 |
9,939,364,492,628 |
8,799,853,014,423 |
|
4. Repayment of borrowings |
-1,763,853,929,003 |
-9,724,216,257,626 |
-6,991,132,607,902 |
|
5. Repayment of obligations under finance leased |
|
|
0 |
|
6. Dividends paid |
|
-6,094,297,579 |
-6,680,123,049 |
|
Net cash from (used in) financing activities |
-246,131,762,672 |
209,053,937,423 |
1,802,940,283,472 |
|
Net increase/(decrease) in cash and cash equivalents |
-423,401,032,162 |
206,982,813,080 |
349,624,994,680 |
|
Cash and cash equivalents at beginning of year |
1,262,727,091,279 |
1,092,050,143,361 |
741,370,744,436 |
|
Effect from changing foreign exchange rate |
|
-413,952,584 |
1,054,404,245 |
|
Cash and cash equivalents at end of year |
839,326,059,117 |
1,298,619,003,857 |
1,092,050,143,361 |
|
. |
|||
PAYMENT HISTORY & PERFORMANCE EXPERIENCES
|
||
|
|
||
|
Trade Morality |
|
Good |
|
Liquidity |
|
Medium |
|
Payment status |
|
Average |
|
Financial Situation |
|
Above Average |
|
Development trend |
|
Stable |
|
Litigation data |
|
No Record |
|
Bankruptcy |
|
No Record |
|
Payment Methods |
|
L/C, T/T |
|
Sale Methods |
|
To contracts |
|
Public opinion |
|
Well-known |
|
|
INTERPRETATION ON THE SCORES
|
|
|
|
The
subject was established in 1992 as a private enterprise. At the end of 2002,
it was transferred into limited liability company and up to May 2006 it was equitized
into joint stock company. Currently, the subject is running under the
business registration No. 2000393273 (same as the tax code) with chartered
capital of VND 700 billion. Its total employees are now over 10,000 persons. The
subject is specialized in processing of seafood. Its products are kinds of
shrimps. The subject’s head office and factories are located at Ward 8
Industrial Zone – Ward 8 – Ca Mau City – Ca Mau Province. Besides, it has
also a branch at Hochiminh city and ten subsidiary companies. The
subject now is applying quality management system according to standards of
HACCP, GMP, SSOP, ISO 9001:2000, BRC, ACC, Global Gap, etc and it has also EU
code DL145. The
subject has some subsidiaries specialized in seafood farming. So, almost main
materials for processing have origin in the country. It only imports a small
amount of material from foreign country. Contrarily, most of sea-products of
the subject are exported to many countries in the world such as: USA, Japan,
EU countries, Canada, Australia, Hong Kong, Korea, etc. After
many years of continuous development, the subject has become one of the
leading seafood corporations with the largest seafood export revenue
nationwide. It was honored many rewards such as award of excellent export business
in many consecutive years (from 2003 to 2010), gold globe award in 2007,
Vietnam strong brand award from 2006
to 2009, etc. In
recent years, the subject has invested to increase its processing capacity,
develop the farming area and extend consuming market, moreover shrimp consume
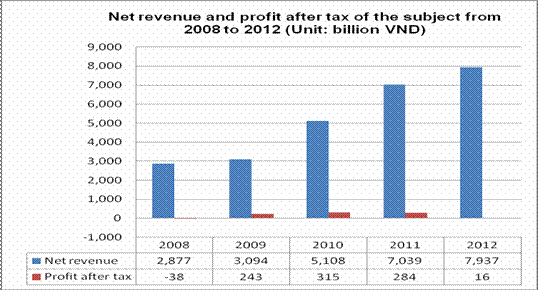
demand in the world also rose significantly. Thus, the subject’s total sale
is large and has uptrend. However, in 2012, the subject did not reach the
proposed plan. Its net revenue was VND 7,936.50 billion meanwhile net revenue
in the plan was VND 10,478 billion. More noticeably, the subject’s profit
after tax fell from VND 283.6 billion in 2011 to VND 15.8 billion in 2012
meanwhile proposed profit after tax in the plan was VND 715 billion. Cause of
this was the difficult economic situation, the scarce material shrimp
(because the early die shrimp syndrome spreaded out across Vietnam, in which
including farming area of the subject in provinces of Kien Giang, Ba Ria-Vung
Tau and Ca Mau), the increase in manufacturing price and financial expenses,
etc. Following
chart shows net revenue and profit after tax of the subject from 2008 to 2012
for reference:
About
the subject’s solvency, based on financial ratios in recent years, we see that
the subject’s liquidity ratios were not high and had downtrend due to the
growth of current liabilities was higher than the growth of current assets.
Besides, the subject’s debt rate increased through years because the
subject’s liabilities lifted year by year while its owner’s equity seemed not
very stable. The foregoing reflects that, the subject’s liquidity is somewhat
limited and the safety in its capital structure went down. In
general, the subject is considered as a large company in the industry.
However, its financial situation is not very strong. Nevertheless, this year
is also predicted to be a difficult year for this field. Thus, caution is
needed for big transactions. |
----------- APPENDIX ----------
INDUSTRY DATA
|
||||||
|
|
||||||
|
Industry code |
GDP growth speed
by price compared with 1994 (%) |
Total
enterprises 2010 |
Total employees
2011 (Thous.pers.) |
Annual average
capital of enterprises 2010 (billion dongs) |
||
|
2012 |
2011 |
|||||
|
Agriculture,
Forestry and Fishing |
2.72 |
4.00 |
8,887 |
24,362.9 |
95,227 |
|
|
Industry and
Construction |
4.52 |
5.53 |
95,217 |
10,718.9 |
3,641,376 |
|
|
Trade and
Services |
6.42 |
6.69 |
187,195 |
15,270.2 |
6,957,082 |
|
|
|
||||||
ECONOMIC INDICATORS
|
||||||
|
|
||||||
|
|
2012 |
2011 |
2010 |
|||
|
Population (Million person) |
88.78 |
87.84 |
86.93 |
|||
|
Gross Domestic Products (USD
billion) |
136 |
119 |
102.2 |
|||
|
GDP Growth (%) |
5.03 |
5.89 |
6.78 |
|||
|
GDP Per Capita
(USD/person/year) |
1,540 |
1,300 |
1,160 |
|||
|
Inflation (% Change in
Composite CPI) |
9.21 |
18.58 |
11.75 |
|||
|
State Budget Deficit compared
with GDP (%) |
4.8 |
4.9 |
5.8 |
|||
|
|
||||||
SERVICE TRADE PERFORMANCE
|
||||||
|
|
||||||
|
Billion USD |
2012 |
2011 |
2010 |
|||
|
Exports |
114.6 |
96.3 |
72.2 |
|||
|
Imports |
114.3 |
105.8 |
84.8 |
|||
|
Trade Balance |
0.3 |
-9.5 |
-12.6 |
|||
Source: General
Statistics Office
FOREIGN EXCHANGE RATES
|
Currency |
Unit
|
Indian Rupees |
|
US Dollar |
1 |
Rs.60.10 |
|
|
1 |
Rs.91.07 |
|
Euro |
1 |
Rs.77.95 |
INFORMATION DETAILS
|
Report
Prepared by : |
PRL |
RATING EXPLANATIONS
|
RATING |
STATUS |
PROPOSED CREDIT LINE |
|
|
>86 |
Aaa |
Possesses an extremely sound financial base with the strongest capability
for timely payment of interest and principal sums |
Unlimited |
|
71-85 |
Aa |
Possesses adequate working capital. No caution needed for credit
transaction. It has above average (strong) capability for payment of interest
and principal sums |
Large |
|
56-70 |
A |
Financial & operational base are regarded healthy. General
unfavourable factors will not cause fatal effect. Satisfactory capability for
payment of interest and principal sums |
Fairly Large |
|
41-55 |
Ba |
Overall operation is considered normal. Capable to meet normal
commitments. |
Satisfactory |
|
26-40 |
B |
Capability to overcome financial difficulties seems comparatively
below average. |
Small |
|
11-25 |
Ca |
Adverse factors are apparent. Repayment of interest and principal sums
in default or expected to be in default upon maturity |
Limited with
full security |
|
<10 |
C |
Absolute credit risk exists. Caution needed to be exercised |
Credit not
recommended |
|
-- |
NB |
New Business |
-- |
This score serves as a reference to assess SC’s credit risk
and to set the amount of credit to be extended. It is calculated from a
composite of weighted scores obtained from each of the major sections of this report.
The assessed factors and their relative weights (as indicated through %) are as
follows:
Financial
condition (40%) Ownership
background (20%) Payment
record (10%)
Credit history
(10%) Market trend
(10%) Operational
size (10%)
This report is issued at your request without any risk
and responsibility on the part of MIRA INFORM PRIVATE LIMITED (MIPL) or its
officials.