MIRA
INFORM REPORT
|
Report Date : |
08.07.2013 |
IDENTIFICATION DETAILS
|
Name : |
BLUCHER METAL AS |
|
|
|
|
Registered Office : |
Pugdalvej 1, 7480 Vildbjerg |
|
|
|
|
Country : |
Denmark |
|
|
|
|
Financials (as on) : |
31.12.2012 |
|
|
|
|
Date of Incorporation : |
19.07.2005 |
|
|
|
|
Com. Reg. No.: |
49260016 |
|
|
|
|
Legal Form : |
Limited Company |
|
|
|
|
Line of Business : |
Manufacturer of tubes, pipes, hollow profiles and
related fittings, of steel |
|
|
|
|
No. of Employees : |
304 |
RATING & COMMENTS
|
MIRA’s Rating : |
Ba |
|
RATING |
STATUS |
PROPOSED CREDIT LINE |
|
|
41-55 |
Ba |
Overall operation is considered normal. Capable to meet normal
commitments. |
Satisfactory |
|
Status : |
Good |
|
|
|
|
Payment Behaviour : |
Regular |
|
|
|
|
Litigation : |
Clear |
NOTES:
Any query related to this report can be made
on e-mail: infodept@mirainform.com
while quoting report number, name and date.
ECGC Country Risk Classification List – March 31st 2013
|
Country Name |
Previous Rating (31.12.2012) |
Current Rating (31.03.2013) |
|
Denmark |
A2 |
A2 |
|
Risk Category |
ECGC
Classification |
|
Insignificant |
A1 |
|
Low |
A2 |
|
Moderate |
B1 |
|
High |
B2 |
|
Very High |
C1 |
|
Restricted |
C2 |
|
Off-credit |
D |
denmark ECONOMIC OVERVIEW
This thoroughly
modern market economy features a high-tech agricultural sector,
state-of-the-art industry with world-leading firms in pharmaceuticals, maritime
shipping and renewable energy, and a high dependence on foreign trade. Denmark
is a member of the European Union (EU); Danish legislation and regulations
conform to EU standards on almost all issues. Danes enjoy a high standard of
living and the Danish economy is characterized by extensive government welfare
measures and an equitable distribution of income. Denmark is a net exporter of
food and energy and enjoys a comfortable balance of payments surplus but
depends on imports of raw materials for the manufacturing sector. Within the
EU, Denmark is among the strongest supporters of trade liberalization. After a
long consumption-driven upswing, Denmark's economy began slowing in 2007 with
the end of a housing boom. Housing prices dropped markedly in 2008-09 and,
following a short respite in 2010, has since continued to decline. The global
financial crisis has exacerbated this cyclical slowdown through increased
borrowing costs and lower export demand, consumer confidence, and investment.
The global financial crisis cut Danish real GDP in 2008-09. Denmark made a
modest recovery in 2010 with real GDP growth of 1.3%, in part because of
increased government spending; however, the country experienced a technical
recession in late 2010-early 2011. Historically low levels of unemployment rose
sharply with the recession and have remained at about 6% in 2010-12, based on
the national measure, about two-thirds average EU unemployment. An impending
decline in the ratio of workers to retirees will be a major long-term issue.
Denmark maintained a healthy budget surplus for many years up to 2008, but the
budget balance swung into deficit in 2009. In spite of the deficits, the new
coalition government delivered a modest stimulus to the economy in 2012.
Nonetheless, Denmark's fiscal position remains among the strongest in the EU
with public debt at about 45% of GDP in 2012. Despite previously meeting the
criteria to join the European Economic and Monetary Union (EMU), so far Denmark
has decided not to join, although the Danish krone remains pegged to the euro.
Denmark held the EU presidency during the first half of 2012; priorities
included promoting a responsible, dynamic, green, and safe Europe, while
working to steer Europe out of its euro zone economic crisis.
|
Source : CIA |
Summary
Company name BLUCHER
METAL A/S
Operative address PUGDALVEJ
1
7480 VILDBJERG
Denmark
Status Active
Specification This
company can meet all its obligations.
Legal form Limited
company - A/S
Registration number Trade
register number: 49260016
Trade
register number: 49260016
VAT-number DK49
26 00 16
![]() Year 2012 Mutation 2011 Mutation 2010
Year 2012 Mutation 2011 Mutation 2010
Fixed assets 15.440.059 -1,84 15.729.534 11,87 14.060.747
 Total equity 33.972.817 19,88 28.339.714 15,52 24.531.814
Short term
liabilities 15.972.964 23,82 12.899.786 18,77 10.861.525
![]() Net result 11.607.667 39,11 8.344.104 1,32 8.235.463
Net result 11.607.667 39,11 8.344.104 1,32 8.235.463
![]() Working capital 20.815.319 35,36 15.378.187 12,00 13.730.390
Working capital 20.815.319 35,36 15.378.187 12,00 13.730.390
Quick
ratio 1,85 12,80 1,64 7,19 1,53

Company information
Company name BLUCHER
METAL A/S
Operative address PUGDALVEJ
1
7480 VILDBJERG
Denmark
Correspondence address PUGDALVEJ
1
7480 VILDBJERG
Denmark
Telephone number +45
99920800
Fax number +45
97133350
Email address mail@blucher.dk
Website www.blucher.dk
Registration
Registration number Trade
register number: 49260016
Trade
register number: 49260016
VAT-number
DK49 26 00 16
Status Active
Establishment date 2005-07-19
Legal form Limited
company - A/S
Subscribed
share capital DKK
18.000.000
Activities
NACE Manufacture of tubes, pipes, hollow
profiles and related fittings, of steel (2420)
Relations
Shareholders ULTIMATE
GLOBAL SHAREHOLDER
Name: HORNE TIMOTHY P
Type: One or more named
individuals or families
Profit loss before tax:
6.97508 mil. EUR
Profit loss after tax net
income: 4.92986 mil. EUR
Shareholders funds: 103.9291
mil. EUR
ULTIMATE DOMESTIC SHAREHOLDER
Name: W ATTS DENMARK HOLDING
APS
Country: DK
Type: Industrial company
Share direct: 100.00%
Share TOTAL: 100.00%
Turnover: 72.11 mil. EUR
TOTAL assets : 171.77 mil. EUR
SHAREHOLDERS
Name: W ATTS DENMARK HOLDING
APS
National id number: 31368006
Address: Pugdalvej 1
Zipcode: 7480
City: VILDBJERG
Country: DK
Type: Industrial company
Share direct: 100.00%
Turnover: 72.11 mil. EUR
TOTAL assets : 171.77 mil. EUR
Profit loss before tax:
6.97508 mil. EUR
Profit loss after tax net
income: 4.92986 mil. EUR
Shareholders funds: 103.9291
mil. EUR
Number of employees: 308
Name: W ATTS W ATER
TECHNOLOGIES, INC.
National id number: 04-2916536
Address: 815, Chestnut Street
Zipcode: 01845
City: NORTH ANDOVER
Country: US
Phone: +1 978 688 1811
FAX: +1 978 794 1848
Website: www.wattswater.com
Type: Industrial company
Turnover: 1445.6 mil. EUR
TOTAL assets : 1709 mil. EUR
Profit loss before tax: 100.3
mil. EUR
Profit loss after tax net
income: 68.4 mil. EUR
Shareholders
funds: 939.5 mil. EUR
Number of employees: 5900
Structure SUBSIDIARIES
Name: BLUCHER FRANCE
National id number:
347577843-00035
Address: 1 ALLEE DU DAUPHINE
Zipcode: 91090
City: LISSES
Country: FR
Type: Industrial company
Share direct: 100.00%
Turnover: 4.46 mil. EUR
Total assets : 1.36 mil. EUR
Profit loss before tax: 0.1511
mil. EUR
Profit loss after tax net
income: 0.11962 mil. EUR
Shareholders funds: 0.90106
mil. EUR
Number of employees: 14
Name: BLUCHER NORW AY AS
National id number: 965 245
820
Address: Holtesletta
Zipcode: 3748
City: SILJAN
Country: NO
Type: Industrial company
Phone: +47 35942650
Fax: +47 35941313
Share direct: 100.00%
Turnover: 7.97 mil. EUR
Total assets : 3.3 mil. EUR
Profit loss before tax: 1.3227
mil. EUR
Profit loss after tax net
income: 0.93389 mil. EUR
Shareholders funds: 1.30417
mil. EUR
Number of employees: 7
Name: BLÜCHER GERMANY GMBH
National id number: HRB 381584
(Freiburg im Breisgau)
Address: Am Herrlebühl 17
Zipcode: 78479
City: REICHENAU
Country: DE
Type: Industrial company
Phone: +49 7531 97400
Fax: +49 7531 974031
Share direct: 100.00%
Turnover:
8.72 mil. EUR
Total assets : 1.93 mil. EUR
Profit loss before tax:
0.38422 mil. EUR
Profit loss after tax net
income: 0.26389 mil. EUR
Shareholders funds: 1.39878
mil. EUR
Name: BLÜCHER GERMANY GMBH
National id number: HRB 381592
Address: Am Herrlebühl 17
Zipcode: 78479
City: REICHENAU
Country: DE
Type: Industrial company
Share direct: 100.00%
Turnover: 7.92 mil. EUR
Total assets : 2.04 mil. EUR
Profit loss before tax:
0.20377 mil. EUR
Profit loss after tax net
income: 0.14098 mil. EUR
Shareholders funds: 1.43901
mil. EUR
Name: BLÜCHER METAL
BETEILIGUNGS GMBH
Country: DE
Type: Industrial company
Share direct: 100.00%
Name: BLÜCHER SW EDEN
AKTIEBOLAG
National id number:
556207-5464
Address: Box 965
Zipcode: 391 29
City: KALMAR
Country: SE
Type: Industrial company
Phone: +46 480 444700
W ebsite: www.blucher.se
Share direct: 100.00%
Turnover: 7.15 mil. EUR
Total assets : 3.03 mil. EUR
Profit loss before tax:
0.76528 mil. EUR
Profit loss after tax net
income: 0.59628 mil. EUR
Shareholders funds: 1.64859
mil. EUR
Number of employees: 10
Name: BLÜCHER UK LTD
Country: GB
Type: Industrial company
Share direct: 100.00%
Branches Name:
JOHANNES BLYCHER SKIBBILD METAL A/S
National id number:
49260016-1288
Address: Blüchersvej 3
Zipcode: 7480
City: VILDBJERG
Country:
DK
Bank details
Accounts
Danske
Bank
Management
Management Fullname:
Mr. John Dennis Cawte
Type: Individual
Gender: Male
date of birth: 1951/02/08
Age: 62
Country of nationality: United
Kingdom
Address: United Kingdom
Country: United Kingdom
Number of involvements: 18
Function: Chairman
Level of responsibility:
President / Chairman
Appointment date: 2008/05/30
Fullname: Mr. Jeffrey Glenn
Allan
Type: Individual
Gender: Male
Address: United States
Number of involvements: 2
Function: Member of the board
Level of responsibility:
Member
Appointment date: 2013/05/08
Fullname: Mr. Karel Jozef A.
D'hulst
Type: Individual
Gender: Male
date of birth: 1968/01/23
Age: 45
Address: Belgium
Number of involvements: 2
Function: Member of the board
Level of responsibility:
Member
Appointment date: 2013/05/08
Fullname: Mr. Per Thanning
Johansen
Type: Individual
Gender: Male
date of birth: 1964/08/18
Age: 48
Country of nationality:
Denmark
Address: Denmark
Number of involvements: 9
Function: Member of the board
Level of responsibility:
Member
Appointment date: 2011/08/16
Fullname: Mr. Per Thanning
Johansen
Type: Individual
Gender: Male
date of birth: 1964/08/18
Age: 48
Country of nationality:
Denmark
Address: Denmark
Number of involvements: 9
Function: Managing Director
Level of responsibility:
Highest executive
Appointment date: 2011/08/16
Fullname: Mr. Henning Aagaard
Rasmussen
Type: Individual
Gender: Male
Address: Denmark
Number of involvements: 2
Function: Member of the board
Level
of responsibility: Member
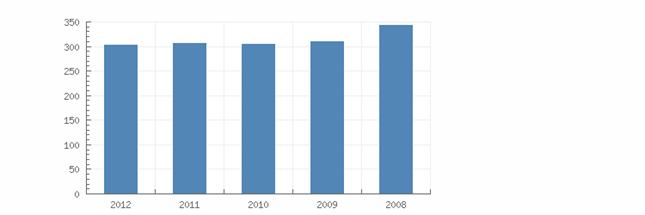
Employees
|
Year |
2012 |
2011 |
2010 |
2009 |
2008 |
|
Total |
304 |
308 |
307 |
311 |
344 |
Financial analysis
Trend Constant
Profitability More than sufficient
Solvability More than sufficient
Liquidity Positive
Show amount in Euro
Key figures
|
Year |
2012 |
2011 |
2010 |
2009 |
2008 |
|
Quick ratio |
1,85 |
1,64 |
1,53 |
1,43 |
1,06 |
|
Current ratio |
2,30 |
2,19 |
2,26 |
2,10 |
1,88 |
|
W orking capital/ balance total |
0,40 |
0,35 |
0,36 |
0,34 |
0,30 |
|
Equity / balance total |
0,40 |
0,35 |
0,36 |
0,34 |
0,30 |
|
Equity / Fixed assets |
2,20 |
1,80 |
1,74 |
1,71 |
1,51 |
|
Solvability |
2,86 |
2,81 |
2,74 |
2,41 |
2,12 |
|
W orking capital |
20.815.319 |
15.378.187 |
13.730.390 |
12.642.072 |
10.424.621 |
|
Equity |
33.972.817 |
28.339.714 |
24.531.814 |
21.494.183 |
18.079.966 |
|
Mutation equity |
19,88 |
15,52 |
14,13 |
18,88 |
|
|
Mutation short term
liabilities |
23,82 |
18,77 |
-5,52 |
-3,04 |
|
|
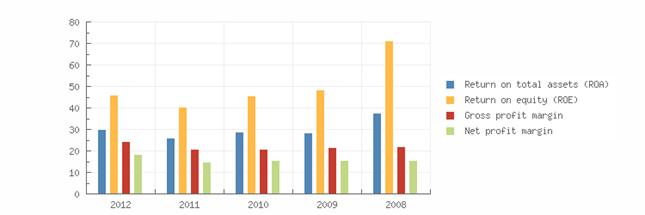
Return on total assets
(ROA) |
29,93 |
25,99 |
28,84 |
28,25 |
37,66 |
|
Return on equity
(ROE) |
46,02 |
40,37 |
45,43 |
48,26 |
71,40 |
|
Gross profit margin |
24,54 |
20,63 |
20,83 |
21,45 |
22,07 |
|
Net profit margin |
18,51 |
14,97 |
15,49 |
15,67 |
15,58 |
|
Average collection ratio |
3,93 |
4,32 |
4,89 |
4,27 |
5,20 |
|
Equity turnover ratio |
1,85 |
1,97 |
2,17 |
2,29 |
3,41 |
|
Total assets turnover ratio |
1,20 |
1,27 |
1,38 |
1,34 |
1,80 |
|
Fixed assets turnover ratio |
4,06 |
3,54 |
3,78 |
3,91 |
5,14 |
|
Inventory conversion ratio |
8,66 |
7,77 |
6,68 |
6,40 |
6,34 |
|
Turnover |
62.709.260 |
55.727.346 |
53.155.973 |
49.118.881 |
61.611.763 |
|
Gross margin |
29.298.545 |
23.999.790 |
22.449.994 |
21.096.155 |
25.054.278 |
|
Operating result |
15.387.960 |
11.496.144 |
11.074.611 |
10.533.834 |
13.595.665 |
|
Net result after taxes |
11.607.667 |
8.344.104 |
8.235.463 |
7.695.744 |
9.601.235 |
|
Cashflow |
13.043.525 |
10.034.527 |
9.885.647 |
9.336.941 |
11.308.782 |
|
EBITDA |
16.823.818 |
13.186.568 |
12.724.795 |
12.175.031 |
15.303.213 |
Summary
The 2012 financial result structure is a positive working capital
of 20.815.319 euro,
which is in agreement with 40 % of the total assets of the
company.
The working capital has increased with 35.36 % compared to
previous year. The ratio,
with respect to the total assets of the company has
however, increased.
The improvement between 2011 and 2012 has mainly been
caused by an increase of
the current assets.
The current ratio of the company in 2012 was 2.3. A
company with a current ratio
between 1.5 and 3.0 generally indicates good short-term
financial strength.
The quick ratio in 2012 of the company was 1.85. A company
with a Quick Ratio of
more than 1 can currently pay back its current liabilities.
The 2011 financial result structure is a positive working capital
of 15.378.187 euro,
which is in agreement with 35 % of the total assets of the
company.
The working capital has increase with 12 % compared to
previous year. The ratio wit h
respect to the total assets of the company has however,
declined.
The improvement between 2010 and 2011 has mainly been
caused by a current
liabilities reduction.
The current ratio of the company in 2011 was 2.19. A
company with a current ratio
between 1.5 and 3.0 generally indicates good short-term
financial strength.
The quick ratio in 2011 of the company was 1.64. A company
with a Quick Ratio of
more than 1 can currently pay
back its current liabilities.


Financial statements
Auditor Name:
KPMG Statsautoriseret Revisionspartnerselskab
Last annual account 2012
Remark annual account The
company is obliged to file its financial statements.
Type of annual account Consolidated
Annual account BLUCHER
METAL A/S
PUGDALVEJ 1
7480 VILDBJERG
Denmark
Balance sheet
|
Year |
2012 |
2011 |
2010 |
2009 |
2008 |
|
End Date |
2012-12-31 |
2011-12-31 |
2010-12-31 |
2009-12-30 |
2008-12-31 |
|
Intangible fixed
assets |
420.539 |
447.524 |
404.717 |
425.178 |
455.201 |
|
Tangible fixed
assets |
12.111.644 |
12.534.180 |
13.629.778 |
12.062.015 |
11.461.740 |
|
Other fixed assets |
2.907.877 |
2.747.829 |
26.253 |
90.680 |
79.130 |
|
Fixed assets |
15.440.059 |
15.729.534 |
14.060.747 |
12.577.874 |
11.996.071 |
|
Inventories |
7.241.031 |
7.173.842 |
7.953.880 |
7.673.943 |
9.715.579 |
|
Liquid funds |
17.185.562 |
9.672.150 |
4.050.634 |
4.737.684 |
2.273.830 |
|
Current assets |
36.788.283 |
28.277.973 |
24.591.915 |
24.138.208 |
22.280.787 |
|
Total assets |
52.228.342 |
44.007.507 |
38.652.663 |
36.716.081 |
34.276.858 |
|
Total equity |
33.972.817 |
28.339.714 |
24.531.814 |
21.494.183 |
18.079.966 |
|
Long term liabilities |
2.282.560 |
2.768.006 |
3.259.324 |
3.725.762 |
4.340.726 |
|
Accounts payable |
13.500.492 |
10.898.773 |
8.912.434 |
9.340.686 |
8.059.832 |
|
Short term liabilities |
15.972.964 |
12.899.786 |
10.861.525 |
11.496.136 |
11.856.166 |
|
Total liabilities |
52.228.342 |
44.007.507 |
38.652.663 |
36.716.081 |
34.276.858 |
Summary
The total assets of the company increased with
18.68 % between 2011 and 2012.
Despite the assets growth, the non current assets
decreased with -1.84 %.
In 2012 the assets of the company were 29.56 % composed of
fixed assets and 70.44
% by current assets. The assets are being financed by an
equity of 65.05 %, and total
debt of 34.95 %.
The total assets of the company increased with 13.85 %
between 2010 and 2011.
The fixed asset growth of 11.87 % is lower than the total
asset growth.
In 2011 the assets of the company were 35.74 % composed of
fixed assets and 64.26
% by current assets. The assets are being financed by an
equity of 64.4 %, and total
debt of 35.6 %.


![]()
![]() Profit and loss
Profit and loss
|
Year |
2012 |
2011 |
2010 |
2009 |
2008 |
|
Net turnover |
62.709.260 |
55.727.346 |
53.155.973 |
49.118.881 |
61.611.763 |
|
Cost of
sales |
33.410.715 |
31.727.556 |
30.705.979 |
28.022.726 |
36.557.486 |
|
Gross margin |
29.298.545 |
23.999.790 |
22.449.994 |
21.096.155 |
25.054.277 |
|
W ages and salaries |
17.261.902 |
16.566.742 |
15.984.518 |
15.177.093 |
17.318.443 |
|
Amorization and
depreciation |
1.435.858 |
1.690.424 |
1.650.184 |
1.641.197 |
1.707.548 |
|
Operating expenses |
13.910.584 |
12.503.646 |
11.375.383 |
10.562.322 |
11.458.613 |
|
Operating result |
15.387.960 |
11.496.144 |
11.074.611 |
10.533.834 |
13.595.665 |
|
Financial income |
414.914 |
148.233 |
279.850 |
72.223 |
158.124 |
|
Financial expenses |
168.885 |
204.729 |
208.822 |
232.317 |
845.140 |
|
Financial result |
246.028 |
-56.495 |
71.029 |
-160.094 |
-687.016 |
|
Result on ordinary operations before
taxes |
15.633.989 |
11.439.649 |
11.145.640 |
10.373.740 |
12.908.648 |
|
Taxation on the result
of ordinary activities |
4.026.322 |
3.095.545 |
2.910.177 |
2.677.996 |
3.307.414 |
|
Result of ordinary activities after taxes |
11.607.667 |
8.344.104 |
8.235.463 |
7.695.744 |
9.601.235 |
|
Net result |
11.607.667 |
8.344.104 |
8.235.463 |
7.695.744 |
9.601.235 |
Summary
The turnover of the company grew with 12.53 % between 2011
and 2012.
The gross profit of the company grew with 22.08 % between
2011 and 2012.
The operating result of the company grew with 33.85 %
between 2011 and 2012. This
evolution implies an increase of the company's economic
profitability .
The result of these changes is an increase of the
company's Economic Profitability of
15.16 % of the analysed period, being equal to 2011 % in
the year 2012.
Despite the growth the assets turnover decreased, whose
index evolved with -5.51 %
to a level of 1.2.
The Net Result of the company decreased by 39.11 % between
2011 and 2012. The
company's Financial Profitability has been negatively
affected by the financial
activities in comparison to the EBITs behaviour. The
result of these variations is a
profitability reduction of 14 % of the analysed period,
being 46.02 % in the year 2012.
The company's financial structure has slowed down its
financial profitability .
The turnover of the company grew with 4.84 % between 2010
and 2011.
The gross profit of the company grew with 6.9 % between
2010 and 2011.
The operating result of the company grew with 3.81 %
between 2010 and 2011. This
evolution implies an increase of the company's economic
profitability .
The result of these changes is a reduction of the
company's Economic Profitability of -
9.88 % of the analysed period, being equal to 2010 % in
the year 2011.
This fall has contributed to a asset turnover decrease,
whose index evolved from -7.97
to a level of 1.27.
The Net Result of the company decreased by 1.32 % between
2010 and 2011.
Publications
The company's Financial Profitability has been positively
affected by the financial
activities in comparison to the EBITs behaviour. The
result of thes e variations is a
profitability increase of -11.14 % of the analysed period,
being 40.37 % in the year
2011.
The company's financial profitability has been positively
affected by its financial
structure.

Publicatios
Remarks Status:
Active
Category: Large company
Last year: 2012
Turnover last year: 62.709.260
EUR
Result last year: 11.607.667
EUR
TOTAL assets last year: 52.228.342 EUR
Number of employees: 304
Number of shareholders: 2
Number of subsidiaries: 7
Number of branches: 1
FOREIGN EXCHANGE RATES
|
Currency |
Unit
|
Indian Rupees |
|
US Dollar |
1 |
Rs.60.34 |
|
UK Pound |
1 |
Rs.90.79 |
|
Euro |
1 |
Rs.77.81 |
INFORMATION DETAILS
|
Report Prepared
by : |
MNL |
RATING EXPLANATIONS
|
RATING |
STATUS |
PROPOSED CREDIT LINE |
|
|
>86 |
Aaa |
Possesses an extremely sound financial base with the strongest
capability for timely payment of interest and principal sums |
Unlimited |
|
71-85 |
Aa |
Possesses adequate working capital. No caution needed for credit
transaction. It has above average (strong) capability for payment of interest
and principal sums |
Large |
|
56-70 |
A |
Financial & operational base are regarded healthy. General
unfavourable factors will not cause fatal effect. Satisfactory capability for
payment of interest and principal sums |
Fairly Large |
|
41-55 |
Ba |
Overall operation is considered normal. Capable to meet normal
commitments. |
Satisfactory |
|
26-40 |
B |
Capability to overcome financial difficulties seems comparatively
below average. |
Small |
|
11-25 |
Ca |
Adverse factors are apparent. Repayment of interest and principal sums
in default or expected to be in default upon maturity |
Limited with
full security |
|
<10 |
C |
Absolute credit risk exists. Caution needed to be exercised |
Credit not
recommended |
|
---- |
NB |
New Business |
---- |
This score serves as a reference to assess SC’s credit risk
and to set the amount of credit to be extended. It is calculated from a
composite of weighted scores obtained from each of the major sections of this
report. The assessed factors and their relative weights (as indicated through
%) are as follows:
Financial
condition (40%) Ownership
background (20%) Payment
record (10%)
Credit history
(10%) Market trend
(10%) Operational
size (10%)
This report is issued at your request without any
risk and responsibility on the part of MIRA INFORM PRIVATE LIMITED (MIPL)
or its officials.