MIRA
INFORM REPORT
|
Report Date : |
09.07.2013 |
IDENTIFICATION DETAILS
|
Name : |
INDO MAROC PHOSPHORE SA |
|
|
|
|
Registered Office : |
2
Rue Al Abtal, Hay Erraha, Casablanca |
|
|
|
|
Country : |
Morocco |
|
|
|
|
Financials (as on) : |
31.12.2011 |
|
|
|
|
Date of Incorporation : |
20.11.1997 |
|
|
|
|
Com. Reg. No.: |
90425 |
|
|
|
|
Legal Form : |
Societe Anonyme |
|
|
|
|
Line of Business : |
· Manufacturer of fertilisers and nitrogen compounds · production of phosphoric acid |
|
|
|
|
No. of Employees : |
200 |
RATING & COMMENTS
|
MIRA’s Rating : |
Ba |
|
RATING |
STATUS |
PROPOSED CREDIT LINE |
|
|
41-55 |
Ba |
Overall operation is considered normal. Capable to meet normal
commitments. |
Satisfactory |
|
Status : |
Satisfactory |
|
|
|
|
Payment Behaviour : |
No Complaints |
|
|
|
|
Litigation : |
Clear |
NOTES:
Any query related to this report can be made
on e-mail: infodept@mirainform.com
while quoting report number, name and date.
ECGC Country Risk Classification List – March 31st 2013
|
Country Name |
Previous Rating (31.12.2012) |
Current Rating (31.03.2013) |
|
Morocco |
A2 |
A2 |
|
Risk Category |
ECGC
Classification |
|
Insignificant |
A1 |
|
Low |
A2 |
|
Moderate |
B1 |
|
High |
B2 |
|
Very High |
C1 |
|
Restricted |
C2 |
|
Off-credit |
D |
morocco ECONOMIC OVERVIEW
Morocco has
capitalized on its proximity to Europe and relatively low labor costs to build
a diverse, open, market-oriented economy. In the 1980s Morocco was a heavily
indebted country before pursuing austerity measures and pro-market reforms,
overseen by the IMF. Since taking the throne in 1999, King MOHAMMED VI has
presided over a stable economy marked by steady growth, low inflation, and
gradually falling unemployment, although a poor harvest and economic
difficulties in Europe contributed to an economic slowdown in 2012. Industrial
development strategies and infrastructure improvements - most visibly
illustrated by a new port and free trade zone near Tangier - are improving
Morocco's competitiveness. Morocco also seeks to expand its renewable energy
capacity with a goal of making renewable 40% of electricity output by 2020. Key
sectors of the economy include agriculture, tourism, phosphates, textiles,
apparel, and subcomponents. To boost exports, Morocco entered into a bilateral
Free Trade Agreement with the United States in 2006 and an Advanced Status
agreement with the European Union in 2008. Despite Morocco's economic progress,
the country suffers from high unemployment, poverty, and illiteracy,
particularly in rural areas. In 2011 and 2012, high prices on fuel - which is
subsidized and almost entirely imported - strained the government's budget and
widened the country's current account deficit. Key economic challenges for
Morocco include fighting corruption and reforming the education system, the
judiciary, and the government's costly subsidy program.
|
Source : CIA |
Company name
INDO MAROC PHOSPHORE SA
Rating Briefing
Payment Record: NO
COMPLAINTS
This rating is based on available data. In the event of
additional
information
a possibility for a different rating applies.
Registration Briefing
Registration
Number: 90425
Registration
Date: 20/11/1997
Legal
Form: SOCIETE
ANONYME
Latest
Financials: December
31, 2011
Financial Briefing
Nominal
Capital: 619,998,000
Moroccan Dirham
Issued
Capital: N/A
Turnover: 3,325,027,333
Moroccan Dirham
Net
Profit: 366,492,503
Moroccan Dirham
Net
Worth: 1,350,721,682
Moroccan Dirham
Company Details
Company
Name: INDO
MAROC PHOSPHORE SA
Also
trades as: IMACID
Headquarter
Address: 2
Rue Al Abtal,
Hay Erraha,
Casablanca,
Morocco
Telephone: +212523
345101
Fax: +212523
345105
Company was originally started on
20/11/1997
Registration & Legal Details
Current
Legal Form: SOCIETE
ANONYME
Registration
Address: 2
Rue Al Abtal ‑ Hay Erraha,
Casablanca
Registration
Number: 90425
Registration
Date: 20/11/1997
Year/Date
Company Established: 20/11/1997
Registration
Town: Casablanca
Capital
Currency: Moroccan
Dirham
Authorized Capital: 619,998,000
Paid Up Capital: 619,998,000
Authorized Capital Breakdown
Number of Shares: 619,998 Type of Shares: None Selected
Issued Shares: 619,998 Value per share:
MDH 1,000.00
Value
of this type: 619,998,000.00
Shareholders / Owners
Shareholders:
Name/Other Information Shares
Held % of
Voting/Non‑Voting
capital
OCP, 206,662 33.33%
(VOTING)
Morocco
CFCL, 206,662 33.33%
(VOTING)
India
TCL, 206,662 33.33%
(VOTING)
India
Other Shareholders 12
Principals
Name: Mr
Mohamed Terrab
Position
within the company: President
Country
of Birth: Morocco
Nationality: Moroccan
Can
fluently speak: Arabic,
French & English
Company Activities
NACE Codes: 2015 Manufacture
of fertilisers and nitrogen compounds
Indo Maroc Phosphore SA, also known as
IMACID, engages in the production of phosphoric acid. The company was founded in 1997 and is based in Jorf Lasfar, Morocco.
Local Reporters consider the
investigated company to be LARGE in their field of concern.
Operations
Employees Company
Employs: 200
HQ Premises Operates
from: Offices
Location: Central
Business Area
Branches Jorf
Lasfer ‑ BP 118,
El Jadida,
Morocco
Branch is: Owned
Description of branch: Factory, Warehouse
Exports
Export % and type of product: 100%
Exports To: India
Exporting Terms: special
agreements
Trading & Selling
Territory: 100%
International
Related Companies
Subsidiaries
Affiliates
Information on Related Companies is not
available/applicable
Bankers
BMCE
Bank,
Branch:
Head office
140
Avenue Hassan II,
Casablanca,
Morocco
Attijariwafa
Bank,
Branch:
Head office
2
Boulevard Moulay Youssef,
Casablanca,
Morocco
BMCI,
Branch:
Head office
26
Place Nations Unies,
Casablanca,
Morocco
Financial Information
Source: Companies
Registry
Figures
are: Official
Figures
Currency: Moroccan
Dirham
Months Sales Figures Sales Gross
Profit/Loss Net
Profit/Loss
12 31/12/2011 3,325,027,333 453,128,731 366,492,503
12 31/12/2010 2,284,073,991 225,637,116 181,858,269
12 31/12/2009 1,765,559,905 46,937,707 35,094,253
12 31/12/2008 4,008,917,479 307,516,895 250,636,974
Balance Sheet & Profit
& Loss
BALANCE SHEET
As at: 31‑Dec‑2011 31‑Dec‑2010
31‑Dec‑2009
Fixed
Assets
Land & Buildings 79,825,705 89,779,274 99,783,358
Plant & Machinery 186,547,908 221,068,127 206,831,659
Furniture & Equipment 2,048,419 2,293,185 1,872,885
Motor Vehicles 1,207,618 655,292 621,172
Misc. Fixed Assets 11,353,472 21,556,492 7,208,661
Total Fixed
Assets 280,983,122 335,352,370 316,317,735
Financial
Assets
Shares
in Related Companies
Loans
to related companies
Investments
Deposits
Misc. Financial Assets 54,728 54,728 54,728
Total Financial
Assets 54,728 54,728 54,728
Intangibles
Goodwill
Organisational
Expenses
Patents 2,539 2,227,766 7,046,528
Misc.
Intangible Assets
Total Intangible
Assets 2,539 2,227,766 7,046,528
Current
Assets
Stock 330,882,373 144,900,059 153,953,698
Stock
& Work in Progress
Trade Debtors & receivables 539,919,145 202,864,973 152,315,139
Provision
for bad debs
Other
receivables
Due
from related companies
Owed
by shareholders
Prepaid expenses 179,172,228 2,303,217 384,192,936
Cash 141,562,101 200,124,808 39,196,302
Tax recoverable 152,732,313 70,214,257 52,308,324
Marketable Securities 608,313,511 710,847,765 291,450,883
Misc. Current Assets 10,864,334 6,484,757 354,524
Total Current
Assets 1,963,446,005 1,337,739,836 1,073,771,806
Total Assets 2,244,486,394 1,675,374,700 1,397,190,797
Owner's
Equity & Liabilities
Issued and paid up capital 619,998,000 619,998,000 619,998,000
Share
premium account
Retained earnings 216,654,125 245,314,385
Net profit/Loss for the year 366,492,503 181,858,269 35,094,253
Revaluation
reserves
Legal Reserves 36,811,499 27,718,586 25,963,873
Other reserves 110,765,555 216,654,125
Net Worth 1,350,721,682 1,046,228,980 926,370,511
Deffered
Taxation
Provisions/allowances
Mortgages/Loans
Hire
purchase
Due to
group of companies
Minority
interest
Misc.
deferred liabilities
Total Long Term
Liabilities 0 0 0
Current
Liabilities
Creditors 798,742,765 557,548,893 374,971,278
Other
creditors
Accruals
Bank overdrafts/Loans 127,790 127,718 867,831
Misc.
Loans
Directors
accounts
Owing
to shareholders
Owing
to related companies
Proposed
dividend
Long
Term‑due 1 year
Hire
Purchase‑under 1 year
Taxation 44,107,160 43,012,404 1,048,189
Advance receipts 25,648,964 23,961,843 88,756,713
Misc. Current Liabilities 25,138,033 4,494,862 5,176,275
Total Current
Liabilities 893,764,712 629,145,720 470,820,286
Owner's Equity
& Liabilities 2,244,486,394 1,675,374,700 1,397,190,797
PROFIT & LOSS
Figures
are:
Fiscal Year
01/01/2011 01/01/2010
01./01/2009
-31/12/2011 31/12/2010 31/12/2009
Total Income/Turnover 3,325,027,333 2,284,073,991 1,765,559,905
Cost
of sales
Gross Profit/(Loss) 3,325,027,333 2,284,073,991 1,765,559,905
Admin/selling expenses 2,607,199,480 1,618,631,570 1,272,359,551
Services 416,032,815 401,318,445 282,703,658
Salaries
Auditors Fee 4,551,649 19,760,522 882,814
Stock Depreciation ‑130,761,782 21,311,354 321,752,587
Depreciation 64,213,707 71,995,399 178,038,536
Misc. Operating Expenses 48,593 37,200 34,847
Misc. Operating Income 13,885,724 46,336,064 357,342,304
Net Operating
Profit/(Loss) 377,628,595 197,355,565 67,130,216
Interest Receivable/Finance Income 30,145,860 20,373,948 8,863,322
Group
related income
Misc. Financial Income 75,406,810 54,741,664 40,750,405
Total Financial Income 105,552,670 75,115,612 49,613,727
Interest Payable/Finance costs 17,184 151,656 1,091,449
Misc. financial expenses 30,035,350 46,682,405 68,714,787
Total Financial Expenses 30,052,534 46,834,061 69,806,236
Profit/(Loss) before taxes 453,128,731 225,637,116 46,937,707
Income Tax 86,636,228 43,778,847 11,843,454
Other
Tax
Profit/(Loss) after taxes 366,492,503 181,858,269 35,094,253
Extraordinary
items
Exceptional
items
Misc.
Items
Net Profit/(Loss) 366,492,503 181,858,269 35,094,253
Previous
years retained earnings
Current years net income 366,492,503 181,858,269 35,094,253
Misc.
additions in current year
Current
years net loss
Dividends
in current year
Withdrawals
in current year
Misc.
deductions in current year
Retained
earnings at end of 366,492,503 181,858,269 35,094,253
financial
period
Average
employees
Directors
fee
Earnings
per share
Earnings
per share‑previous year
Auditors Comments
Date accounts obtained: 05/07/2013
Accounts obtained from: Companies
registry
Auditors Opinion: The
audited financial statement gives a true and fair view of the state
of
affairs of the subject
Financial Statements have been prepared on an on‑going
basis.
Assuming support of: shareholders
FINANCIAL RATIOS / COMPARATIVE
DATA
Actual Company Industrial
Averages Actual Company Industrial Averages
Results (2011) (2011) Results (2010) (2010)
Liquidity Ratios
Current Ratio 2.20 1.65 2.13 1.51
Acid Test Ratio 1.83 1.07 1.90 0.99
Accounts 0.24 0.40 0.24 0.67
Payable/Sales Ratio
Current
Liabilities/Net 0.66 1.75 0.60 ‑0.13
Worth
Total
Liabilities/Net 0.66 1.92 0.60 0.11
Worth
Fixed Assets/Net 20.80 49.28 32.05 ‑97.91
Worth (%)
Profitability Ratios
Gross Profit Ratio
(%) 100.00 91.71 100.00 93.35
Return on Capital 33.55 12.73 21.57 11.56
Employed (ROCE)(%)
Net Profit/Sales (%) 13.63 ‑6.83 9.88 ‑13.68
Return on Assets (%) 20.19 3.78 13.47 3.68
Efficiency Ratios
Sales/Working
Capital 3.11 127.29 3.22 13.21
Assets/Sales(%) 67.50 188.16 73.35 249.66
Shareholders 33.55 16.22 21.57 11.42
Return(%)
Average Collection 40.77 109.33 28.38 118.67
Period
Leverage Ratios
Capital Employed 2.46 4.67 2.19 4.39
Number of 387 387
Companies within the
industry (NACE C)
Statistics based on Manufacturing Manufacturing
NACE(C)
The statistical Industrial Average
results are calculated against companies within the database for the specific
country.
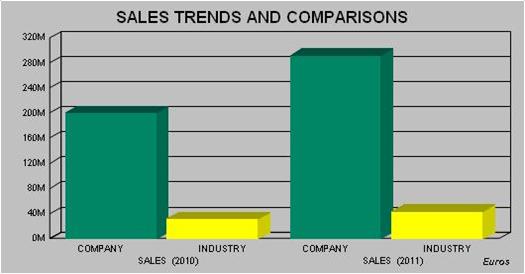
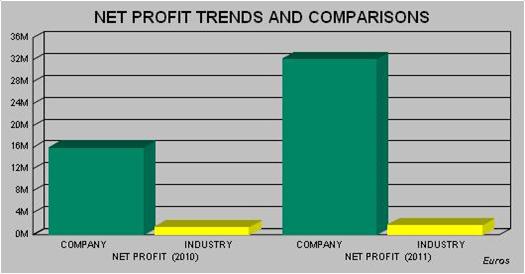
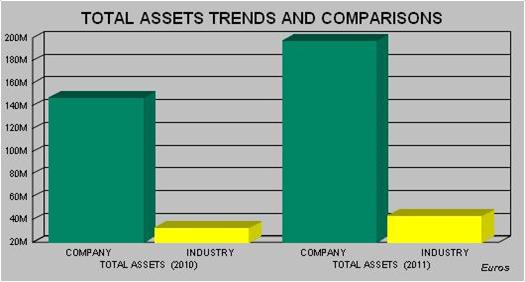
INDUSTRY SECTOR COMPARATIVE DATA
Elements
Taken Result for specific RANKING Total Companies Used
company
DATE OF REGISTRATION 20/11/1997 562 856
TOTAL EMPLOYEES 200 260 830
SALES (2011) 292,336,403 6 268
SALES (2010) 200,815,785 9 366
NET PROFIT (2011) 32,222,021 6 253
NET PROFIT (2010) 15,988,979 7 373
TOTAL ASSETS (2011) 197,335,244 11 253
TOTAL ASSETS (2010) 147,298,944 14 377
Currency: EUROS
Rankings:
The results given below are calculated
against companies with the Database for the specific country.
Scale: 1 is the highest result found in
our database.
Example: Ranking 5: Total Companies
used to generate the Ranking : 20
This means that this company is the 5th
largest company out of 20 found in our database in the specific industry
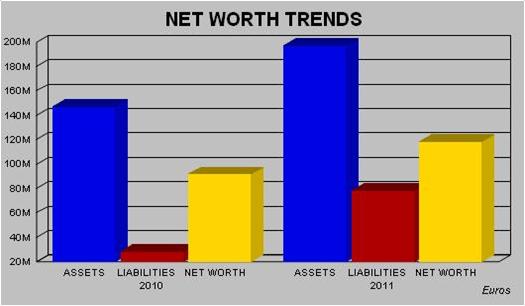
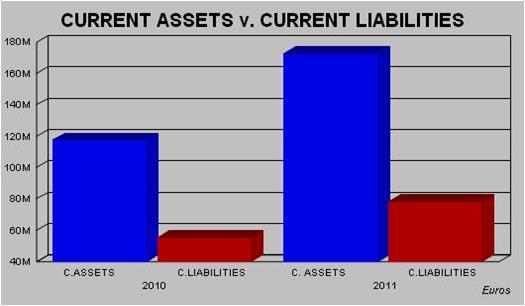
Charts of Financial
Trends and Industry Comparisons
PLEASE NOTE THAT CHARTS ARE
SHOWN IN EUROS FOR TREND AND COMPARISON PURPOSES
The statistical Industrial Average
results are calculated against companies within the database for the specific
country.
Payments
Subject's payments reported to
be: NO COMPLAINTS
Interview & Reporter Comments
Comment: We have sent a fax/e‑mail/questionnaire however no reply has been
received as of yet.
Reporter
Comment: All legal forms
in Morocco are obliged by law to be registered with the Registry
Office
(OMPIC:
Office Marocain de la Propriete Industrielle et Commerciale) which is publicly available.
Subject was found registered and Information obtained from above official source is as follows :
Registered name / registration number / date of registration / registered address / legal form / capital / main principals – administrators / shareholders / shareholders % / financial information.
According to the Morocco Commercial Law, all legal forms except for proprietorship entities are obliged to file their financial accounts to the OMPIC.
Any other data stated in the report was obtained directly from the subject company and/or other publicly available information. Therefore it should be used as a point of reference as it is not possible to verify such data with official sources.
We contacted the subject, they
asked us to send a letter for information, however, no reply was received
as of yet.
Conclusions
Local Reputation: The company being investigated is
considered by local reporters to be a Fair / Normal
Trade Risk.
General Conclusion: Local informants consider granting of
credit to be a fair trade risk.
Financial Results Trend: Financial Information indicates that the
business activities of the company are
showing an upward turn.
Age of Business: The company is long established in
the local market.
FOREIGN EXCHANGE RATES
|
Currency |
Unit
|
Indian Rupees |
|
US Dollar |
1 |
Rs.61.05 |
|
UK Pound |
1 |
Rs.90.89 |
|
Euro |
1 |
Rs.78.27 |
INFORMATION DETAILS
|
Report Prepared
by : |
MNL |
RATING EXPLANATIONS
|
RATING |
STATUS |
PROPOSED CREDIT LINE |
|
|
>86 |
Aaa |
Possesses an extremely sound financial base with the strongest
capability for timely payment of interest and principal sums |
Unlimited |
|
71-85 |
Aa |
Possesses adequate working capital. No caution needed for credit
transaction. It has above average (strong) capability for payment of interest
and principal sums |
Large |
|
56-70 |
A |
Financial & operational base are regarded healthy. General
unfavourable factors will not cause fatal effect. Satisfactory capability for
payment of interest and principal sums |
Fairly Large |
|
41-55 |
Ba |
Overall operation is considered normal. Capable to meet normal
commitments. |
Satisfactory |
|
26-40 |
B |
Capability to overcome financial difficulties seems comparatively
below average. |
Small |
|
11-25 |
Ca |
Adverse factors are apparent. Repayment of interest and principal sums
in default or expected to be in default upon maturity |
Limited with
full security |
|
<10 |
C |
Absolute credit risk exists. Caution needed to be exercised |
Credit not
recommended |
|
---- |
NB |
New Business |
---- |
This score serves as a reference to assess SC’s credit risk
and to set the amount of credit to be extended. It is calculated from a
composite of weighted scores obtained from each of the major sections of this
report. The assessed factors and their relative weights (as indicated through
%) are as follows:
Financial
condition (40%) Ownership
background (20%) Payment
record (10%)
Credit history
(10%) Market trend
(10%) Operational
size (10%)
This report is issued at your request without any
risk and responsibility on the part of MIRA INFORM PRIVATE LIMITED (MIPL)
or its officials.