MIRA
INFORM REPORT
|
Report Date : |
11.07.2013 |
IDENTIFICATION DETAILS
|
Name : |
FESIL SALES SA |
|
|
|
|
Registered Office : |
469, Rte De Thionville, 5887 Alzingen |
|
|
|
|
Country : |
Luxembourg |
|
|
|
|
Financials (as on) : |
31.12.2011 |
|
|
|
|
Date of Incorporation : |
09.03.2001 |
|
|
|
|
Com. Reg. No.: |
B 51.275 (Luxembourg) |
|
|
|
|
Legal Form : |
Limited company by shares |
|
|
|
|
Line of Business : |
Wholesaler of metals
and metal ores |
|
|
|
|
No. of Employees : |
11 |
RATING & COMMENTS
|
MIRA’s Rating : |
Ba |
|
RATING |
STATUS |
PROPOSED CREDIT LINE |
|
|
41-55 |
Ba |
Overall operation is considered normal. Capable to meet normal
commitments. |
Satisfactory |
|
Status : |
Satisfactory |
|
|
|
|
Payment Behaviour : |
Slow but Correct |
|
|
|
|
Litigation : |
Clear |
NOTES:
Any query related to this report can be made
on e-mail: infodept@mirainform.com
while quoting report number, name and date.
ECGC Country Risk Classification List – March 31st 2013
|
Country Name |
Previous Rating (31.12.2012) |
Current Rating (31.03.2013) |
|
Luxembourg |
A2 |
A2 |
|
Risk Category |
ECGC
Classification |
|
Insignificant |
A1 |
|
Low |
A2 |
|
Moderate |
B1 |
|
High |
B2 |
|
Very High |
C1 |
|
Restricted |
C2 |
|
Off-credit |
D |
Luxembourg ECONOMIC OVERVIEW
This small, stable, high-income economy - benefiting from its proximity to France, Belgium, and Germany - has historically featured solid growth, low inflation, and low unemployment. The industrial sector, initially dominated by steel, has become increasingly diversified to include chemicals, rubber, and other products. Growth in the financial sector, which now accounts for about 27% of GDP, has more than compensated for the decline in steel. Most banks are foreign-owned and have extensive foreign dealings, but Luxembourg has lost some of its advantages as a favorable tax location because of OECD and EU pressure. The economy depends on foreign and cross-border workers for about 40% of its labor force. Luxembourg, like all EU members, suffered from the global economic crisis that began in late 2008, but unemployment has trended below the EU average. Following strong expansion from 2004 to 2007, Luxembourg's economy contracted 3.6% in 2009, but rebounded in 2010-11 before slowing again in 2012. The country continues to enjoy an extraordinarily high standard of living - GDP per capita ranks among the highest in the world, and is the highest in the euro zone. Turmoil in the world financial markets and lower global demand during 2008-09 prompted the government to inject capital into the banking sector and implement stimulus measures to boost the economy. Government stimulus measures and support for the banking sector, however, led to a 5% government budget deficit in 2009. Nevertheless, the deficit was cut to 1.1% in 2011 and 0.9% in 2012. Even during the financial crisis and recovery, Luxembourg retained the highest current account surplus as a share of GDP in the euro zone, owing largely to their strength in financial services. Public debt remains among the lowest of the region although it has more than doubled since 2007 as percentage of GDP. Luxembourg's economy, while stabile, grew slowly in 2012 due to ongoing weak growth in the euro area. Authorities have strengthened supervision of domestic banks because of their exposure to the activities of foreign banks.
|
Source : CIA |
summary
Company name FESIL SALES SA
Operative address 469, RTE DE THIONVILLE
5887 ALZINGEN Luxembourg
Status Active
Legal form Limited company by shares
Registration number Trade register number: B 51.275 (Luxembourg)
Trade register number: B 51.275 (Luxembourg)
![]() Year 2011 Mutation 2010
Mutation 2009
Year 2011 Mutation 2010
Mutation 2009
Fixed assets 476.312 -10,04 529.463 -5,86 562.426
![]() Total receivables 11.112.022 -24,44 14.706.575 76,18 8.347.685
Total receivables 11.112.022 -24,44 14.706.575 76,18 8.347.685
![]() Total equity 8.429.176 -16,82 10.133.389 28,95 7.858.498
Total equity 8.429.176 -16,82 10.133.389 28,95 7.858.498
Short term liabilities 22.107.857 -40,31 37.038.893 127,07 16.311.890
![]() Net
result -1.204.213 -152,93 2.274.892 1.689,11 127.152
Net
result -1.204.213 -152,93 2.274.892 1.689,11 127.152
![]() Working capital 10.258.279 -17,16 12.383.690 28,77 9.616.824
Working capital 10.258.279 -17,16 12.383.690 28,77 9.616.824
Quick
ratio 0,58 -10,77 0,65 0,65
contact information
Company name FESIL SALES SA
Operative address 469, RTE DE THIONVILLE
5887 ALZINGEN Luxembourg
Correspondence address 469, RTE DE THIONVILLE
5887 ALZINGEN Luxembourg
Telephone number +352 2651521
Fax number +352 26510506
Registration
Registration number Trade register number: B 51.275 (Luxembourg)
Trade register number: B 51.275 (Luxembourg)
Status Active
Establishment date 2001-03-09
Legal form Limited company by shares
Subscribed share capital EUR 700.000
Activities
NACE Wholesale of metals and metal ores (4672)
Relations
Shareholders Name: KONSBRUCK, GUY
Address: Rue Lucien W ercollier 20
City: DUDELANGE Country: LU
Type: One or more named individuals or families
Share direct: 30.00%
Management
Management Fullname: Mr. Thorstein Abrahamsen
Type: Individual
Gender: Male
date of birth: 1948/06/15
Age: 65
Country of nationality: Norway
Address: 1387, Asker, Norway
Number of involvements: 6
Function: Administrative Board (AG)
Level of responsibility: Member
Fullname: Mr. Dina Elverum Aune
Type: Individual
Gender: Male
date of birth: 1964/04/30
Age: 49
Address: Elvarli, Norway
Number of involvements: 6
Function: Administrative Board (AG)
Level of responsibility: Member
Fullname: Mr. Rainer Fiehl
Type: Individual
Gender: Male
date of birth: 1966
Age: 47
Address: Brucknerstr. 10, 59348, Lüdinghausen, GERMANY
Country: GERMANY
Number of involvements: 3
Function: Administrative Board (AG)
Level of responsibility: Member
Fullname: Mr. Guy Konsbruck
Type: Individual
Gender: Male
date of birth: 1965/03/26
Age: 48
Country of nationality: Luxembourg
Address: Rue Lucien W ercollier 20, 3554, Dudelange, Luxembourg
Country: Luxembourg
Number of involvements: 6
Function: Administrative Board (AG)
Level of responsibility: Member
Fullname: PRICEW ATERHOUSECOOPERS Type: Company
Address: Rte d'Esch 400, 1471, Luxembourg, Luxembourg
Country: Luxembourg
Number of involvements: 633
Function: Member, Supervisory Board (AG)
Level of responsibility: Member
Employees
|
Year |
2011 |
2010 |
2009 |
|
Total |
11 |
12 |
10 |
Financial analysis
Trend Fluctuating
Profitability Negative
Solvability Sufficient
Liquidity Positive
![]() Show amount
in Euro
Show amount
in Euro
Key figures
|
Year |
2011 |
2010 |
2009 |
2008 |
2007 |
|
Quick ratio |
0,58 |
0,65 |
0,65 |
0,97 |
0,41 |
|
Current ratio |
1,46 |
1,33 |
1,59 |
1,73 |
1,41 |
|
W orking capital/ balance total |
0,31 |
0,25 |
0,36 |
0,42 |
0,29 |
|
Equity / balance total |
0,31 |
0,25 |
0,36 |
0,42 |
0,29 |
|
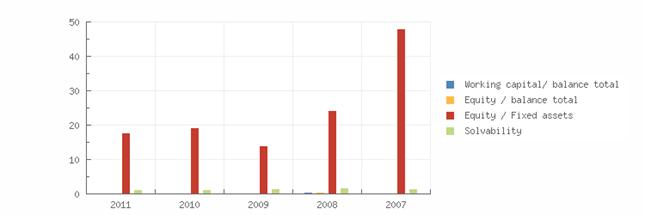
Equity / Fixed assets |
17,70 |
19,14 |
13,97 |
24,16 |
48,03 |
|
Solvability |
1,35 |
1,35 |
1,62 |
1,75 |
1,41 |
|
W orking capital |
10.258.279 |
12.383.690 |
9.616.824 |
10.765.000 |
5.060.000 |
|
Equity |
8.429.176 |
10.133.389 |
7.858.498 |
7.731.000 |
3.170.000 |
|
Mutation equity |
-16,82 |
28,95 |
1,65 |
143,88 |
|
|
Mutation short term liabilities |
-40,31 |
127,07 |
10,23 |
19,58 |
|
|
Return on total assets (ROA) |
-3,49 |
6,33 |
0,67 |
25,31 |
|
|
Return on equity (ROE) |
-13,61 |
31,19 |
2,27 |
84,74 |
|
|
Gross profit margin |
0,23 |
2,31 |
0,99 |
7,90 |
|
|
Net profit margin |
-0,89 |
1,68 |
0,16 |
4,38 |
|
|
Average collection ratio |
6,13 |
3,66 |
4,81 |
7,04 |
|
|
Average payment ratio |
12,19 |
9,21 |
9,40 |
|
|
|
Equity turnover ratio |
16,08 |
13,37 |
9,99 |
13,48 |
|
|
Total assets turnover ratio |
4,13 |
2,71 |
2,96 |
4,03 |
|
|
Fixed assets turnover ratio |
284,50 |
255,96 |
139,52 |
325,73 |
|
|
Inventory conversion ratio |
6,91 |
5,34 |
5,10 |
9,31 |
|
|
Turnover |
135.508.423 |
135.520.279 |
78.469.169 |
104.235.000 |
|
|
Operating result |
312.930 |
3.124.550 |
774.490 |
8.237.000 |
|
|
Net result after taxes |
-1.204.213 |
2.274.892 |
127.152 |
4.562.000 |
|
|
Cashflow |
-27.954 |
2.426.083 |
241.757 |
4.596.000 |
|
|
Gross profit |
5.744.726 |
11.568.511 |
3.553.882 |
|
|
|
EBITDA |
1.489.189 |
3.275.741 |
889.095 |
8.271.000 |
|
Summary
The 2011 financial result structure is a postive working captial of 10.258.279 euro, which is in agreement with 31 % of the total assets of the company.
![]() The
working capital has diminished with
-17.16 % compared to previous year.
The ratio, with respect to the
total assets of the company has
however, increased.
The
working capital has diminished with
-17.16 % compared to previous year.
The ratio, with respect to the
total assets of the company has
however, increased.
![]() The
deterioration between 2010 and 2011
has mainly been
caused by a reduction of the current
assets.
The
deterioration between 2010 and 2011
has mainly been
caused by a reduction of the current
assets.
The current ratio of the company in 2011 was 1.46. W hen the current ratio is below
1.5, the company may have problems meeting its short-term obligations.
The quick ratio in 2011 of the company was 0.58. A company with a Quick Ratio of less than 1 cannot currently pay back its current liabilities.
The 2010 financial result structure is a postive working captial of 12.383.690 euro, which is in agreement with 25 % of the total assets of the company.
The working capital has increase with 28.77 % compared to previous year. The ratio with respect to the total assets of the company has however, declined.
The improvement between 2009 and 2010 has mainly been caused by a current liabilities reduction.
The current ratio of the company in 2010 was 1.33. W hen the current ratio is below
1.5, the company may have problems meeting its short-term obligations.
The quick ratio in 2010
of the company was 0.65.
A company with a Quick Ratio of less
than 1 cannot currently
pay back its
current liabilities.
Financial statement
Last annual account 2011
Remark annual account The company is obliged to file its financial statements.
Type of annual account Corporate
Annual account FESIL SALES SA
469, RTE DE THIONVILLE
5887 ALZINGEN Luxembourg
Balance sheet
|
Year |
2011 |
2010 |
2009 |
2008 |
2007 |
|
End Date |
2011-12-31 |
2010-12-31 |
2009-12-31 |
2008-12-31 |
2007-12-31 |
|
Intangible fixed assets |
140.780 |
258.471 |
307.136 |
|
|
|
tangible fixed assets |
55.054 |
86.222 |
98.301 |
320.000 |
66.000 |
|
Other fixed assets |
280.478 |
184.770 |
156.989 |
|
|
|
Fixed assets |
476.312 |
529.463 |
562.426 |
320.000 |
66.000 |
|
Inventories |
19.620.106 |
25.393.483 |
15.381.778 |
11.198.000 |
12.420.000 |
|
Total receivables |
11.112.022 |
14.706.575 |
8.347.685 |
|
4.373.000 |
|
Liquid funds |
43.282 |
8.505.849 |
95.984 |
7.615.000 |
608.000 |
|
Other current assets |
1.590.726 |
816.676 |
2.103.268 |
5.000 |
34.000 |
|
Current assets |
32.366.136 |
49.422.583 |
25.928.714 |
25.563.000 |
17.435.000 |
|
Total assets |
32.842.448 |
49.952.046 |
26.491.140 |
25.883.000 |
17.501.000 |
|
Total equity |
8.429.176 |
10.133.389 |
7.858.498 |
7.731.000 |
3.170.000 |
|
Provisions |
|
2.779.764 |
2.320.751 |
3.354.000 |
1.956.000 |
|
Long term liabilities |
2.305.415 |
|
|
|
|
|
Accounts payable |
3.431.254 |
8.246.616 |
6.370.082 |
|
7.617.000 |
|
Liabilities towards credit
institutes |
15.524.050 |
28.628.210 |
9.699.882 |
12.317.000 |
4.191.000 |
|
Other short term
liabilities |
3.152.553 |
164.067 |
241.926 |
508.000 |
567.000 |
|
Short term liabilities |
22.107.857 |
37.038.893 |
16.311.890 |
14.798.000 |
12.375.000 |
|
Total liabilities |
32.842.448 |
49.952.046 |
26.491.140 |
25.883.000 |
17.501.000 |
![]() Summary
Summary
The total assets of the company decreased with -34.25 % between 2010 and 2011.
This total assets decrease has been reflected in a reduction of non current assets of -
10.04 %.
In 2011 the assets of the company were 1.45 % composed of fixed assets and 98.55
% by current assets. The assets are being financed by an equity of 25.67 %, and total debt of 74.33 %.
The total assets of the company increased with 88.56 % between 2009 and 2010. Despite the assets growth, the non current assets decreased with -5.86 %.
In 2010 the assets of the company were 1.06 % composed of fixed assets and 98.94 % by current assets. The assets are being financed by an equity of 20.29 %, and total debt of 79.71 %.
Profit & loss
|
Year |
2011 |
2010 |
2009 |
2008 |
|
Revenues |
139.850.017 |
125.062.382 |
74.367.214 |
101.467.000 |
|
Net turnover |
135.508.423 |
135.520.279 |
78.469.169 |
104.235.000 |
|
W ages and salaries |
1.359.963 |
1.637.445 |
1.348.669 |
1.231.000 |
|
Amorization and depreciation |
1.176.259 |
151.191 |
114.605 |
34.000 |
|
Production costs |
125.231.682 |
121.811.219 |
71.133.646 |
84.840.000 |
|
Operating result |
312.930 |
3.124.550 |
774.490 |
8.237.000 |
|
Financial income |
2.895.621 |
6.596.142 |
1.316.119 |
998.000 |
|
Financial expenses |
4.355.907 |
6.560.396 |
1.912.517 |
2.684.000 |
|
Financial result |
-1.460.285 |
35.746 |
-596.399 |
-1.686.000 |
|
Result on ordinary operations before taxes |
-1.147.355 |
3.160.296 |
178.091 |
6.551.000 |
|
Taxation on the result of ordinary
activities |
56.858 |
944.587 |
50.939 |
1.989.000 |
|
Result of ordinary
activities after taxes |
-1.204.213 |
2.215.709 |
127.152 |
4.562.000 |
|
Extraordinary income |
|
59.182 |
|
|
|
Extraordinary result
before taxation |
|
59.182 |
|
|
|
Net result |
-1.204.213 |
2.274.892 |
127.152 |
4.562.000 |
![]()
![]()
![]()
![]() Summary
Summary
The turnover of the company remained the same between 2010 and 2011.
The operating result of the company declined with -89.98 % between 2010 and 2011. This evolution implies an decrease of the company's economic profitability.
The result of these changes is a reduction of the company's Economic Profitability of -
155.13 % of the analysed period, being equal to 2010 % in the year 2011. Despite the decline the assets turnover increased by 52.4 % reaching 4.13.
The Net Result of the company increased by -152.93 % between 2010 and 2011. The company's Financial Profitability has been positively affected by the financial activities in comparison to the EBITs behaviour. The result of these variations is a profitability increase of -143.64 % of the analysed period, being -13.61 % in the year 2011.
The company's financial profitability has been positively affected by its financial structure.
The turnover of the company grew with 72.71 % between 2009 and 2010.
The operating result of the company grew with 303.43 % between 2009 and 2010. This evolution implies an increase of the company's economic profitability.
The result of these changes is an increase of the company's Economic Profitability of
844.78 % of the analysed period, being equal to 2009 % in the year 2010.
Despite the growth the assets turnover decreased, whose index evolved with -8.45 %
to a level of 2.71.
The Net Result of the company decreased by 1689.11 % between 2009 and 2010. The company's Financial Profitability has been negatively affected by the financial activities in comparison to the EBITs behaviour. The result of these variations is a profitability reduction of 1274.01 % of the analysed period, being 31.19 % in the year 2010.
The company's financial structure has slowed down its financial profitability.
Publications
Remarks Status: Active
Category: Very large company
Last year: 2011
Turnover last year: 135.508.423 EUR
Result last year: -1.204.213 EUR
TOTAL assets last year: 32.842.448 EUR Number of employees: 11
Number of shareholders: 1
Number of subsidiaries: 0
Number of branches: 0
FOREIGN EXCHANGE RATES
|
Currency |
Unit
|
Indian Rupees |
|
US Dollar |
1 |
Rs.60.13 |
|
UK Pound |
1 |
Rs.89.52 |
|
Euro |
1 |
Rs.76.89 |
INFORMATION DETAILS
|
Report Prepared
by : |
MNL |
RATING EXPLANATIONS
|
RATING |
STATUS |
PROPOSED CREDIT LINE |
|
|
>86 |
Aaa |
Possesses an extremely sound financial base with the strongest
capability for timely payment of interest and principal sums |
Unlimited |
|
71-85 |
Aa |
Possesses adequate working capital. No caution needed for credit
transaction. It has above average (strong) capability for payment of interest
and principal sums |
Large |
|
56-70 |
A |
Financial & operational base are regarded healthy. General
unfavourable factors will not cause fatal effect. Satisfactory capability for
payment of interest and principal sums |
Fairly Large |
|
41-55 |
Ba |
Overall operation is considered normal. Capable to meet normal
commitments. |
Satisfactory |
|
26-40 |
B |
Capability to overcome financial difficulties seems comparatively
below average. |
Small |
|
11-25 |
Ca |
Adverse factors are apparent. Repayment of interest and principal sums
in default or expected to be in default upon maturity |
Limited with
full security |
|
<10 |
C |
Absolute credit risk exists. Caution needed to be exercised |
Credit not
recommended |
|
---- |
NB |
New Business |
---- |
This score serves as a reference to assess SC’s credit risk
and to set the amount of credit to be extended. It is calculated from a
composite of weighted scores obtained from each of the major sections of this
report. The assessed factors and their relative weights (as indicated through
%) are as follows:
Financial
condition (40%) Ownership
background (20%) Payment
record (10%)
Credit history
(10%) Market trend
(10%) Operational
size (10%)
This report is issued at your request without any
risk and responsibility on the part of MIRA INFORM PRIVATE LIMITED (MIPL)
or its officials.