MIRA
INFORM REPORT
|
Report Date : |
12.07.2013 |
IDENTIFICATION DETAILS
|
Name : |
POMPDELUX APS |
|
|
|
|
Registered Office : |
Mogelhoj 8, 8520 Lystrup |
|
|
|
|
Country : |
Denmark |
|
|
|
|
Financials (as on) : |
30.06.2012 |
|
|
|
|
Date of Incorporation : |
20.06.2006 |
|
|
|
|
Com. Reg. No.: |
29622035 |
|
|
|
|
Legal Form : |
Private Limited Company
|
|
|
|
|
Line of Business : |
Retail sale via mail order houses or via Internet |
|
|
|
|
No. of Employees : |
42 |
RATING & COMMENTS
|
MIRA’s Rating : |
Ba |
|
RATING |
STATUS |
PROPOSED CREDIT LINE |
|
|
41-55 |
Ba |
Overall operation is considered normal. Capable to meet normal
commitments. |
Satisfactory |
|
Status : |
Satisfactory |
|
|
|
|
Payment Behaviour : |
No Complaints |
|
|
|
|
Litigation : |
Clear |
NOTES:
Any query related to this report can be made
on e-mail: infodept@mirainform.com
while quoting report number, name and date.
ECGC Country Risk Classification List – March 31st 2013
|
Country Name |
Previous Rating (31.12.2012) |
Current Rating (31.03.2013) |
|
Denmark |
A2 |
A2 |
|
Risk Category |
ECGC
Classification |
|
Insignificant |
A1 |
|
Low |
A2 |
|
Moderate |
B1 |
|
High |
B2 |
|
Very High |
C1 |
|
Restricted |
C2 |
|
Off-credit |
D |
denmark ECONOMIC OVERVIEW
This thoroughly
modern market economy features a high-tech agricultural sector,
state-of-the-art industry with world-leading firms in pharmaceuticals, maritime
shipping and renewable energy, and a high dependence on foreign trade. Denmark
is a member of the European Union (EU); Danish legislation and regulations
conform to EU standards on almost all issues. Danes enjoy a high standard of
living and the Danish economy is characterized by extensive government welfare
measures and an equitable distribution of income. Denmark is a net exporter of
food and energy and enjoys a comfortable balance of payments surplus but
depends on imports of raw materials for the manufacturing sector. Within the
EU, Denmark is among the strongest supporters of trade liberalization. After a
long consumption-driven upswing, Denmark's economy began slowing in 2007 with
the end of a housing boom. Housing prices dropped markedly in 2008-09 and,
following a short respite in 2010, has since continued to decline. The global
financial crisis has exacerbated this cyclical slowdown through increased
borrowing costs and lower export demand, consumer confidence, and investment.
The global financial crisis cut Danish real GDP in 2008-09. Denmark made a
modest recovery in 2010 with real GDP growth of 1.3%, in part because of
increased government spending; however, the country experienced a technical
recession in late 2010-early 2011. Historically low levels of unemployment rose
sharply with the recession and have remained at about 6% in 2010-12, based on
the national measure, about two-thirds average EU unemployment. An impending
decline in the ratio of workers to retirees will be a major long-term issue.
Denmark maintained a healthy budget surplus for many years up to 2008, but the
budget balance swung into deficit in 2009. In spite of the deficits, the new
coalition government delivered a modest stimulus to the economy in 2012.
Nonetheless, Denmark's fiscal position remains among the strongest in the EU
with public debt at about 45% of GDP in 2012. Despite previously meeting the
criteria to join the European Economic and Monetary Union (EMU), so far Denmark
has decided not to join, although the Danish krone remains pegged to the euro.
Denmark held the EU presidency during the first half of 2012; priorities
included promoting a responsible, dynamic, green, and safe Europe, while
working to steer Europe out of its euro zone economic crisis.
|
Source : CIA |
Summary
Company name POMPDELUX APS
Operative address MOGELHOJ 8
8520 LYSTRUP Denmark
Status Active
Legal form Private limited company - ApS
Registration number Trade register number: 29622035
Trade register number: 29622035
VAT-number DK29 62 20 35
![]() Year 2012 Mutation 2011
Mutation 2010
Year 2012 Mutation 2011
Mutation 2010
Fixed assets 1.012.190 8,01 937.153 -6,96 1.007.285
![]() Total
receivables 101.703 395,80 20.513 -96,04 517.403
Total
receivables 101.703 395,80 20.513 -96,04 517.403
![]() Total
equity 5.553.457 25,54 4.423.524 56,94 2.818.598
Total
equity 5.553.457 25,54 4.423.524 56,94 2.818.598
Short term
liabilities 3.417.957 28,35 2.662.909 73,98 1.530.595
![]() Net
result 4.604.630 32,22 3.482.617 59,18 2.187.887
Net
result 4.604.630 32,22 3.482.617 59,18 2.187.887
![]() Working
capital 4.667.186 28,92 3.620.307 85,48 1.951.874
Working
capital 4.667.186 28,92 3.620.307 85,48 1.951.874
Quick ratio 2,10 -8,70 2,30 36,90 1,68
Contact information
Company name POMPDELUX APS
Operative address MOGELHOJ 8
8520 LYSTRUP Denmark
Correspondence address MOGELHOJ 8
8520 LYSTRUP Denmark
Telephone number +45 86787871
Email address pd@pompdelux.dk
Website www.pompdelux.dk
Registration
Registration number Trade register number: 29622035
Trade register number: 29622035
VAT-number DK29 62 20 35
Status Active
Establishment date 2006-06-20
Legal form Private limited company - ApS
Subscribed share capital DKK 125.000
Activities
NACE Retail sale via mail order houses or via Internet (4791)
Relations
Name: MH HOLDING SABRO APS
National id number: 29621195
Address: Elmevej 21
Zipcode: 8240
City: RISSKOV
Country: DK
Type: Industrial company
Share direct: 50.00%
TOTAL assets : 3.74 mil. EUR
Profit loss before tax: 2.98974 mil. EUR
Profit loss after tax net income: 2.97974 mil. EUR
Shareholders funds: 3.52918 mil. EUR
Number of employees: 0
Name: PD HOLDING RYOMGÅRD APS
National id number: 29621136
Address: Merianvej 38
Zipcode: 8240
City: RISSKOV
Country: DK
Type: Industrial company
Share direct: 50.00%
TOTAL assets : 3.87 mil. EUR
Profit loss before tax: 2.96619 mil. EUR
Profit loss after tax net income: 2.96247 mil. EUR
Shareholders funds: 3.53545 mil. EUR
Number of employees: 0
Structure SUBSIDIARIES
Name: POMPDELUX FINLAND OY
Country: FI
Type: Industrial company
Status: UO
Share direct: 100.00%
Name: POMPDELUX NL B.V.
National id number: 55777384
Address: Luchthavenweg 81 .029
Zipcode: 5657 EA
City: EINDHOVEN
Country: NL
Type: Industrial company
Phone: +31 40 2350237
Status: UO
Share direct: 100.00%
Name: POMPDELUX NORGE AS
Country: NO
Type: Industrial company
Status: UO
Share direct: 100.00%
Name: POMPDELUX SVERIGE AB
National id number: 556782-8602
Address: Box 16285
Zipcode: 103 25
City: STOCKHOLM
Country: SE
Type: Industrial company
Phone: +46 8 6117103
Status: UO
Share direct: 100.00%
Turnover: 4.78 mil. EUR
Total assets : 1.13 mil. EUR
Profit loss before tax: 0.19274 mil. EUR
Profit loss after tax net income: 0.14193 mil. EUR
Shareholders funds: 0.18499 mil. EUR
Bank details
Accounts Nordea Bank Danmark A/S
Management
Management Fullname: Mrs. Pia Tangov Davids
Type: Individual
Gender: Female
date of birth: 1971/05/01
Age: 42
Address: Denmark
Number of involvements: 4
Function: General Manager
Level of responsibility: Highest executive
Appointment date: 2006/06/20
Fullname: Mrs. Marianne Hoffmann
Type: Individual
Gender: Female
POMPDELUX APS
Page: 4 / 8
date of birth: 1972/05/01
Age: 41
Address: Denmark
Number of involvements: 5
Function: General Manager
Level of responsibility: Highest executive
Appointment date: 2006/06/20
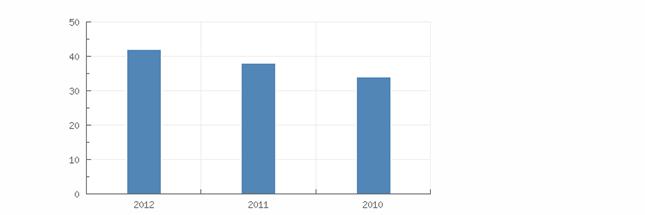
employees
|
Year |
2012 |
2011 |
2010 |
|
Total |
42 |
38 |
34 |
Financial analysis
Trend Constant
Profitability More than sufficient
Solvability More than sufficient
Liquidity Sufficient
Show amount in Euro
Key figures
|
Year |
2012 |
2011 |
2010 |
|
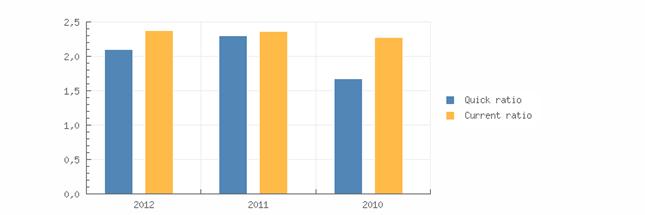
Quick ratio |
2,10 |
2,30 |
1,68 |
|
Current ratio |
2,37 |
2,36 |
2,28 |
|
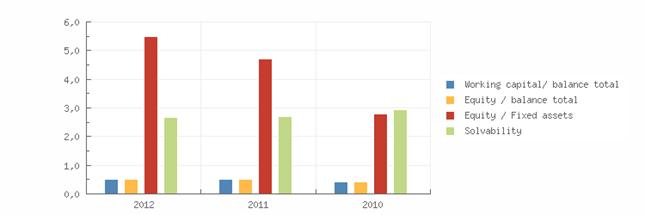
Working capital/ balance total |
0,51 |
0,50 |
0,43 |
|
Equity / balance total |
0,51 |
0,50 |
0,43 |
|
Equity / Fixed assets |
5,49 |
4,72 |
2,80 |
|
Solvability |
2,66 |
2,71 |
2,93 |
|
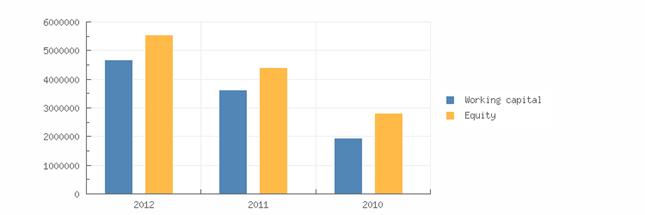
Working capital |
4.667.186 |
3.620.307 |
1.951.874 |
|
Equity |
5.553.457 |
4.423.524 |
2.818.598 |
|
Mutation equity |
25,54 |
56,94 |
|
|
Mutation short term liabilities |
28,35 |
73,98 |
|
|
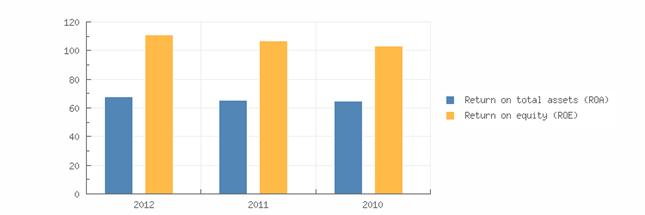
Return on total assets (ROA) |
67,81 |
65,26 |
64,97 |
|
Return on equity (ROE) |
111,09 |
106,53 |
103,49 |

![]() Gross margin 9.987.236
7.529.402 5.141.139
Gross margin 9.987.236
7.529.402 5.141.139
![]() Operating
result 6.666.005
4.846.248 2.897.941
Operating
result 6.666.005
4.846.248 2.897.941
![]()
![]() Net
result after taxes 4.604.630
3.482.617 2.187.887
Net
result after taxes 4.604.630
3.482.617 2.187.887
![]() Cashflow 5.039.425
3.819.804 2.482.300
Cashflow 5.039.425
3.819.804 2.482.300
![]() EBITDA
7.100.800
5.183.436 3.192.353
EBITDA
7.100.800
5.183.436 3.192.353
Summary
The 2012 financial result structure is a postive working captial of 4.667.186 euro, which is in agreement with 51 % of the total assets of the company.
The working capital has increased with 28.92 % compared to previous year. The ratio, with respect to the total assets of the company has however, increased.
The improvement between 2011 and 2012 has mainly been caused by an increase of the current assets.
The current ratio of the company in 2012 was 2.37. A company with a current ratio between 1.5 and 3.0 generally indicates good short-term financial strength.
The quick ratio in 2012 of the company was 2.1. A company with a Quick Ratio of more than 1 can currently pay back its current liabilities.
The 2011 financial result structure is a postive working captial of 3.620.307 euro, which is in agreement with 50 % of the total assets of the company.
The working capital has increased with 85.48 % compared to previous year. The ratio, with respect to the total assets of the company has however, increased.
The improvement between 2010 and 2011 has mainly been caused by an increase of the current assets.
The current ratio of the company in 2011 was 2.36. A company with a current ratio between 1.5 and 3.0 generally indicates good short-term financial strength.
The quick ratio in 2011 of the company was 2.3. A company with a Quick Ratio of more than 1 can currently pay back its current liabilities.
Financial statement
Auditor Name: DELOITTE Statsautoriseret Revisionspartnerselskab
Last annual account 2012
Remark annual account The company is obliged to file its financial statements.
Type of annual account Consolidated
Annual account POMPDELUX APS
MOGELHOJ 8
8520 LYSTRUP Denmark
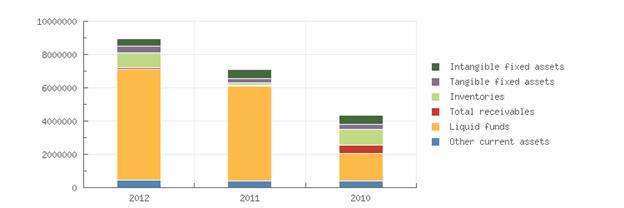
Balance sheet
|
Year |
2012 |
2011 |
2010 |
|
End date |
2012-06-30 |
2011-06-30 |
2010-06-30 |
|
Intangible fixed assets |
446.095 |
520.730 |
536.198 |
|
Tangible fixed assets |
431.835 |
282.487 |
337.104 |
|
Other fixed assets |
134.259 |
133.936 |
133.982 |
|
Fixed assets |
1.012.190 |
937.153 |
1.007.285 |
|
Inventories |
905.778 |
156.728 |
918.008 |
|
Total receivables |
101.703 |
20.513 |
517.403 |
|
Liquid funds |
6.645.960 |
5.688.614 |
1.644.842 |
|
Other current assets |
431.701 |
417.362 |
402.216 |
|
Current assets |
8.085.143 |
6.283.216 |
3.482.469 |
|
Total assets |
9.097.332 |
7.220.370 |
4.489.754 |
|
Total equity |
5.553.457 |
4.423.524 |
2.818.598 |
|
Provisions |
125.918 |
133.936 |
140.695 |
|
Accounts payable |
627.036 |
504.910 |
238.295 |
|
Short term liabilities |
3.417.957 |
2.662.909 |
1.530.595 |
|
Total liabilities |
9.097.332 |
7.220.370 |
4.489.754 |
Summary
The total assets of the company increased with 26 % between 2011 and 2012.
The fixed asset growth of 8.01 % is lower than the total asset growth.
![]() In
2012 the assets of the company were 11.13
% composed of fixed assets and 88.87
In
2012 the assets of the company were 11.13
% composed of fixed assets and 88.87
% by current assets. The assets are being financed by an equity of 61.04 %, and total debt of 38.96 %.
The total assets of the company increased with 60.82 % between 2010 and 2011. Despite the assets growth, the non current assets decreased with -6.96 %.
In 2011 the assets of the company were 12.98 % composed of fixed assets and 87.02
% by current assets. The assets are being financed by an equity of 61.26 %, and total debt of 38.74 %.
Profit & loss
|
Year |
2012 |
2011 |
2010 |
|
Gross Margin |
9.987.236 |
7.529.402 |
5.141.139 |
|
W ages and salaries |
2.886.436 |
2.345.832 |
1.948.652 |
|
Amorization and depreciation |
434.795 |
337.187 |
294.412 |
|
Operating expenses |
3.321.231 |
2.683.154 |
2.243.199 |
|
Operating result |
6.666.005 |
4.846.248 |
2.897.941 |
|
Financial income |
43.991 |
180.459 |
144.588 |
|
Financial expenses |
540.803 |
314.530 |
125.390 |
|
Financial result |
-496.813 |
-134.071 |
19.198 |
|
Result on ordinary operations before taxes |
6.169.192 |
4.712.178 |
2.917.004 |
|
Taxation on the result of ordinary activities |
1.564.563 |
1.229.561 |
729.117 |
|
Result of ordinary activities after taxes |
4.604.630 |
3.482.617 |
2.187.887 |
|
Net result |
4.604.630 |
3.482.617 |
2.187.887 |
Summary
The gross profit of the company grew with 32.64 % between 2011 and 2012.
![]() The
operating result of the company grew with 37.55 % between 2011 and 2012.
This evolution implies an
increase of the company's economic
profitability.
The
operating result of the company grew with 37.55 % between 2011 and 2012.
This evolution implies an
increase of the company's economic
profitability.
The result of these changes is an increase of the company's Economic Profitability of
3.91 % of the analysed period, being equal to 2011 % in the year 2012.
The Net Result of the company decreased by 32.22 % between 2011 and 2012. The company's Financial Profitability has been positively affected by the financial activities in comparison to the EBITs behaviour. The result of these variations is a profitability increase of 4.28 % of the analysed period, being 111.09 % in the year 2012.
The company's financial structure has slowed down its financial profitability.
The gross profit of the company grew with 46.45 % between 2010 and 2011.
The operating result of the company grew with 67.23 % between 2010 and 2011. This evolution implies an increase of the company's economic profitability.
The company's Economic Profitability did not change during the analysed period, but remained equal to 2010 % in the year 2011.
The Net Result of the
company decreased by 59.18 % between 2010 and 2011. The company's Financial Profitability has
been positively affected by the financial activities in comparison to the EBITs behaviour.
The result of these variations is a
profitability increase of 2.94 % of the
analysed period, being 106.53 % in the year 2011. The company's financial
structure has slowed down its financial profitability.

Publications
Remarks Status: Active
Category: Medium sized company
Last year: 2012
Result last year: 4.604.630 EUR
TOTAL assets last year: 9.097.332 EUR Number of employees: 42
Number of shareholders: 2
Number of subsidiaries: 4
Number of branches: 0
FOREIGN EXCHANGE RATES
|
Currency |
Unit
|
Indian Rupees |
|
US Dollar |
1 |
Rs.59.64 |
|
UK Pound |
1 |
Rs.90.14 |
|
Euro |
1 |
Rs.77.99 |
INFORMATION DETAILS
|
Report Prepared
by : |
MNL |
RATING EXPLANATIONS
|
RATING |
STATUS |
PROPOSED CREDIT LINE |
|
|
>86 |
Aaa |
Possesses an extremely sound financial base with the strongest
capability for timely payment of interest and principal sums |
Unlimited |
|
71-85 |
Aa |
Possesses adequate working capital. No caution needed for credit
transaction. It has above average (strong) capability for payment of interest
and principal sums |
Large |
|
56-70 |
A |
Financial & operational base are regarded healthy. General unfavourable
factors will not cause fatal effect. Satisfactory capability for payment of
interest and principal sums |
Fairly Large |
|
41-55 |
Ba |
Overall operation is considered normal. Capable to meet normal
commitments. |
Satisfactory |
|
26-40 |
B |
Capability to overcome financial difficulties seems comparatively
below average. |
Small |
|
11-25 |
Ca |
Adverse factors are apparent. Repayment of interest and principal sums
in default or expected to be in default upon maturity |
Limited with full
security |
|
<10 |
C |
Absolute credit risk exists. Caution needed to be exercised |
Credit not
recommended |
|
---- |
NB |
New Business |
---- |
This score serves as a reference to assess SC’s credit risk and
to set the amount of credit to be extended. It is calculated from a composite
of weighted scores obtained from each of the major sections of this report. The
assessed factors and their relative weights (as indicated through %) are as
follows:
Financial
condition (40%) Ownership
background (20%) Payment
record (10%)
Credit history
(10%) Market trend
(10%) Operational
size (10%)
This report is issued at your request without any
risk and responsibility on the part of MIRA INFORM PRIVATE LIMITED (MIPL)
or its officials.