MIRA
INFORM REPORT
|
Report Date : |
13.07.2013 |
IDENTIFICATION DETAILS
|
Name : |
HALDOR TOPSOE AS |
|
|
|
|
Registered Office : |
Nymollevej 55, 2800 Kgs.Lyngby |
|
|
|
|
Country : |
Denmark |
|
|
|
|
Financials (as on) : |
31.12.2012 |
|
|
|
|
Date of Incorporation : |
27.12.1972 |
|
|
|
|
Com. Reg. No.: |
41853816 |
|
|
|
|
Legal Form : |
Limited Company |
|
|
|
|
Line of Business : |
Engineering activities and related technical consultancy |
|
|
|
|
No. of Employees : |
2195 |
RATING & COMMENTS
|
MIRA’s Rating : |
Ba |
|
RATING |
STATUS |
PROPOSED CREDIT LINE |
|
|
41-55 |
Ba |
Overall operation is considered normal. Capable to meet normal
commitments. |
Satisfactory |
|
Status : |
Satisfactory |
|
Payment Behaviour : |
No Complaints |
|
Litigation : |
Clear |
NOTES:
Any query related to this report can be made
on e-mail: infodept@mirainform.com
while quoting report number, name and date.
ECGC Country Risk Classification List – March 31st 2013
|
Country Name |
Previous Rating (31.12.2012) |
Current Rating (31.03.2013) |
|
A2 |
A2 |
|
Risk Category |
ECGC
Classification |
|
Insignificant |
A1 |
|
Low |
A2 |
|
Moderate |
B1 |
|
High |
B2 |
|
Very High |
C1 |
|
Restricted |
C2 |
|
Off-credit |
D |
denmark ECONOMIC OVERVIEW
This thoroughly modern market economy
features a high-tech agricultural sector, state-of-the-art industry with
world-leading firms in pharmaceuticals, maritime shipping and renewable energy,
and a high dependence on foreign trade. Denmark is a member of the European
Union (EU); Danish legislation and regulations conform to EU standards on
almost all issues. Danes enjoy a high standard of living and the Danish economy
is characterized by extensive government welfare measures and an equitable
distribution of income. Denmark is a net exporter of food and energy and enjoys
a comfortable balance of payments surplus but depends on imports of raw
materials for the manufacturing sector. Within the EU, Denmark is among the
strongest supporters of trade liberalization. After a long consumption-driven
upswing, Denmark's economy began slowing in 2007 with the end of a housing
boom. Housing prices dropped markedly in 2008-09 and, following a short respite
in 2010, has since continued to decline. The global financial crisis has
exacerbated this cyclical slowdown through increased borrowing costs and lower
export demand, consumer confidence, and investment. The global financial crisis
cut Danish real GDP in 2008-09. Denmark made a modest recovery in 2010 with
real GDP growth of 1.3%, in part because of increased government spending;
however, the country experienced a technical recession in late 2010-early 2011.
Historically low levels of unemployment rose sharply with the recession and
have remained at about 6% in 2010-12, based on the national measure, about
two-thirds average EU unemployment. An impending decline in the ratio of
workers to retirees will be a major long-term issue. Denmark maintained a
healthy budget surplus for many years up to 2008, but the budget balance swung
into deficit in 2009. In spite of the deficits, the new coalition government
delivered a modest stimulus to the economy in 2012. Nonetheless, Denmark's
fiscal position remains among the strongest in the EU with public debt at about
45% of GDP in 2012. Despite previously meeting the criteria to join the
European Economic and Monetary Union (EMU), so far Denmark has decided not to
join, although the Danish krone remains pegged to the euro. Denmark held the EU
presidency during the first half of 2012; priorities included promoting a responsible,
dynamic, green, and safe Europe, while working to steer Europe out of its euro
zone economic crisis.
|
Source : CIA |
Company summary
Company name HALDOR
TOPSOE A/S
Operative address NYMOLLEVEJ 55
2800 KGS.LYNGBY
Denmark
Status Active
Specification This company can
meet all its obligations.
Legal form Limited company -
A/S
Registration number Trade register
number: 41853816
Trade register number: 41853816
VAT-number DK41 85 38 16
|
Year |
2012 |
Mutation |
2011 |
Mutation |
2010 |
|
Fixed
assets |
282.725.113f |
5,14 |
268. 891. 272 |
2,48 |
262.393.011 |
|
Total
receivables |
115.045.416 |
-13,87 |
133. 571.302 |
53,73 |
86. 886.868 |
|
|
|||||
|
Total
equity |
190.447.708 |
8,33 |
175.808.350 |
17, 37 |
149.786.564 |
|
Short
term liabilities |
344.332.670 |
2 6,66 |
322.830.942 |
28,31 |
251.598.784 |
|
|
|||||
|
Net
result |
55.580.730 |
4,08 |
53.401.618 |
30,11 |
41. 044.717 |
|
|
|||||
|
Working
capital |
109.956.095 |
7,70 |
102.095.285 |
-2,16 |
104.344.199 |
|
Quick
ratio |
0,85 |
1,19 |
0,84 |
|
0,84 |
Contact information
Company name HALDOR TOPSOE A/S
Operative address NYMOLLEVEJ 55
2800 KGS.LYNGBY
Denmark
Correspondence address NYMOLLEVEJ 55
2800 KGS.LYNGBY
Denmark
Telephone number +45 45272000
Fax number +45 45272999
Email address topsoe@topsoe.dk
Website www.topsoe.dk
Registration
Registration number Trade register
number: 41853816
Trade register
number: 41853816
VAT-number DK41 85 38 16
Status Active
Establishment date 1972-12-27
Legal form Limited company -
A/S
Subscribed share capital DKK 55.000.000
Activities
NACE Engineering activities
and related technical consultancy (7112)
Relations
Shareholders ULTIMATE GLOBAL
SHAREHOLDER
Name: HALDOR TOPSØE HOLDING A/S
National id number: 30826752
Address: Nymøllevej 55
Zipcode: 2800
City: KGS.LYNGBY
Country: DK
Phone: +45 45272000
FAX: +45 45272989
Website: www.haldor-topsoe.com
Type: Industrial company
Share direct: 100.00%
Share TOTAL: 100.00%
Turnover: 769.46 mil. EUR
TOTAL assets : 1381.23 mil. EUR
Profit loss before tax: 78.3208 mil. EUR
Profit loss after tax net income: 58.6536
mil. EUR
Shareholders funds: 591.7572 mil. EUR
SHAREHOLDERS
Name: HALDOR TOPSØE HOLDING A/S
National id number: 30826752
Address: Nymøllevej 55
Zipcode: 2800
City: KGS.LYNGBY
Country: DK
Phone: +45 45272000
FAX: +45 45272989
Website: www.haldor-topsoe.com
Type: Industrial company
Share direct: 100.00%
Turnover: 769.46 mil. EUR
TOTAL assets : 1381.23 mil. EUR
Profit loss before tax: 78.3208 mil. EUR
Profit loss after tax net income: 58.6536
mil. EUR
Shareholders funds: 591.7572 mil. EUR
Number of employees: 2091
Structure SUBSIDIARIES
Name: HALDOR TOPSOE AMERICA LATINA
National id number: Array
Address: Array
Zipcode: Array
City: Array
Country: AR
Type: Industrial company
Phone: Array
Fax: Array
Share direct: 100.00%
Name: HALDOR TOPSOE CANADA LTD
National id number: Array
Address: Array
Zipcode: Array
City: Array
Country: CA
Type: Industrial company
Phone: Array
Fax: Array
Share direct: 100.00%
Name: HALDOR TOPSOE S.A.
Country: ZA
Type: Industrial company
Share direct: 100.00%
Name: HALDOR TOPSOE SDN BHD
Country: MY
Type: Industrial company
Share direct: 100.00%
Name: HALDOR TOPSOE, INC.
Country: US
Type: Industrial company
W ebsite: www.topsoe.com
Share direct: 100.00%
Turnover: 48.3 mil. EUR
Number of employees: 175
Name: HALDOR TOPSOOE CATALISADORES E
TECNOLOGIAS DO BRASIL
Country: BR
Type: Industrial company
Share direct: 100.00%
Name: HALDOR TOPSØE (BEIJING)CO.LTD
Country: CN
Type: Industrial company
Share direct: 100.00%
Name: HALDOR TOPSØE INTERNATIONAL A/S
Country: DK
Type: Industrial company
W ebsite: www.haldortopsoe.com
Share direct: 100.00%
Turnover: 2.61 mil. EUR
Total assets : 7.19 mil. EUR
Profit loss before tax: 1.1 mil. EUR
Profit loss after tax net income: 1.0613
mil. EUR
Shareholders funds: 4.5059 mil. EUR
Name: HALDOR TOPSØE ZAO
Country: RU
Type: Industrial company
Share direct: 100.00%
Name: TOPSOE FUEL CELL A/S
Country: DK
Type: Industrial company
Website: www.topsoefuelcell.com
Share direct: 100.00%
Turnover: 0.77 mil. EUR
Total assets : 61.64 mil. EUR
Profit loss before tax: -22.3179 mil. EUR
Profit loss after tax net income: -16.7486
mil. EUR
Shareholders funds: 24.4171 mil. EUR
Number of employees: 120
Name: HALDOR TOPSOE INDIA PVT.LTD.
Country: IN
Type: Industrial company
Branches Name: HALDOR
TOPSØE A/S EKSPORT
Country: DK
Name: HALDOR TOPSØE A/S KATALYSATOR-DIVISIONEN
Country: DK
Name: HALDOR TOPSØE A/S
KATALYSATOR-DIVISIONEN
Country: DK
Bank details
Accounts Nordea Bank
Danmark A/S
Management
Management Fullname: Mr.
Haldor Frederik Aksel Topsoe
Type: Individual
Gender: Male
date of birth: 1913
Age: 100
Address: Denmark
Number of involvements: 6
Function: Chairman
Level of responsibility: President /
Chairman
Fullname: Mr. Haldor Frederik Aksel Topsoe
Type: Individual
Gender: Male
date of birth: 1913
Age: 100
Address: Denmark
Number of involvements: 6
Function: General Manager
Level of responsibility: Highest executive
Fullname: Mr. Nils Bernstein
Type: Individual
Gender: Male
Country of nationality: Denmark
Address: Denmark
Number of involvements: 3
Function: Member of the board
Level of responsibility: Member
Appointment date: 2013/03/25
Fullname: Mr. Jeppe Fonager Christiansen
Type: Individual
Gender: Male
date of birth: 1959/11/25
Age: 53
Country of nationality: Denmark
Address: Denmark
Number of involvements: 10
Function: Member of the board
Level of responsibility: Member
Appointment date: 2010/10/13
Fullname: Mr. Oluf Christian Engell
Type: Individual
Gender: Male
date of birth: 1945
Age: 68
Address: Denmark
Number of involvements: 11
Level of responsibility: Member
Fullname: Mr. Jens Kehlet Norskov
Type: Individual
Gender: Male
Country of nationality: Denmark
Address: United States
Number of involvements: 4
Function: Member of the board
Level of responsibility: Member
Appointment date: 2010/02/25
Fullname: Mr. Henrik Topsoe
Type: Individual
Gender: Male
Address: Denmark
Number of involvements: 5
Function: Member of the board
Level of responsibility: Member
Appointment date: 1994/09/14
Fullname: Mr. Jakob Haldor Topsoe
Type: Individual
Gender: Male
Country of nationality: Denmark
Address: Denmark
Number of involvements: 6
Function: Member of the board
Level of responsibility: Member
Appointment date: 2010/12/08
Fullname: Mrs. Christina Topsoe
Type: Individual
Gender: Female
Address: United Kingdom
Number of involvements: 1
Function: Member of the board
Level of responsibility: Member
Appointment date: 2013/03/25
Fullname: Mr. Petyer Ronnest Andersen
Type: Individual
Gender: Male
date of birth: 1967/09/18
Age: 45
Country of nationality: Denmark
Address: Denmark
HALDOR TOPSOE A/S
Page: 6 / 11
Number of involvements: 6
Function: General Manager
Level of responsibility: Highest executive
Appointment date: 2013/02/01
Fullname: Mr. Bjerne Steffen Clausen
Type: Individual
Gender: Male
Address: Denmark
Number of involvements: 6
Function: Managing Director
Level of responsibility: Highest executive
Appointment date: 2011/11/25
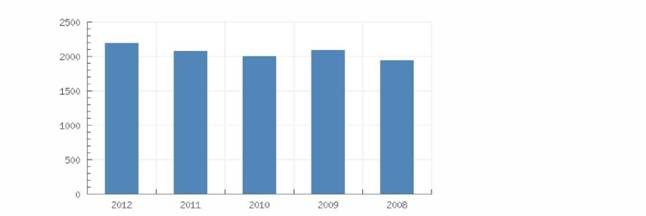
Employees
|
Year |
2012 |
2011 |
2010 |
2009 |
2008 |
|
|
Total |
2195 |
2091 |
2015 |
2106 |
1945 |
|
Financial
analysis
Trend Constant
Profitability More than sufficient
Solvability Sufficient
Liquidity Limited
Show amount in Euro
|
1 Key figures |
|||||||
|
|
|||||||
|
Year |
2012 |
2011 |
2010 |
2009 |
2008 |
||
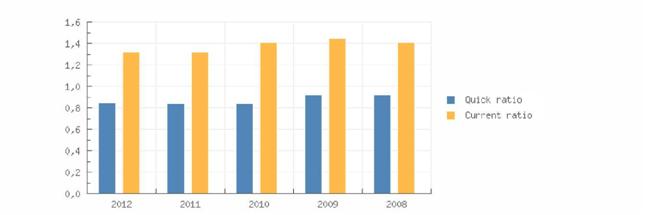
|
Quick
ratio |
0,85 |
0,84 |
0,84 |
0,92 |
0,92 |
||
|
Current
ratio |
1,32 |
1,32 |
1,41 |
1,45 |
1,41 |
||
|
Working
capital/ balance total |
0,15 |
0,15 |
0,17 |
0,19 |
0,18 |
||
|
Equity
/ balance total |
0,15 |
0,15 |
0,17 |
0,19 |
0,18 |
||
|
Equity
/ Fixed assets |
0,67 |
0,65 |
0,57 |
0,55 |
0,55 |
||
|
Solvability |
1,35 |
1,51 |
1,49 |
1,42 |
1,38 |
||
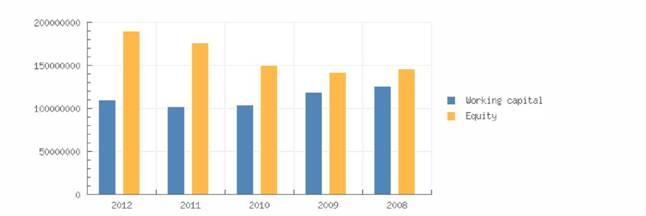
|
Working
capital |
109.956.095 |
102.095.285 |
104.344.199 |
119.435.164 |
125.786.956 |
||
|
Equity |
190.447.708 |
175.808.350 |
149.786.564 |
142.439.473 |
145.547.685 |
||
|
Mutation
equity |
8,33 |
17,37 |
5,16 |
-2,14 |
|
|
|
|
Mutation
short term liabilities |
6,66 |
28,31 |
-5,75 |
-12,81 |
|
|
|
|
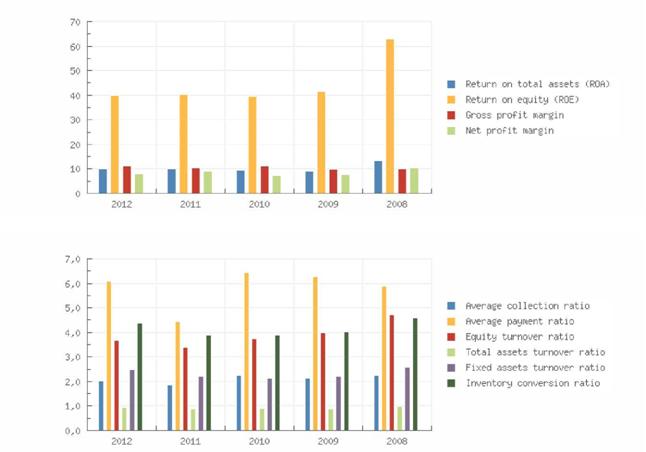
Return
on total assets (ROA) |
10,27 |
10,18 |
9,57 |
9,19 |
13,19 |
|
|
|
Return
on equity (ROE) |
39, 73 |
40, 17 |
39, 50 |
41, 60 |
63, 05 |
|
|
|
Gross
profit margin |
11,31 |
10,56 |
11,19 |
9,63 |
10, 03 |
|
|
|
Net
profit margin |
7,91 |
8,98 |
7,33 |
7,85 |
10,57 |
|
|
|
Average
collection ratio |
2,04 |
1,84 |
2,23 |
2,13 |
2,24 |
|
|
|
Average
payment ratio |
6,10 |
4,45 |
6,44 |
6,26 |
5,87 |
|
|
|
Equity
turnover ratio |
3,69 |
3,38 |
3,74 |
4,00 |
4,71 |
|
|
|
T
otal assets turnover ratio |
0,95 |
0,86 |
0,91 |
0,88 |
0,99 |
|
|
|
Fixed
assets turnover ratio |
2,48 |
2,21 |
2,13 |
2,20 |
2,60 |
|
|
|
Inventory
conversion ratio |
4,37 |
3,89 |
3,88 |
4,02 |
4,57 |
|
|
|
Turnover |
702.326.145 |
594.681.498 |
559.833.946 |
569.356.655 |
686.047.420 |
|
|
|
Gross
margin |
286.876.927 |
258.802.805 |
251.065.735 |
231.380.553 |
243.429.511 |
|
|
|
Operating
result |
79. 420. 176 |
62. 817. 521 |
62. 633. 172 |
54. 835. 854 |
68.789.882 |
|
|
|
Net
result after taxes |
55. 580. 730 |
53. 401. 618 |
41.044.717 |
44. 671. 159 |
72. 504. 910 |
|
|
|
Cashflow |
82.366.625 |
80.438.710 |
68.629.965 |
71.019.118 |
96.083.319 |
|
|
|
EBITDA |
106.206.070 |
89.854.612 |
90. 218. 420 |
81.183.812 |
92. 368. 291 |
|
|
Summary
The 2012 financial result structure is a postive working captial of
109.956.095 euro,
which is in agreement with 15 % of the total assets of the company.
The working capital has increased with 7.7 % compared to previous year.
The ratio
with respect to the total assets of the company remains unchanged.
The improvement between 2011 and 2012 has mainly been caused by an
increase of
the current assets.
The current ratio of the company in 2012 was 1.32. W hen the current
ratio is below
1.5, the company may have problems meeting its short-term obligations.
The quick ratio in 2012 of the company was 0.85. A company with a Quick
Ratio of
less than 1 cannot current ly pay back its current liabilities.
The 2011 financial result structure is a postive working captial of
102.095.285 euro,
which is in agreement with 15 % of the total assets of the company.
The working capital has diminished with -2.16 % compared to previous
year. The ratio,
with respect to the total assets of the company has however, declined.
The deterioration between 2010 and 2011 has mainly been caused by an
increase of
the current liabilities.
The current ratio of the company in 2011 was 1.32. W hen the current
ratio is below
1.5, the company may have problems meeting its short-term obligations.
The quick ratio in 2011 of the company was 0.84. A company with a Quick
Ratio of
less than 1 cannot currently pay back its current liabilities.
financial statement
Auditor Name: PRICEW
ATERHOUSECOOPERS Statsautoriseret Revisions P/S
Last annual account 2012
Remark annual account The company is
obliged to file its financial statements.
Type of annual account Consolidated
Annual account HALDOR
TOPSOE A/S
NYMOLLEVEJ 55
2800 KGS.LYNGBY
Denmark
Balance sheet
|
Year |
2012 |
2011 |
2010 |
2009 |
2008 |
|
End date |
2012-12-31 |
2011-12-31 |
2010-12-31 |
2009-12-31 |
2008-12-31 |
|
Intangible fixed assets |
7.901.839 |
6.322.106 |
6.130.055 |
5.751.077 |
5.278.184 |
|
Tangible fixed assets |
210.135.340 |
196.388.823 |
192.297.164 |
190.320.535 |
195.455.832 |
|
Other fixed assets |
64. 687. 934 |
66. 180. 343 |
63. 965. 792 |
62. 593. 121 |
63. 021. 962 |
|
Fixed assets |
282.725.113 |
268.891.272 |
262.393.011 |
258.664.733 |
263.755.978 |
|
Inventories |
160.715.365 |
152.941.159 |
144.322.819 |
141.636.997 |
150.152.857 |
|
Total receivables |
115.045.416 |
133.571.302 |
86.886.868 |
90.947.269 |
116.844.321 |
|
Liquid funds |
41.652.065 |
39. 277. 765 |
55. 170. 496 |
115.155.292 |
126.725.502 |
|
Other current
assets |
136.875.919 |
99.136.002 |
69. 562. 799 |
38.652.589 |
38.249.398 |
|
Current assets |
454.288.765 |
424.926.227 |
355.942.983 |
386.392.148 |
431.972.079 |
|
To tal assets |
737.013.878 |
693.817.499 |
618.335.994 |
645.056.882 |
695.728.057 |
|
To tal e quity |
190.447.708 |
175.808.350 |
149.786.564 |
142.439.473 |
145.547.685 |
|
Provisions |
|
57. 975. 057 |
53. 571. 351 |
48.148.554 |
44. 529. 351 |
|
Long term
liabilities |
202.233.501 |
137.203.150 |
163.379.295 |
187.511.870 |
199.465.898 |
|
Accounts payable |
72. 589. 773 |
49. 231. 719 |
35. 847. 496 |
38.385.097 |
55. 888. 303 |
|
Short term
liabilities |
344.332.670 |
322.830.942 |
251.598.784 |
266.956.984 |
306.185.123 |
|
Total liabilities |
737.013.878 |
693.817.499 |
618.335.994 |
645.056.882 |
695.728.057 |
Summary
The total assets of the company increased with 6.23 % between 2011 and
2012.
The fixed asset growth of 5.14 % is lower than the total asset growth.
In 2012 the assets of the company were 73701387800 % composed of fixed
assets
and -73701387700 % by current assets. The assets are being financed by
an equity of
73701387800 %, and total debt of -73701387700 %.
The total assets of the company increased with 12.21 % between 2010 and
2011.
The fixed asset growth of 2.48 % is lower than the total asset growth.
In 2011 the assets of the company were 69381749900 % composed of fixed
assets
and -69381749800 % by current assets. The assets are being financed by
an equity of
69381749900 %, and total debt of -69381749800 %.
|
Profit and loss |
||||||||||
|
|
||||||||||
|
Year |
2012 |
2011 |
2010 |
2009 |
2008 |
|||||
|
Net turnover |
702.326.145 |
594.681.498 |
559.833.946 |
569.356.655 |
686.047.420 |
|||||
|
|
||||||||||
|
Cost
of sales |
415.449.219 |
335.878.692 |
308.768.211 |
337.976.102 |
442.617.910 |
|||||
|
Gross
margin |
286.876.927 |
258.802.805 |
251.065.735 |
231.380.553 |
243.429.511 |
|||||
|
Wages
and salaries |
180.670.856 |
168.948.193 |
160.847.316 |
150.196.740 |
151.061.220 |
|||||
|
Amorization
and depreciation |
26.785.894 |
27. 037. 091 |
27. 585. 248 |
26. 347. 959 |
23. 578. 409 |
|||||
|
Operating
expenses |
207.456.750 |
195.985.284 |
188.432.564 |
176.544.699 |
174.639.629 |
|||||
|
Operating result |
79.420.176 |
62.817.521 |
62.633.172 |
54.835.854 |
68.789.882 |
|||||
|
Financial
income |
12.053.652 |
21.925.601 |
13.859.255 |
23.138.055 |
37.719.418 |
|||||
|
Financial
expenses |
15.803.678 |
14.123.854 |
17.324.069 |
18.724.438 |
14.738.426 |
|||||
|
Financial
result |
-3.750.025 |
7.801. 748 |
-3.464.814 |
4.413.617 |
22. 980. 992 |
|||||
|
Result on ordinary
operations before
taxes |
75.670.151 |
70.619.269 |
59.168.358 |
59.249.471 |
91.770.873 |
|||||
|
Taxation
on the result of ordinary activities |
20.089.421 |
17.217.650 |
18.123.641 |
14.578.312 |
19.265.964 |
|||||
|
Result of ordinary
activities after taxes |
55.580.730 |
53.401.618 |
41.044.717 |
44.671.159 |
72.504.910 |
|||||
|
Net results |
55.580.730 |
53.401.618 |
41.044.717 |
44.671.159 |
72.504.910 |
|||||
Summary
The turnover of the company grew with 18.1 % between 2011 and 2012.
The gross profit of the company grew with 10.85 % between 2011 and 2012.
The operating result of the company grew with 26.43 % between 2011 and
2012. This
evolution implies an increase of the company's economic profitability .
The company's Economic Profitability did not change during the analysed
period, but
remained equal to 2011 % in the year 2012.
Despite the unchanged economic profitability the assets turnover
increased by 10.47 %
reaching 0.95.
The Net Result of the company decreased by 4.08 % between 2011 and 2012.
The
company's Financial Profitability has been positively affected by the
financial activities
in comparison to the EBITs behaviour. The result of thes e variations is
a profitability
increase of -1.1 % of the analysed period, being 39.73 % in the year
2012. The
company's financial profitability has been positively affected by its
financial structure.
The turnover of the company grew with 6.22 % between 2010 and 2011.
The gross profit of the company grew with 3.08 % between 2010 and 2011.
The operating result of the company in 2010 is equal to the result in
2011. This
evolution implies an unchanged economic profitability of the company.
The result of these changes is an increase of the company's Economic
Profitability of
6.37 % of the analysed period, being equal to 2010 % in the year 2011.
Despite the growth the assets turnover decreased, whose index evolved
with -5.49 %
to a level of 0.86.
The Net Result of the company decreased by 30.11 % between 2010 and
2011. The
company's Financial Profitability has been negatively affected by the
financial activities
in comparison to the EBITs behaviour. The result of thes e variations is
a profitability
reduction of 1.7 % of the analysed period, being 40.17 % in the year
2011. The
company's financial structure has slowed down its financial
profitability.
Publications
Remarks Status: Active
Category: Very large company
Last year: 2012
Turnover last year: 702.326.145 EUR
Result last year: 55.580.730 EUR
TOTAL assets last year: 737.013.878 EUR
Number of employees: 2195
Number of shareholders: 1
Number of subsidiaries: 11
Number of
branches: 3
FOREIGN EXCHANGE RATES
|
Currency |
Unit
|
Indian Rupees |
|
US Dollar |
1 |
Rs.59.89 |
|
UK Pound |
1 |
Rs.90.88 |
|
Euro |
1 |
Rs.78.32 |
INFORMATION DETAILS
|
Report Prepared
by : |
PRL |
RATING EXPLANATIONS
|
RATING |
STATUS |
PROPOSED CREDIT LINE |
|
|
>86 |
Aaa |
Possesses an extremely sound financial base with the strongest
capability for timely payment of interest and principal sums |
Unlimited |
|
71-85 |
Aa |
Possesses adequate working capital. No caution needed for credit transaction.
It has above average (strong) capability for payment of interest and
principal sums |
Large |
|
56-70 |
A |
Financial & operational base are regarded healthy. General unfavourable
factors will not cause fatal effect. Satisfactory capability for payment of
interest and principal sums |
Fairly Large |
|
41-55 |
Ba |
Overall operation is considered normal. Capable to meet normal
commitments. |
Satisfactory |
|
26-40 |
B |
Capability to overcome financial difficulties seems comparatively
below average. |
Small |
|
11-25 |
Ca |
Adverse factors are apparent. Repayment of interest and principal sums
in default or expected to be in default upon maturity |
Limited with full
security |
|
<10 |
C |
Absolute credit risk exists. Caution needed to be exercised |
Credit not
recommended |
|
---- |
NB |
New Business |
---- |
This score serves as a reference to assess SC’s credit risk and
to set the amount of credit to be extended. It is calculated from a composite
of weighted scores obtained from each of the major sections of this report. The
assessed factors and their relative weights (as indicated through %) are as
follows:
Financial
condition (40%) Ownership
background (20%) Payment
record (10%)
Credit history
(10%) Market trend
(10%) Operational
size (10%)
This report is issued at your request without any
risk and responsibility on the part of MIRA INFORM PRIVATE LIMITED (MIPL)
or its officials.