MIRA
INFORM REPORT
|
Report Date : |
27.07.2013 |
IDENTIFICATION DETAILS
|
Name : |
KOLHIDA-SLIVEN AD |
|
|
|
|
Registered Office : |
j.k. Industrialna zona, 8800 Sliven |
|
|
|
|
Country : |
Bulgaria |
|
|
|
|
Financials (as on) : |
31.12.2011 |
|
|
|
|
Year of Establishments: |
1991 |
|
|
|
|
Legal Form : |
Joint Stock Company (AD) |
|
|
|
|
Line of Business : |
Preparation
and spinning of woollen-type fibres |
|
|
|
|
No. of Employees : |
178 |
RATING & COMMENTS
|
MIRA’s Rating : |
B |
|
|
With financials |
|
RATING |
STATUS |
PROPOSED CREDIT LINE |
|
|
26-40 |
B |
Capability to overcome financial difficulties seems comparatively
below average. |
Small |
|
Status : |
Moderate |
|
|
|
|
Payment Behaviour : |
No Complaints |
|
|
|
|
Litigation : |
Clear |
NOTES:
Any query related to this report can be made
on e-mail: infodept@mirainform.com
while quoting report number, name and date.
ECGC Country Risk Classification List – March 31st 2013
|
Country Name |
Previous Rating (31.12.2012) |
Current Rating (31.03.2013) |
|
Bulgaria |
B1 |
B1 |
|
Risk Category |
ECGC
Classification |
|
Insignificant |
A1 |
|
Low |
A2 |
|
Moderate |
B1 |
|
High |
B2 |
|
Very High |
C1 |
|
Restricted |
C2 |
|
Off-credit |
D |
bulGaria ECONOMIC OVERVIEW
Bulgaria, a
former Communist country that entered the EU on 1 January 2007, averaged more
than 6% annual growth from 2004 to 2008, driven by significant amounts of bank
lending, consumption, and foreign direct investment. Successive governments
have demonstrated a commitment to economic reforms and responsible fiscal
planning, but the global downturn sharply reduced domestic demand, exports,
capital inflows, and industrial production. GDP contracted by 5.5% in 2009,
stagnated in 2010, despite a significant recovery in exports, grew 1.7% in
2011, and 1% in 2012. Despite having a favorable investment regime, including
low, flat corporate income taxes, significant challenges remain. Corruption in
public administration, a weak judiciary, and the presence of organized crime
continue to hamper the country's investment climate and economic prospects.
|
Source : CIA |
COMPANY
DETAILS
Local name: KOLHIDA-SLIVEN AD
International name: KOLHIDA-SLIVEN AD
Registered address:
j.k. Industrialna zona
8800 Sliven
Bulgaria
Telephone: +359-44-622395, +359-44-619200
Fax: +359-44-624019
E-Mail: kolhida-sliven@mbox.contact.bg,
kolhida_bachvarov@abv.bg
ESTABLISHMENT & REGISTRATION:
Established: 1991
Registered at Sliven district court
Court number 2240/1991
Bulstat/VAT number: 829054281
LEGAL FORM:
Joint Stock Company (AD)
REGISTERED CAPITAL:
BGN 2 027 358.00
BANKERS:
Unicredit Bulbank AD
SHAREHOLDERS/MANAGEMENT
SHAREHOLDERS:
|
BIAMOND |
49,72% |
|
ID 119003011 |
|
|
MKB |
49,72% |
|
ID 123117428 |
|
|
Others |
0,56% |
|
|
|
MANAGEMENT
|
VIOLETA HRISTOVA BACHVAROVA |
|
- Representative |
|
GOSPODIN GEORGIEV GOSPODINOV |
|
- Representative |
RELATED
COMPANIES
None
BUSINESS
ACTIVITY
BUSINESS OPERATION:
NACE
1.1: 17.12 Preparation and spinning of woollen-type fibres
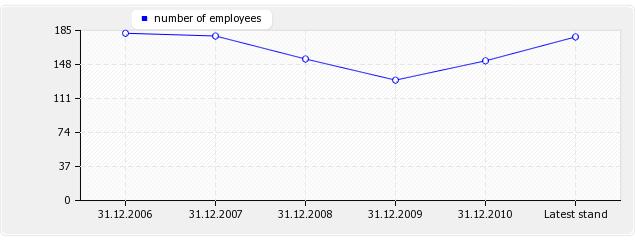
NUMBER OF EMPLOYEES:
|
As at date |
Value |
|
31.12.2006 |
182 |
|
31.12.2007 |
179 |
|
31.12.2008 |
154 |
|
31.12.2009 |
131 |
|
31.12.2010 |
152 |
|
Latest stand |
178 |
EXPORT:
Serbia,
Germany, Turkey, Syria, Poland
IMPORT:
Serbia,
Macedonia
REAL ESTATE:
Own
premises.
FINANCIAL
DATA
TURNOVER:
|
Year |
Currency |
Value |
|
2002 |
BGN |
6 321 000.00 |
|
2003 |
BGN |
11 183 000.00 |
|
2004 |
BGN |
9 239 000.00 |
|
2006 |
BGN |
9 589 000.00 |
|
2007 |
BGN |
8 411 000.00 |
|
2008 |
BGN |
7 481 000.00 |
|
2009 |
BGN |
6 291 000.00 |
|
2010 |
BGN |
10 078 000.00 |
|
2011 |
BGN |
15 396 000.00 |

MODES OF PAYMENT:
Payments
are made within agreed terms.
DEBT COLLECTION:
No debt
collection cases are registered against the company.
BANK DISTRAINTS:
No
shares of the company are under bank distraint.
UNPAID TAXES/ CONTRIBUTIONS TO GOVERNMENT:
There is
no publication about overdue unpaid taxes.
INVOLVEMENT IN LEGAL DISPUTES:
There is
no publication about legal claims or disputes against the company.
OTHER PAYMENT INFORMATION:
No
adverse payment information is available.
BRANCH INDICATOR:
The
company's payment behaviour is average for the branch.
Exchange
rate since 1998 is 1 BGN (denominated lev) = 0.51 EUR
COMMENTS
ON FINANCIAL DATA
2012
accounts are not published yet!
|
Ratio |
2010 |
2011 |
|
Debt ratio |
0.64 |
0.58 |
|
Quick ratio |
0.79 |
0.63 |
|
Current ratio |
2.23 |
2.74 |
|
Days purchase in payables |
59.28 |
36.13 |
|
Operating margin in % |
2.04 |
2.83 |
|
Cash ratio (acid ratio) |
0.02 |
0.05 |
|
Return on sales ROS in % |
1.83 |
2.54 |
|
Return on assets ROA in % |
2.23 |
4.92 |
|
Return on equity ROE in % |
6.39 |
11.95 |
|
Days supply in inventory |
85.36 |
76.24 |
|
Days sales in receivables |
45.65 |
20.97 |
|
BALANCE SHEET in BGN'000 |
2010 |
2011 |
|
Accounting period: |
1.1.2010 - |
1.1.2011 - |
|
A.UNPAID CAPITAL |
|
|
|
B. FIXED ASSETS |
|
|
|
I Fixed Intangible Assets: |
|
|
|
R&D Products |
|
2 |
|
Concessions, patents, trade-marks
etc |
|
|
|
Goodwill |
|
|
|
Intangible fixed assets under
construction |
|
|
|
thereof advances |
|
|
|
Total I: |
|
2 |
|
II Fixed Tangible Assets |
|
|
|
Land and Buildings |
1267 |
1213 |
|
thereof Land |
248 |
248 |
|
thereof Buildings |
1019 |
965 |
|
Machines, Vehicles |
1737 |
1141 |
|
Equipment |
816 |
893 |
|
Tangible fixed assets under
construction |
558 |
324 |
|
thereof advances |
|
|
|
Total II |
4378 |
3571 |
|
III. Fixed Financial Assets |
|
|
|
Shares in group companies |
|
|
|
Loans granted to group companies |
|
|
|
Shares in joint ventures |
|
|
|
Long term investments |
143 |
137 |
|
Other loans |
|
|
|
Bought back own shares |
|
|
|
Total III |
143 |
137 |
|
IV. Deferred Taxes |
|
|
|
B. FIXED ASSETS TOTAL |
4521 |
3710 |
|
C. CURRENT ASSETS |
|
|
|
I. Inventories |
|
|
|
Raw Materials |
785 |
1835 |
|
Work in progress |
555 |
943 |
|
thereof young animals |
|
|
|
Trading goods |
1046 |
476 |
|
thereof production |
1010 |
466 |
|
thereof goods for sale |
36 |
10 |
|
Advances |
|
|
|
Total I |
2386 |
3254 |
|
II. Receivables |
|
|
|
Receivables from customers |
1186 |
833 |
|
thereof more than 1 year |
|
|
|
Receivables from group companies |
|
|
|
thereof more than 1 year |
|
|
|
Receivables from joint ventures |
|
|
|
thereof more than 1 year |
|
|
|
Other receivables |
90 |
62 |
|
thereof more than 1 year |
|
|
|
Total II |
1276 |
895 |
|
III. Current Financial Assets |
|
|
|
Current investments in related
companies |
|
|
|
Bought back own shares |
|
|
|
Other current financial assets |
|
|
|
Total III |
|
|
|
IV. Cash equivalents |
|
|
|
Cash and accounts in the country |
|
|
|
thereof cash |
1 |
34 |
|
Thereof cash in foreign currency
(equivalent) |
|
|
|
thereof current accounts |
35 |
46 |
|
thereof blocked accounts |
|
|
|
thereof cash equivalents |
|
|
|
Cash and accounts abroad |
|
|
|
thereof cash |
|
|
|
Thereof cash in foreign currency
(equivalent) |
|
|
|
thereof current accounts |
|
|
|
thereof blocked accounts |
|
|
|
Total IV |
36 |
80 |
|
C. CURRENT ASSETS TOTAL |
3698 |
4229 |
|
D. Deferred expenses |
14 |
15 |
|
TOTAL ASSETS |
8233 |
7954 |
|
A. OWNERS EQUITY |
|
|
|
I. Share capital |
2027 |
2027 |
|
II. Issue premium |
1 |
1 |
|
III. Revaluation reserves |
|
|
|
thereof revaluation reserves of
financial instruments |
|
|
|
IV. Reserves |
|
|
|
legal reserves |
203 |
203 |
|
reserve related to bought back own
shares |
|
|
|
reserve from company foundation |
|
|
|
other reserves |
|
|
|
Total IV |
203 |
203 |
|
V. Result from previous period |
|
|
|
Undistributed profit |
465 |
649 |
|
Uncovered loss |
|
|
|
Total V |
465 |
649 |
|
VI. Current result profit (loss) |
184 |
391 |
|
A. OWNERS EQUITY TOTAL |
2880 |
3271 |
|
B. PROVISIONS |
|
|
|
Provisions for pensions |
|
|
|
Provisions for taxes |
37 |
23 |
|
thereof deferred taxes |
37 |
23 |
|
Other provisions |
|
|
|
B. PROVISIONS TOTAL |
37 |
23 |
|
C. LIABILITIES |
|
|
|
Bond-backed loans |
|
|
|
less than 1 year |
|
|
|
more than 1 year |
|
|
|
Bank loans |
3908 |
3745 |
|
less than 1 year |
324 |
659 |
|
more than 1 year |
3584 |
3086 |
|
Advances received |
5 |
|
|
less than 1 year |
5 |
|
|
more than 1 year |
|
|
|
Payables to suppliers |
1130 |
678 |
|
less than 1 year |
1130 |
678 |
|
more than 1 year |
|
|
|
Liabilities on policies |
|
|
|
less than 1 year |
|
|
|
more than 1 year |
|
|
|
Liabilities to group companies |
|
|
|
less than 1 year |
|
|
|
more than 1 year |
|
|
|
Liabilities to joint-venture
companies |
|
|
|
less than 1 year |
|
|
|
more than 1 year |
|
|
|
Other liabilities |
235 |
205 |
|
less than 1 year |
14 |
20 |
|
more than 1 year |
|
|
|
thereof to personnel |
121 |
119 |
|
less than 1 year |
90 |
119 |
|
more than 1 year |
|
|
|
thereof to social insurance |
37 |
8 |
|
less than 1 year |
31 |
8 |
|
more than 1 year |
|
|
|
thereof for taxes |
63 |
58 |
|
less than 1 year |
63 |
58 |
|
more than 1 year |
|
|
|
C. LIABILITIES TOTAL |
5278 |
4628 |
|
less than 1 year |
1657 |
1542 |
|
more than 1 year |
3584 |
3086 |
|
D. FINANCING AND DEFERRED INCOME |
38 |
32 |
|
thereof |
|
|
|
Financing |
38 |
32 |
|
Deferred income |
|
|
|
TOTAL EQUITY AND LIABILITIES |
8233 |
7954 |
|
P&L ACCOUNT in BGN'000 |
2010 |
2011 |
|
Accounting period: |
1.1.2010 - |
1.1.2011 - |
|
A. EXPENSES |
|
|
|
I. OPERATION EXPENSES |
|
|
|
Decrease of inventories |
673 |
154 |
|
thereof for materials |
5941 |
10435 |
|
thereof for services |
491 |
773 |
|
Personnel expenses |
1756 |
2118 |
|
thereof wages |
1599 |
1793 |
|
thereof social insurance |
157 |
184 |
|
thereof pensions |
81 |
103 |
|
Depreciation |
445 |
959 |
|
thereof Depreciation of fixed
assets |
445 |
959 |
|
Other expenses |
169 |
171 |
|
thereof Book value of sold assets
(without production) |
7 |
20 |
|
I. OPERATION EXPENSES TOTAL |
9475 |
14610 |
|
II. Financial expenditures |
|
|
|
Depreciation of financial assets |
22 |
14 |
|
thereof exchange rate losses |
22 |
14 |
|
Paid interest |
382 |
359 |
|
thereof interest to group
companies |
|
|
|
Thereof expenditures for
securities operations |
|
|
|
II. Financial expenditures Total |
404 |
373 |
|
B. Profit on ordinary activity |
205 |
435 |
|
III. Extraordinary expenses |
|
|
|
thereof expenses on disasters and
emergency expenses |
|
|
|
C. Total expenses (I+II+III) |
9879 |
14983 |
|
D. Accounting profit |
206 |
435 |
|
IV. Taxation on profit |
22 |
44 |
|
V. Other taxes |
|
|
|
E. Net profit |
184 |
391 |
|
Total expenses |
10085 |
15418 |
|
A. REVENUES |
|
|
|
I . OPERATING REVENUES |
|
|
|
Net sales |
10063 |
15366 |
|
Production |
10055 |
15313 |
|
Goods |
1 |
7 |
|
Services |
7 |
46 |
|
Increase of production and work in
progress |
|
|
|
Expenses on acquisition of assets |
|
|
|
Other revenues |
15 |
30 |
|
thereof financing |
5 |
5 |
|
I. TOTAL OPERATING REVENUES |
10078 |
15396 |
|
II FINANCIAL REVENUES |
|
|
|
Income from shares |
|
|
|
thereof income from shares in
group companies |
|
|
|
Income from investments and loans |
|
|
|
thereof from investments in group
companies |
|
|
|
Income from interest |
|
|
|
thereof from interest from group
companies |
|
|
|
II FINANCIAL REVENUES TOTAL |
6 |
22 |
|
TOTAL REVENUES FROM ORDINARY
ACTIVITIES |
10084 |
15418 |
|
LOSS |
|
|
|
Extraordinary revenues |
1 |
|
|
AFTER TAX LOSS |
|
|
|
TOTAL REVENUES |
10085 |
15418 |
FOREIGN EXCHANGE RATES
|
Currency |
Unit
|
Indian Rupees |
|
US Dollar |
1 |
Rs.58.91 |
|
UK Pound |
1 |
Rs.90.68 |
|
Euro |
1 |
Rs.78.22 |
INFORMATION DETAILS
|
Report Prepared
by : |
MNL |
RATING EXPLANATIONS
|
RATING |
STATUS |
PROPOSED CREDIT LINE |
|
|
>86 |
Aaa |
Possesses an extremely sound financial base with the strongest
capability for timely payment of interest and principal sums |
Unlimited |
|
71-85 |
Aa |
Possesses adequate working capital. No caution needed for credit
transaction. It has above average (strong) capability for payment of interest
and principal sums |
Large |
|
56-70 |
A |
Financial & operational base are regarded healthy. General
unfavourable factors will not cause fatal effect. Satisfactory capability for
payment of interest and principal sums |
Fairly Large |
|
41-55 |
Ba |
Overall operation is considered normal. Capable to meet normal
commitments. |
Satisfactory |
|
26-40 |
B |
Capability to overcome financial difficulties seems comparatively
below average. |
Small |
|
11-25 |
Ca |
Adverse factors are apparent. Repayment of interest and principal sums
in default or expected to be in default upon maturity |
Limited with
full security |
|
<10 |
C |
Absolute credit risk exists. Caution needed to be exercised |
Credit not
recommended |
|
---- |
NB |
New Business |
---- |
This score serves as a reference to assess SC’s credit risk
and to set the amount of credit to be extended. It is calculated from a
composite of weighted scores obtained from each of the major sections of this
report. The assessed factors and their relative weights (as indicated through
%) are as follows:
Financial
condition (40%) Ownership
background (20%) Payment
record (10%)
Credit history
(10%) Market trend
(10%) Operational
size (10%)
This report is issued at your request without any
risk and responsibility on the part of MIRA INFORM PRIVATE LIMITED (MIPL)
or its officials.