MIRA
INFORM REPORT
|
Report Date : |
04.06.2013 |
IDENTIFICATION DETAILS
|
Name : |
THAI CASTOR OIL INDUSTRIES CO., LTD. |
|
|
|
|
Registered Office : |
12th Floor, Orakarn Building, 26/42 Ploenchit-Chidlom Road, Lumpini, Pathumwan, Bangkok 10330 |
|
|
|
|
Country : |
Thailand |
|
|
|
|
Financials (as on) : |
31.12.2011 |
|
|
|
|
Date of Incorporation : |
02.11.1977 |
|
|
|
|
Com. Reg. No.: |
0105520015901 [Former :
1591/2520] |
|
|
|
|
Legal Form : |
Private Limited Company |
|
|
|
|
Line of Business : |
Manufacturer, Distributor and
Exporter of Castor Oil and
Derivative Products |
|
|
|
|
No. of Employees : |
200 |
RATING & COMMENTS
|
MIRA’s Rating : |
B |
|
RATING |
STATUS |
PROPOSED CREDIT LINE |
|
|
26-40 |
B |
Capability to overcome financial difficulties seems comparatively
below average. |
Small |
|
Status : |
Moderate |
|
Payment Behaviour : |
No Complaints |
|
Litigation : |
Clear |
NOTES:
Any query related to this report can be made
on e-mail: infodept@mirainform.com
while quoting report number, name and date.
ECGC Country Risk Classification List – March, 31st, 2013
|
Country Name |
Previous Rating (31.12.2012) |
Current Rating (31.03.2013) |
|
Thailand |
B1 |
B1 |
|
Risk Category |
ECGC
Classification |
|
Insignificant |
A1 |
|
Low |
A2 |
|
Moderate |
B1 |
|
High |
B2 |
|
Very High |
C1 |
|
Restricted |
C2 |
|
Off-credit |
D |
THAILAND - ECONOMIC OVERVIEW
With a well-developed infrastructure, a free-enterprise
economy, generally pro-investment policies, and strong export industries,
Thailand achieved steady growth due largely to industrial and agriculture
exports - mostly electronics, agricultural commodities, automobiles and parts,
and processed foods. Thailand is trying to maintain growth by encouraging
domestic consumption and public investment to offset weak exports in 2012.
Unemployment, at less than 1% of the labor force, stands as one of the lowest
levels in the world, which puts upward pressure on wages in some industries.
Thailand also attracts nearly 2.5 million migrant workers from neighboring
countries. The Thai government is implementing a nation-wide 300 baht ($10) per
day minimum wage policy and deploying new tax reforms designed to lower rates
on middle-income earners. The Thai economy has weathered internal and external
economic shocks in recent years. The global economic severely cut Thailand's
exports, with most sectors experiencing double-digit drops. In 2009, the
economy contracted 2.3%. However, in 2010, Thailand's economy expanded 7.8%,
its fastest pace since 1995, as exports rebounded. In late 2011 growth was
interrupted by historic flooding in the industrial areas in Bangkok and its
five surrounding provinces, crippling the manufacturing sector. Industry
recovered from the second quarter of 2012 onward with GDP growth at 5.5% in
2012. The government has approved flood mitigation projects worth $11.7
billion, which were started in 2012, to prevent similar economic damage, and an
additional $75 billion for infrastructure over the next seven years with a plan
to start in 2013.
|
Source
: CIA |
Company name
THAI CASTOR OIL INDUSTRIES CO., LTD.
SUMMARY
BUSINESS ADDRESS : 12th
FLOOR, ORAKARN BUILDING,
26/42 PLOENCHIT-CHIDLOM ROAD,
LUMPINI,
PATHUMWAN, BANGKOK
10330
TELEPHONE : [66] 2254-1490-7
FAX : [66] 2254-1499,
2253-8355
E-MAIL ADDRESS : tcogroup@thaicastoroil.com
tcogroup@samart.co.th
REGISTRATION ADDRESS : SAME AS BUSINESS
ADDRESS
ESTABLISHED : 1977
REGISTRATION NO. : 0105520015901 [Former : 1591/2520]
TAX ID NO. : 3101086126
CAPITAL REGISTERED : BHT.
80,000,000
CAPITAL PAID-UP : BHT.
80,000,000
SHAREHOLDER’S PROPORTION : THAI
: 73.50%
GERMAN :
26.50%
FISCAL YEAR CLOSING DATE : DECEMBER
31
LEGAL STATUS : PRIVATE LIMITED
COMPANY
EXECUTIVE : MR.
TAVORN TANTIPONG-ANANT, THAI
MANAGING DIRECTOR
NO. OF STAFF : 200
LINES OF BUSINESS : CASTOR OIL
AND DERIVATIVE PRODUCTS
MANUFACTURER, DISTRIBUTOR
AND EXPORTER
CORPORATE PROFILE
OPERATING TREND : STABLE
PRESENT SITUATION : OPERATING NORMALLY
REPUTATION : GOOD
WITH NORMAL BUSINESS
ENGAGEMENT
MANAGEMENT STANDARD : MANAGEMENT
WITH FAIR PERFORMANCE
HISTORY
The subject was
established on November
2, 1977 as
a private limited
company under the
name style THAI
CASTOR OIL INDUSTRIES
CO., LTD., by
Thai and German
groups, in order
to manufacture and distribute castor
oil and derivative
products for domestic
and international markets.
It currently employs
approximately 200 staff.
The subject’s registered
address is 12th Flr., Orakarn
Bldg., 26/42 Ploenchit-Chidlom Rd.,
Lumpini, Pathumwan, Bangkok 10330, and
this is the
subject’s current operation
address.
THE BOARD OF DIRECTORS
|
Name |
|
Nationality |
Age |
|
|
|
|
|
|
Mr. Phum Tantipong-anant |
[x] |
Thai |
26 |
|
Mr. Timm Wiegmann |
|
German |
57 |
|
Mr. Prasard Chirapatsakul |
[x] |
Thai |
74 |
|
Mr. Visarut Tantipong-anant |
[x] |
Thai |
32 |
|
Mr. Tavorn Tantipong-anant |
[x] |
Thai |
67 |
|
Mr. Karn Sittajarnpong |
[x] |
Thai |
64 |
|
Mr. Chinawachara
Tantipong-anant |
[x] |
Thai |
38 |
|
Mrs. Nitraporn Jubjitjaidol |
[x] |
Thai |
37 |
|
Mr. Frank Dreisorner |
|
German |
54 |
|
Mr. Sirichai Tantipong-anant |
[x] |
Thai |
49 |
|
Mr. Archawapol Jubjitjaidol |
[x] |
Thai |
37 |
AUTHORIZED PERSON
Two of the
mentioned directors [x]
can jointly sign
on behalf of
the subject with
company’s affixed.
MANAGEMENT
Mr. Tavorn Tantipong-anant is
the Managing Director.
He is Thai
nationality with the
age of 67 years
old.
Mr. Prasard Chirapatsakul is
the Plant Manager.
He is Thai
nationality with the
age of 74
years old.
Mr. Karn Sittajarnpong is
the Marketing Director.
He is Thai
nationality with the
age of 64
years old.
Mr. Aroon Methajittanon is
the Product Sales
Manager.
He is Thai
nationality.
BUSINESS OPERATIONS
The subject is
engaged in manufacturing
of castor oil: Dehydrated Castor
Oil (DCO), Dehydrated Castor Oil
Fatty Acid (DCO-FA)
and Highly Conjugated
Dehydrated Castor Oil
Fatty Acid (Hy-diene),
and its derivative
products including castor
meal and castor
seed. The products
are supplied to various
industries, e.g.
pharmaceuticals, cosmetics, lubricants,
plastics, artificial fibres,
paints, varnished and
synthetic resins, plasticizers
and surfactants, fungicides,
printing inks, soaps,
artificial leather, hydraulic
fluids, dyeing aids
and textile finishing
materials.
PRODUCTION
Castor Oil :
18,000 tons/year
Castor Meal : 20,000
tons/year
Castor Seed : 40,000
tons/year
PURCHASE
Most of raw
materials are purchased
from local suppliers
and planters, as
well as chemical
is imported from
Germany, Taiwan, India,
Republic of China,
Laos and Japan.
MAJOR SUPPLIER
Agriculture Office of
Phrae : Thailand
SALES [LOCAL]
80% of the
products is sold
locally by wholesale
to manufacturers and
end-users.
EXPORT
20% of the
products is exported
to U.S.A., Australia,
and countries in
Europe, Asia, Africa
and Middle East.
RELATED AND AFFILIATED COMPANIES
T K Wax Co.,
Ltd.
Business Type : Manufacturer
of castor wax
T J Pac Co.,
Ltd.
Business Type : Manufacturer
of special wax
for solidifying used
vegetable oil
T S Chemical Co.,
Ltd.
Business Type : Manufacturer
of castor oil
Collodium Co., Ltd.
Business Type : Manufacturer
of paper sizing
agent
LITIGATION
Bankruptcy and Receivership
There are no
litigation on bankruptcy
and receivership cases
filed against the
subject found at
Legal Execution Department
for the past
five years.
Others
There are no
legal suits filed
against the subject
for the past
two years.
CREDIT
Sales are by
cash or on
the credits term
of 30-60 days.
Local bills are
paid by cash
or on the
credits term of 30-60 days.
Imports are by
L/C at sight
or T/T.
Exports are against
T/T.
BANKING
Bangkok Bank Public
Co., Ltd.
Kasikornbank Public Co.,
Ltd.
EMPLOYMENT
The subject employs
approximately 200 staff.
LOCATION DETAILS
The premise is
rented for administrative office
at the heading
address. Premise is
located in a
prime commercial area.
Factory is located
at 23/2 Moo 7,
Petchahueng Rd., T. Banyor, A.
Phrapradaeng, Samutprakarn 10130
on 16,000 Sq. M.
of area.
Tel. : [66] 2461-0129, Fax. :
[66] 2815-0699
Warehouse / Research & Development
Center:
52/2 Moo 2, T.
Wangmuang, A. Wangmuang, Saraburi
18220.
75/2 Moo 3, T.
Salaengphan, A. Wangmuang, Saraburi
18220.
49/8 Moo 7, T.
Borhaew, A. Muang, Lampang
52000.
NOTE
Refer to your
given name TAHI
CASTER OIL INDUSTRIES
CO., LTD., please
be informed that,
the correct name
is THAI CASTER
OIL INDUSTRIES CO.,
LTD.
COMMENT
The subject is
the leading of
castor oil manufacturer. Castor
oil has been
used in many
industries. Market demand of
castor oil is promising with
strong consumption from
industrial sector.
Industrial expansion had
significantly improved its
business performance in the year 2012,
while demand of
castor oil this
year is also
looked on the
rise from various
industries.
FINANCIAL INFORMATION
The capital was
registered at Bht. 30,000,000 divided
into 300,000 shares of Bht.
100 each.
The capital was
increased later as
following:
Bht. 40,000,000
on August 31,
1979
Bht. 55,000,000
on December 30,
1986
Bht. 70,000,000
on December 29,
1997
Bht. 80,000,000
on September 10, 2001
The latest registered
capital was increased
to Bht. 80,000,000 divided
into 800,000 shares
of Bht. 100
each with fully
paid.
MAIN SHAREHOLDERS
[as at March
28, 2011]
|
NAME |
HOLDING |
% |
|
|
|
|
|
Alberdingk Boley GmbH Nationality: German Address : 4150 Krefeld-Uerding Duesseldorfer Str. 51, Germany |
196,000 |
24.50 |
|
Mr. Tavorn Tantipong-anant Nationality: Thai Address : 327
Soi Rimklongmorn, Wat
Thaphra,
Bangkokyai, Bangkok |
189,536 |
23.69 |
|
Mrs. Chintana Masakee Nationality: Thai Address : 97
Mahokkanee Room 29 A,
Sukhumvit 24 Rd.,
Klongtoey, Bangkok |
105,707 |
13.21 |
|
Mr. Visarut Tantipong-anant Nationality: Thai Address : 327
Soi Rimklongmorn, Wat
Thaphra,
Bangkokyai, Bangkok |
50,000 |
6.25 |
|
Mr. Phum Tantipong-anant Nationality: Thai Address : 327
Soi Rimklongmorn, Wat
Thaphra,
Bangkokyai, Bangkok |
50,000 |
6.25 |
|
Mrs. Nitraporn Jubjitjaidol Nationality: Thai Address : 327
Soi Rimklongmorn, Wat
Thaphra,
Bangkokyai, Bangkok |
50,000 |
6.25 |
|
Widhayakom Co., Ltd. Nationality: Thai Address : 66
Sukhumvit 21 Rd.,
Klongtoey, Bangkok |
20,000 |
2.50 |
|
Mr. Chinawachara
Tantipong-anant Nationality: Thai Address : 97
Mahokkanee Room 29 A,
Sukhumvit 24 Rd.,
Klongtoey, Bangkok |
17,625 |
2.20 |
|
Dr. Hermann Janson Nationality: German Address : 4150 Krefeld-Uerding Duesseldorfer Str. 51, Germany |
16,000 |
2.00 |
|
Mr. Kulawat Tantipong-anant Nationality: Thai Address : 97
Mahokkanee Room 29 A,
Sukhumvit 24 Rd.,
Klongtoey, Bangkok |
12,625 |
1.58 |
|
Mr. Nopadol Tantipong-anant Nationality: Thai Address : 97
Mahokkanee Room 29 A,
Sukhumvit 24 Rd.,
Klongtoey, Bangkok |
12,625 |
1.58 |
|
|
|
|
|
Mr. Sirichai Tantipong-anant Nationality: Thai Address : 97
Mahokkanee Room 29 A,
Sukhumvit 24
Rd., Klongtoey, Bangkok |
12,625 |
1.58 |
|
Other Shareholders |
67,257 |
8.41 |
Total Shareholders : 42
Share
Structure [as at
March 28, 2011]
|
Nationality |
Shareholders |
No. of Share |
% Shares |
|
|
|
|
|
|
Thai |
40 |
588,000 |
73.50 |
|
Foreign-German |
2 |
212,000 |
26.50 |
|
Total |
42 |
800,000 |
100.00 |
NAME OF AUDITOR & CERTIFIED
PUBLIC ACCOUNTANT NO.
Mr. Ampol Chamnongwat No.
4663
Note:
The 2012 financial
statement was not
available during investigation.
BALANCE
SHEET [BAHT]
The latest financial
figures published for
December 31, 2011,
2010 & 2009 were:
ASSETS
|
Current Assets |
2011 |
2010 |
2009 |
|
|
|
|
|
|
Cash and Cash Equivalents |
292,883.15 |
1,229,794.49 |
952,024.78 |
|
Trade Accounts &
Notes Receivable |
26,107,389.26 |
20,960,016.03 |
17,728,582.60 |
|
Short-term Lending to
Subsidiaries |
42,924,000.00 |
69,329,000.00 |
93,290,000.00 |
|
Inventories |
140,472,543.88 |
36,253,992.31 |
67,396,120.73 |
|
Other Current Assets
|
2,322,910.68 |
4,276,181.68 |
5,549,643.84 |
|
Total Current Assets
|
212,119,726.97 |
132,048,984.51 |
184,916,371.95 |
|
Investment in Subsidiaries & Associated Company |
250,174,632.00 |
248,182,512.00 |
216,734,312.00 |
|
General Investment |
5,049,505.33 |
5,049,505.33 |
5,049,505.33 |
|
Fixed Assets |
170,223,369.79 |
158,996,704.21 |
92,478,745.16 |
|
Other Non current
Assets |
1,721,084.00 |
934,561.50 |
63,600.00 |
|
Total Assets |
639,288,318.09 |
545,212,267.55 |
499,242,534.44 |
LIABILITIES &
SHAREHOLDERS' EQUITY [BAHT]
|
Current
Liabilities |
2011 |
2010 |
2009 |
|
|
|
|
|
|
Bank Overdraft |
1,203,466.38 |
2,362,376.76 |
546,482.71 |
|
Trust Receipt Payable
|
437,137,041.71 |
243,869,507.19 |
211,648,178.67 |
|
Short-term Loans from Financial Institution |
- |
100,000,000.00 |
120,000,000.00 |
|
Current Portion of Financial Lease Contract Liabilities |
1,343,207.47 |
- |
- |
|
Trade Accounts Payable |
6,281,147.30 |
15,101,306.56 |
25,102,948.26 |
|
Other Current Liabilities |
12,253,464.49 |
20,330,091.57 |
12,733,723.37 |
|
Total Current Liabilities |
458,218,327.35 |
381,663,282.08 |
370,031,333.01 |
|
Financial Lease Contract
Liabilities, Net |
2,985,724.09 |
- |
- |
|
Estimated Liabilities for Employee Benefit |
1,549,271.95 |
- |
- |
|
Other Non current
Liabilities |
1,003,947.00 |
726,307.00 |
694,607.00 |
|
Total Liabilities |
463,757,270.39 |
382,389,589.08 |
370,725,940.01 |
|
|
|
|
|
|
Shareholders' Equity |
|
|
|
|
|
|
|
|
|
Share capital : Baht 100
par value authorized, issued
and fully paid share
capital 800,000 shares |
80,000,000.00 |
80,000,000.00 |
80,000,000.00 |
|
Capital Paid |
80,000,000.00 |
80,000,000.00 |
80,000,000.00 |
|
Statutory Reserve |
8,000,000.00 |
8,000,000.00 |
8,000,000.00 |
|
Retained Earning -
Unappropriated |
87,531,047.70 |
74,822,678.47 |
40,516,594.43 |
|
Total Shareholders' Equity |
175,531,047.70 |
162,822,678.47 |
128,516,594.43 |
|
Total Liabilities &
Shareholders' Equity |
639,288,318.09 |
545,212,267.55 |
499,242,534.44 |
PROFIT & LOSS ACCOUNT
|
Revenue |
2011 |
2010 |
2009 |
|
|
|
|
|
|
Sales & Services |
1,386,213,642.62 |
895,695,202.94 |
541,666,712.72 |
|
Rental Income |
3,981,634.04 |
3,844,115.76 |
- |
|
Other Income |
11,623,931.12 |
11,322,944.59 |
12,611,624.60 |
|
Total Revenues |
1,401,819,207.78 |
910,862,263.29 |
554,278,337.32 |
|
Expenses |
|
|
|
|
|
|
|
|
|
Cost of Goods
Sold |
1,315,667,236.96 |
801,406,999.68 |
478,134,172.01 |
|
Cost of Rental |
2,370,975.65 |
2,570,573.70 |
- |
|
Selling Expenses |
13,062,726.57 |
11,106,317.53 |
9,424,611.94 |
|
Administrative Expenses |
22,483,193.16 |
20,981,382.96 |
18,369,031.12 |
|
Total Expenses |
1,353,584,132.34 |
836,065,273.87 |
505,927,815.07 |
|
Profit / [Loss] before Financial
Cost & Income Tax |
48,235,075.44 |
74,796,989.42 |
48,350,522.25 |
|
Cost of Financial |
[19,691,968.63] |
[19,968,620.34] |
[19,392,149.50] |
|
Profit / [Loss] before Income Tax |
28,543,106.81 |
54,828,369.08 |
28,958,372.75 |
|
Income Tax |
[9,434,737.58] |
[16,522,285.04] |
[8,727,266.21] |
|
Net Profit / [Loss] |
19,108,369.23 |
38,306,084.04 |
20,231,106.54 |
FINANCIAL ANALYSIS
|
ITEM |
UNIT |
2011 |
2010 |
2009 |
|
|
|
|
|
|
|
LIQUIDITY RATIO |
|
|
|
|
|
CURRENT RATIO |
TIMES |
0.46 |
0.35 |
0.50 |
|
QUICK RATIO |
TIMES |
0.15 |
0.24 |
0.30 |
|
|
|
|
|
|
|
ACTIVITY RATIO |
|
|
|
|
|
FIXED ASSETS TURNOVER |
TIMES |
8.17 |
5.66 |
5.86 |
|
TOTAL ASSETS TURNOVER |
TIMES |
2.17 |
1.65 |
1.08 |
|
INVENTORY CONVERSION PERIOD |
DAYS |
38.97 |
16.51 |
51.45 |
|
INVENTORY TURNOVER |
TIMES |
9.37 |
22.11 |
7.09 |
|
RECEIVABLES CONVERSION PERIOD |
DAYS |
6.85 |
8.50 |
11.95 |
|
RECEIVABLES TURNOVER |
TIMES |
53.25 |
42.92 |
30.55 |
|
PAYABLES CONVERSION PERIOD |
DAYS |
1.74 |
6.88 |
19.16 |
|
CASH CONVERSION CYCLE |
DAYS |
44.08 |
18.14 |
44.23 |
|
|
|
|
|
|
|
PROFITABILITY RATIO |
|
|
|
|
|
COST OF GOODS SOLD |
% |
94.64 |
89.09 |
88.27 |
|
SELLING & ADMINISTRATION |
% |
2.56 |
3.57 |
5.13 |
|
INTEREST |
% |
1.42 |
2.22 |
3.58 |
|
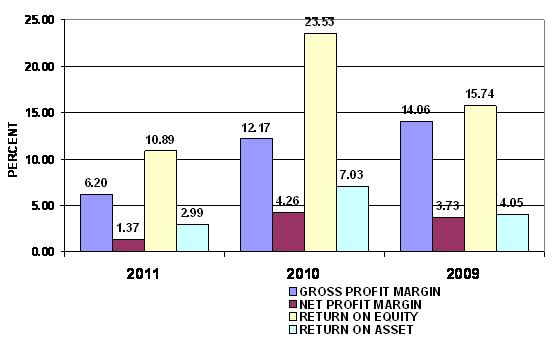
GROSS PROFIT MARGIN |
% |
6.20 |
12.17 |
14.06 |
|
NET PROFIT MARGIN BEFORE EX. ITEM |
% |
3.47 |
8.32 |
8.93 |
|
NET PROFIT MARGIN |
% |
1.37 |
4.26 |
3.73 |
|
RETURN ON EQUITY |
% |
10.89 |
23.53 |
15.74 |
|
RETURN ON ASSET |
% |
2.99 |
7.03 |
4.05 |
|
EARNING PER SHARE |
BAHT |
23.89 |
47.88 |
25.29 |
|
|
|
|
|
|
|
LEVERAGE RATIO |
|
|
|
|
|
DEBT RATIO |
TIMES |
0.73 |
0.70 |
0.74 |
|
DEBT TO EQUITY RATIO |
TIMES |
2.64 |
2.35 |
2.88 |
|
TIME INTEREST EARNED |
TIMES |
2.45 |
3.75 |
2.49 |
|
|
|
|
|
|
|
ANNUAL GROWTH |
|
|
|
|
|
SALES GROWTH |
% |
54.55 |
66.07 |
|
|
OPERATING PROFIT |
% |
(35.51) |
54.70 |
|
|
NET PROFIT |
% |
(50.12) |
89.34 |
|
|
FIXED ASSETS |
% |
7.06 |
71.93 |
|
|
TOTAL ASSETS |
% |
17.25 |
9.21 |
|
ANNUAL GROWTH : SATISFACTORY
An annual sales growth is 54.55%. Turnover has increased from THB
899,539,318.70 in 2010 to THB 1,390,195,276.66 in 2011. While net profit has
decreased from THB 38,306,084.04 in 2010 to THB 19,108,369.23 in 2011. And
total assets has increased from THB 545,212,267.55 in 2010 to THB
639,288,318.09 in 2011.
PROFITABILITY : RISKY
PROFITABILITY RATIO
|
Gross Profit Margin |
6.20 |
Deteriorated |
Industrial Average |
27.62 |
|
Net Profit Margin |
1.37 |
Deteriorated |
Industrial Average |
4.19 |
|
Return on Assets |
2.99 |
Deteriorated |
Industrial Average |
11.49 |
|
Return on Equity |
10.89 |
Deteriorated |
Industrial Average |
23.37 |
Gross Profit Margin used to assess a firm's financial health by
revealing the proportion of money left over from revenues after accounting for
the cost of goods sold. Gross profit margin serves as the source for paying
additional expenses and future savings. The company's figure is 6.2%. When
compared with the industry average, the ratio of the company was lower. This
indicated that company may have problems with control over its costs.
Net Profit Margin is the indicator of the company's efficiency in that
net profit takes into consideration all expenses of the company. A low profit
margin indicates a low margin of safety, higher risk that a decline in sales
will erase profits and result in a net loss. The company's figure is 1.37%.
When compared with the industry average, the ratio of the company was lower.
Return on Assets measures how efficiently profits are being generated
from the assets employed in the business when compared with the ratios of firms
in a similar business. A low ratio in comparison with industry averages
indicates an inefficient use of business assets. When compared with the
industry average, it was lower, the company's figure is 2.99%.
Return on Equity indicates how profitable a company is by comparing its
net income to its average shareholders' equity, ROE measures how much the
shareholders earned for their investment in the company. When compared with the
industry average, it was lower, the company's figure is 10.89%.
Trend of the average competitors in the same industry for last 5 years
Return on Assets Uptrend
Return on Equity Uptrend
LIQUIDITY : RISKY
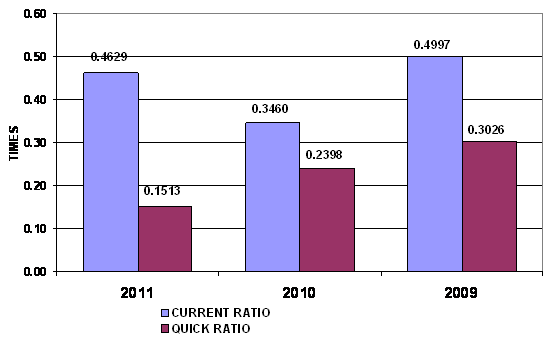
LIQUIDITY RATIO
|
Current Ratio |
0.46 |
Risky |
Industrial Average |
1.21 |
|
Quick Ratio |
0.15 |
|
|
|
|
Cash Conversion Cycle |
44.08 |
|
|
|
The Current Ratio is to ascertain whether a company's short-term assets
are readily available to pay off its short-term liabilities. The company's
figure is 0.46 times in 2011, increased from 0.35 times, then the company may
not be efficiently using its current assets. When compared with the industry
average, the ratio of the company was lower.
The Quick Ratio is a liquidity indicator that further refines the
current ratio by measuring the amount of the most liquid current assets there
are to cover current liabilities. The company's figure is 0.15 times in 2011,
decreased from 0.24 times, then the company has not enough current assets that
presumably can be quickly converted to cash for pay financial obligations.
The Cash Conversion Cycle measures the number of days a company's cash
is tied up in the production and sales process of its operations and the
benefit from payment terms from its creditors. It meant the company could
survive when no cash inflow was received from sale for 45 days.
Trend of the average competitors in the same industry for last 5 years
Current Ratio Uptrend
LEVERAGE : ACCEPTABLE
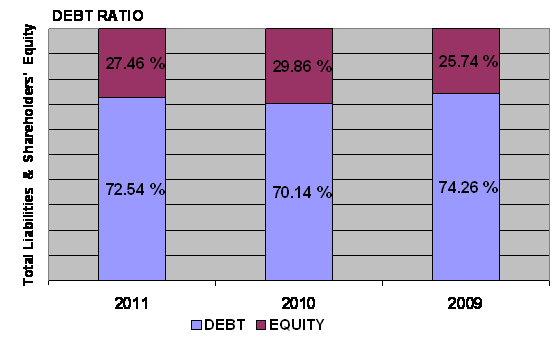

LEVERAGE RATIO
|
Debt Ratio |
0.73 |
Acceptable |
Industrial Average |
0.52 |
|
Debt to Equity Ratio |
2.64 |
Risky |
Industrial Average |
1.07 |
|
Times Interest Earned |
2.45 |
Impressive |
Industrial Average |
- |
Debt to Equity Ratio a measurement of how much suppliers, lenders,
creditors and obligors have committed to the company versus what the shareholders
have committed. A lower the percentage means that the company is using less
leverage and has a stronger equity position.
Times Interest Earned measuring a company's ability to meet its debt
obligations. Ratio is 2.45 higher than 1, so the company can pay interest
expenses on outstanding debt.
Debt Ratio shows the proportion of a company's assets which are financed
through debt. The company's figure is 0.73 greater than 0.5, most of the
company's assets are financed through debt.
Trend of the average competitors in the same industry for last 5 years
Debt Ratio Downtrend
Times Interest Earned Downtrend
ACTIVITY : IMPRESSIVE

ACTIVITY RATIO
|
Fixed Assets Turnover |
8.17 |
Impressive |
Industrial Average |
- |
|
Total Assets Turnover |
2.17 |
Satisfactory |
Industrial Average |
2.74 |
|
Inventory Conversion Period |
38.97 |
|
|
|
|
Inventory Turnover |
9.37 |
Impressive |
Industrial Average |
8.56 |
|
Receivables Conversion Period |
6.85 |
|
|
|
|
Receivables Turnover |
53.25 |
Impressive |
Industrial Average |
5.38 |
|
Payables Conversion Period |
1.74 |
|
|
|
The company's Account Receivable Ratio is calculated as 53.25 and 42.92
in 2011 and 2010 respectively. This ratio measures the efficiency of the
company in managing its trade debtors to generate revenue. A lower ratio may
indicate over extension and collection problems. Conversely, a higher ratio may
indicate an overtly stringent policy. In this case, the company's A/R ratio in
2011 increased from 2010. This would suggest the company had good performance
in the management of its debt collections.
Inventory Turnover in Days Ratio indicates the liquidity of inventory.
It estimates the number of days that it will take to sell the current
inventory. Inventory is particularly sensitive to change in business
activities. The inventory turnover in days has increased from 17 days at the
end of 2010 to 39 days at the end of 2011. This represents a negative trend.
And Inventory turnover has decreased from 22.11 times in year 2010 to 9.37
times in year 2011.
The company's Total Asset Turnover is calculated as 2.17 times and 1.65
times in 2011 and 2010 respectively. This ratio is determined by dividing total
assets into total sales turnover. The ratio measures the activity of the assets
and the ability of the firm to generate sales through the use of the assets.
Trend of the average competitors in the same industry for last 5 years
Fixed Assets Turnover Downtrend
Total Assets Turnover Uptrend
Inventory Turnover Downtrend
Receivables Turnover Downtrend
FOREIGN EXCHANGE RATES
|
Currency |
Unit
|
Indian Rupees |
|
US Dollar |
1 |
Rs.56.57 |
|
|
1 |
Rs.86.15 |
|
Euro |
1 |
Rs.73.64 |
INFORMATION DETAILS
|
Report Prepared
by : |
SDA |
RATING EXPLANATIONS
|
RATING |
STATUS |
PROPOSED CREDIT LINE |
|
|
>86 |
Aaa |
Possesses an extremely sound financial base with the strongest
capability for timely payment of interest and principal sums |
Unlimited |
|
71-85 |
Aa |
Possesses adequate working capital. No caution needed for credit
transaction. It has above average (strong) capability for payment of interest
and principal sums |
Large |
|
56-70 |
A |
Financial & operational base are regarded healthy. General
unfavourable factors will not cause fatal effect. Satisfactory capability for
payment of interest and principal sums |
Fairly Large |
|
41-55 |
Ba |
Overall operation is considered normal. Capable to meet normal
commitments. |
Satisfactory |
|
26-40 |
B |
Capability to overcome financial difficulties seems comparatively
below average. |
Small |
|
11-25 |
Ca |
Adverse factors are apparent. Repayment of interest and principal sums
in default or expected to be in default upon maturity |
Limited with
full security |
|
<10 |
C |
Absolute credit risk exists. Caution needed to be exercised |
Credit not
recommended |
|
---- |
NB |
New Business |
---- |
This score serves as a reference to assess SC’s credit risk
and to set the amount of credit to be extended. It is calculated from a
composite of weighted scores obtained from each of the major sections of this
report. The assessed factors and their relative weights (as indicated through
%) are as follows:
Financial
condition (40%) Ownership
background (20%) Payment record
(10%)
Credit history
(10%) Market trend
(10%) Operational
size (10%)
This report is issued at your request without any
risk and responsibility on the part of MIRA INFORM PRIVATE LIMITED (MIPL)
or its officials.