MIRA INFORM REPORT
|
Report Date : |
11.06.2013 |
IDENTIFICATION DETAILS
|
Name : |
TAVORN
RUBBER INDUSTRY [1982]
COMPANY LIMITED |
|
|
|
|
Registered Office : |
33
Karnchanavanich Road, T.
Sadao, A. Sadao, Songkhla
90120 |
|
|
|
|
Country : |
Thailand |
|
|
|
|
Financials (as on) : |
31.12.2011 |
|
|
|
|
Date of Incorporation : |
06.08.1982 |
|
|
|
|
Com. Reg. No.: |
0905525000336 [Former : SOK. KHOR. 154] |
|
|
|
|
Legal Form : |
Private Limited Company |
|
|
|
|
Line of Business : |
manufacturer,
exporter and distributor
various kinds of
ribbed smoke sheets, including RSS-1, RSS-2,
RSS-3, RSS-4 & RSS-5, as
well as concentrated latex. |
|
|
|
|
No. of Employees : |
400 |
RATING & COMMENTS
|
MIRA’s Rating : |
Ba |
|
RATING |
STATUS |
PROPOSED CREDIT LINE |
|
|
41-55 |
Ba |
Overall operation is considered normal. Capable to meet normal
commitments. |
Satisfactory |
|
Status : |
Good |
|
Payment Behaviour : |
No Complaints |
|
Litigation : |
Clear |
NOTES:
Any query related to this report can be made
on e-mail: infodept@mirainform.com
while quoting report number, name and date.
ECGC Country Risk Classification List – March 31st 2013
|
Country Name |
Previous Rating (31.12.2012) |
Current Rating (31.03.2013) |
|
Thailand |
B1 |
B1 |
|
Risk Category |
ECGC
Classification |
|
Insignificant |
A1 |
|
Low |
A2 |
|
Moderate |
B1 |
|
High |
B2 |
|
Very High |
C1 |
|
Restricted |
C2 |
|
Off-credit |
D |
Thailand ECONOMIC OVERVIEW
With a well-developed infrastructure, a free-enterprise economy,
generally pro-investment policies, and strong export industries, Thailand
achieved steady growth due largely to industrial and agriculture exports -
mostly electronics, agricultural commodities, automobiles and parts, and
processed foods. Thailand is trying to maintain growth by encouraging domestic
consumption and public investment to offset weak exports in 2012. Unemployment,
at less than 1% of the labor force, stands as one of the lowest levels in the
world, which puts upward pressure on wages in some industries. Thailand also
attracts nearly 2.5 million migrant workers from neighboring countries. The
Thai government is implementing a nation-wide 300 baht ($10) per day minimum
wage policy and deploying new tax reforms designed to lower rates on
middle-income earners. The Thai economy has weathered internal and external
economic shocks in recent years. The global economic severely cut Thailand's
exports, with most sectors experiencing double-digit drops. In 2009, the
economy contracted 2.3%. However, in 2010, Thailand's economy expanded 7.8%,
its fastest pace since 1995, as exports rebounded. In late 2011 growth was
interrupted by historic flooding in the industrial areas in Bangkok and its
five surrounding provinces, crippling the manufacturing sector. Industry
recovered from the second quarter of 2012 onward with GDP growth at 5.5% in
2012. The government has approved flood mitigation projects worth $11.7
billion, which were started in 2012, to prevent similar economic damage, and an
additional $75 billion for infrastructure over the next seven years with a plan
to start in 2013.
|
Source
: CIA |
Company name
TAVORN RUBBER INDUSTRY
[1982] COMPANY LIMITED
SUMMARY
BUSINESS ADDRESS : 33
KARNCHANAVANICH ROAD, T.
SADAO,
A. SADAO,
SONGKHLA 90120, THAILAND
TELEPHONE : [66] 74
411-353-4
FAX : [66] 74
411-352, 411-152
E-MAIL ADDRESS : tvrrubb@tvrrubber.com
REGISTRATION ADDRESS : SAME
AS BUSINESS ADDRESS
ESTABLISHED : 1982
REGISTRATION NO. : 0905525000336 [Former
: SOK. KHOR. 154]
TAX ID NO. : 3901003217
CAPITAL
REGISTERED : BHT.
287,000,000
CAPITAL
PAID-UP : BHT.
287,000,000
SHAREHOLDER’S PROPORTION : THAI :
100%
FISCAL
YEAR CLOSING DATE : DECEMBER 31
LEGAL STATUS : PRIVATE LIMITED
COMPANY
EXECUTIVE : DR. TAVORN
RUANGVARUNWATTANA, THAI
MANAGING DIRECTOR
NO. OF
STAFF : 400
LINES OF
BUSINESS : RIBBED SMOKE
SHEET & CONCENTRATED
LATEX
MANUFACTURER, DISTRIBUTOR
& EXPORTER
CORPORATE PROFILE
OPERATING TREND : STABLE
PRESENT SITUATION : OPERATING NORMALLY
REPUTATION : GOOD
WITH NORMAL BUSINESS
ENGAGEMENT
MANAGEMENT STANDARD : MANAGEMENT WITH
GOOD PERFORMANCE
HISTORY
The subject was
established on August
6, 1982 as a private
limited company under the
registered name TAVORN
RUBBER INDUSTRY [1982]
COMPANY LIMITED by Thai
groups, with the business
objective to manufacture ribbed smoke
sheet and concentrated
latex for exports.
It currently employs
approximately 400 staff.
In 2002, the
subject was granted
the standard ISO
9001 certificate by
SGS Yarsley International
Ltd.
The subject’s registered
address was initially
located at 41
Padangbezar Rd., T.
Sadao,
A. Sadao, Songkhla
90120.
On October 12,
1993, the subject’s
registered address was
relocated to 33 Karnchanavanich Rd.,
T. Sadao, A.
Songkhla 90120, and
this is the
company’s current operation address.
THE BOARD OF
DIRECTOR
|
Name |
|
Nationality |
Age |
|
|
|
|
|
|
Dr. Tavorn Ruangvarunwattana |
|
Thai |
66 |
|
Mrs. Naiyana Ruangvarunwattana |
|
Thai |
66 |
|
Mr. Chairat Ruangvarunwattana |
|
Thai |
41 |
|
Mr. Chaipoj Ruangvarunwattana |
|
Thai |
38 |
AUTHORIZED PERSON
Any two of
the above directors
can jointly sign
on behalf of
the subject with
company’s affixed.
MANAGEMENT
Dr. Tavorn Ruangvarunwattana is
the Managing Director.
He is Thai
nationality with the
age of 66
years old. He
is holding the
Managing Director position
of the subject
and the companies in the
group.
Mrs. Naiyana Ruangvarunwattana is
the Deputy Managing
Director.
She is Thai
nationality with the
age of 66
years old.
Mr. Chairat Ruangvarunwattana is
the Factory Manager.
He is Thai
nationality with the
age of 41
years old.
BUSINESS OPERATIONS
The subject’s activities
are manufacturer, exporter
and distributor various
kinds of ribbed
smoke sheets, including
RSS-1, RSS-2, RSS-3,
RSS-4 & RSS-5, as
well as concentrated latex.
The processing starts
from cleaning non-smoked
sheets in pool water,
hanging rubber sheet
on hanging trolley,
smoking in smoke
chambers with temperature
control at below
65oc, clipping out
all overheat and
foreign matters contamination, grading
smoked sheet into
grade number one
to number five,
according to international
natural rubber type
and grade description.
PRODUCTION CAPACITY
35,000 tons per
annum
PURCHASE
100% of raw
materials mainly natural
latex is purchased
directly from planters
in the southern
region of Thailand,
as well as
chemicals are purchased
from local agents.
MAJOR SUPPLIER
Tavorn Rubber Products
Industry Co., Ltd. : Thailand
EXPORT
80% of the
products is sold
to manufactures and
dealers in Asian Region
including Taiwan, Republic of
China, Korea, Malaysia,
Singapore, Australia, Indonesia,
India Philippines and
European countries.
SALES [LOCAL]
20% of the
products is sold
locally by wholesale
to manufacturers.
AFFILIATED/RELATED COMPANY
Tavorn Rubber
Products Industry Co., Ltd.
Business Type : Manufacturer
of concentrated latex
products
Address : 33
Karnchanavanich Rd., T.
Sadao, A. Sadao,
Songkhla 90120
Tavorn TTR
Industry Co., Ltd.
Business Type : Blocked
Rubber and T.T.R.
products
Address : 33 Karnchanavanich Rd.,
T. Sadao, A.
Sadao, Songkhla 90120
LITIGATION
Bankruptcy and
Receivership
There are no
litigation on bankruptcy
and receivership cases filed against the
subject found at Legal
Execution Department for
the past five
years.
Others
There are no
legal suits filed
against the subject
for the past
two years.
CREDIT
Sales are by
cash or on
the credit terms
of 30-60 days.
Local bills are
paid by cash
or on the
credit term of
30-60 days.
Exports are against
L/C at sight
or T/T.
BUSINESS TRANSACTION
In term of
sales, its products
are sold to
overseas customers mainly
by L/C at sight, and
the remaining are by
T/T on
negotiated term. The
subject is not
found to have
payment problem from
its customers. For
the purchasing, 100%
of raw material
is purchased from
local suppliers with
maximum credit receipt
at 30-60 days.
The subject is not found to have
payment problems with any suppliers.
BANKING
Krung Thai
Bank Public Co.,
Ltd.
[Hadyai Branch:
18 Nipat-uthit Rd.,
Hadyai, Songkhla 90110]
Export-Import Bank
of Thailand
[Hadyai Branch : 24
Sinbenchapol Bldg., Korhong,
Hadyai, Songkhla 90110]
Bangkok Bank
Public Co., Ltd.
EMPLOYMENT
The subject employs
approximately 400 staff. [office staff
and factory workers]
LOCATION DETAILS
The premise is
owned for administrative office
and factory on
80,000 sq.m. plot of
land at the
heading address. Premise
is located in
rural area of
Songkhla province, in
the Southern region.
COMMENT
It was pessimistic about
the market of rubber sheet
and latex in the first
quarter of 2013 after
enjoying a strong
sales growth in
the previous year. This
was resulted by decreasing
demand of major
market like China.
Economy slowdown in
China has halted
demand of rubber sheet
and latex reflecting
price declining considerably.
FINANCIAL INFORMATION
The capital was
initially registered at
Bht. 10,000,000 divided into
1,000 shares of
Bht. 10,000 each.
The capital was
increased later as
follows:
Bht. 20,000,000
on March 11,
1987
Bht. 80,000,000
on March 28,
2001
Bht. 87,000,000
on November 11,
2003
Bht. 187,000,000
on September 1,
2009
Bht. 287,000,000
on December 27,
2012
The latest registered
capital was increased
to Bht. 287,000,000
divided into 28,700
shares of Bht.
10,000 each with
fully paid.
THE SHAREHOLDERS
LISTED WERE : [as at
December 17, 2012]
|
NAME |
HOLDING |
% |
|
|
|
|
|
Dr. Tavorn
Ruangvarunwattana Nationality: Thai Address : 33/36 Karnchanavanich Rd.,
T. Sadao, A. Sadao,
Songkhla 90120 |
8,110 |
28.26 |
|
Mrs. Naiyana
Ruangvarunwattana Nationality: Thai Address : 33/36 Karnchanavanich Rd.,
T. Sadao, A. Sadao,
Songkhla 90120 |
8,010 |
27.92 |
|
Mr. Chairat
Ruangvarunwattana Nationality: Thai Address : 33/36 Karnchanavanich Rd.,
T. Sadao, A. Sadao,
Songkhla 90120 |
4,220 |
14.70 |
|
Mr. Chaipoj
Ruangvarunwattana Nationality: Thai Address : 33/36 Karnchanavanich Rd.,
T. Sadao, A. Sadao,
Songkhla 90120 |
4,220 |
14.70 |
|
Mrs. Pornsiri
Ruangvarunwattana Nationality: Thai Address : 33/36 Karnchanavanich Rd.,
T. Sadao, A. Sadao,
Songkhla 90120 |
2,070 |
7.21 |
|
Ms. Karaket
Ruangvarunwattana Nationality: Thai Address : 33/36 Karnchanavanich Rd.,
T. Sadao, A. Sadao,
Songkhla 90120 |
2,070 |
7.21 |
Total Shareholders
: 6
Share Structure [as
at December 17,
2012]
|
Nationality |
Shareholders |
No. of Share |
% Shares |
|
|
|
|
|
|
Thai |
6 |
28,700 |
100.00 |
|
Foreign |
- |
- |
- |
|
Total |
6 |
28,700 |
100.00 |
NAME OF
AUDITOR & CERTIFIED
PUBLIC ACCOUNTANT NO. :
Ms. Somkaew
Runglertkriengkrai No. 2715
BALANCE SHEET [BAHT]
The
latest financial figures
published for December
31, 2011, 2010
& 2009 were:
ASSETS
|
Current Assets |
2011 |
2010 |
2009 |
|
|
|
|
|
|
Cash and Cash Equivalent |
102,375,909.00 |
65,306,798.69 |
7,569,303.08 |
|
Short-term Investment -
fixed assets |
24,867,261.77 |
9,702,056.74 |
9,077,566.44 |
|
Trade Accounts Receivable |
1,022,511,996.43 |
576,867,749.33 |
492,038,358.85 |
|
Short-term Lending to Person
Related |
178,753,491.43 |
- |
69,618,387.93 |
|
Inventories |
695,969,739.70 |
576,386,777.11 |
480,259,973.46 |
|
Advance Payment |
13,310,887.05 |
8,629,558.05 |
41,207,587.13 |
|
Other Current Assets |
80,784,937.50 |
36,852,470.99 |
32,030,727.33 |
|
|
|
|
|
|
Total Current Assets |
2,118,574,222.88 |
1,273,745,410.91 |
1,131,801,904.22 |
|
Other Long-term Investment |
127,380,812.50 |
127,380,812.50 |
127,380,812.50 |
|
Fixed Assets |
380,205,075.75 |
294,617,471.02 |
264,810,283.94 |
|
Other Non-current Assets |
38,204.80 |
38,204.80 |
37,196.26 |
|
Total Assets |
2,631,198,315.93 |
1,695,781,899.23 |
1,524,030,196.92 |
LIABILITIES &
SHAREHOLDERS’ EQUITY [BAHT]
|
Current Liabilities |
2011 |
2010 |
2009 |
|
|
|
|
|
|
Bank Overdraft & Short-term
Loan from Financial Institute |
1,943,002,684.04 |
1,175,635,668.25 |
988,273,439.00 |
|
Trade Accounts Payable
& Other |
75,417,779.84 |
34,544,467.76 |
139,134,441.77 |
|
Short-term Loan from Person & Related Company |
68,200,569.17 |
102,443,064.21 |
16,857,769.18 |
|
Other Current Liabilities |
108,516,331.81 |
53,351,416.15 |
53,835,624.38 |
|
|
|
|
|
|
Total Current Liabilities |
2,195,137,364.86 |
1,365,974,616.37 |
1,198,101,274.33 |
|
|
|
|
|
|
Long-term Loan from Financial Institutions |
30,125,513.21 |
37,292,513.21 |
40,514,513.21 |
|
Total Liabilities |
2,225,262,878.07 |
1,403,267,129.58 |
1,238,615,787.54 |
|
|
|
|
|
|
Shareholders’ Equity |
|
|
|
|
|
|
|
|
|
Share capital : Baht 10,000
par value authorized,
issued and fully
paid share
capital 18,700, shares |
187,000,000.00 |
187,000,000.00 |
187,000,000.00 |
|
|
|
|
|
|
Capital Paid |
187,000,000.00 |
187,000,000.00 |
187,000,000.00 |
|
Statutory Reserve |
6,345,720.47 |
6,345,720.47 |
1,500,000.00 |
|
Retained Earning-
Unappropriated |
212,589,717.39 |
99,169,049.18 |
96,914,409.38 |
|
Total Shareholders' Equity |
405,935,437.86 |
292,514,769.65 |
285,414,409.38 |
|
Total Liabilities &
Shareholders' Equity |
2,631,198,315.93 |
1,695,781,899.23 |
1,524,030,196.92 |
PROFIT & LOSS
ACCOUNT
|
Revenue |
2011 |
2010 |
2009 |
|
|
|
|
|
|
Sales Income |
9,719,552,904.62 |
6,928,490,397.73 |
4,593,360,751.94 |
|
Other Income |
114,219,249.65 |
41,397,494.68 |
26,935,830.24 |
|
Total Revenues |
9,833,772,154.27 |
6,969,887,892.41 |
4,620,296,582.18 |
|
Expenses |
|
|
|
|
|
|
|
|
|
Cost of Goods
Sold |
9,084,691,493.37 |
6,599,089,446.32 |
4,244,287,990.24 |
|
Selling Expenses |
480,865,557.39 |
269,221,686.98 |
249,826,616.90 |
|
Administrative Expenses |
38,157,774.59 |
30,361,317.16 |
27,732,337.37 |
|
Total Expenses |
9,603,714,825.35 |
6,898,672,450.46 |
4,521,846,944.51 |
|
|
|
|
|
|
Profit / [Loss] before Financial Cost & Income
Tax |
230,057,328.92 |
71,215,441.95 |
98,449,637.67 |
|
Financial Cost |
[64,527,251.10] |
[30,469,641.53] |
[27,051,950.03] |
|
Profit / [Loss] before Income
Tax |
165,530,077.82 |
40,745,800.42 |
71,397,687.64 |
|
Income Tax |
[52,109,409.61] |
[13,075,440.15] |
[22,240,132.10] |
|
|
|
|
|
|
Net Profit / [Loss] |
113,420,668.21 |
27,670,360.27 |
49,157,555.54 |
FINANCIAL ANALYSIS
|
ITEM |
UNIT |
2011 |
2010 |
2009 |
|
|
|
|
|
|
|
LIQUIDITY RATIO |
|
|
|
|
|
CURRENT RATIO |
TIMES |
0.97 |
0.93 |
0.94 |
|
QUICK RATIO |
TIMES |
0.61 |
0.48 |
0.48 |
|
|
|
|
|
|
|
ACTIVITY RATIO |
|
|
|
|
|
FIXED ASSETS TURNOVER |
TIMES |
25.56 |
23.52 |
17.35 |
|
TOTAL ASSETS TURNOVER |
TIMES |
3.69 |
4.09 |
3.01 |
|
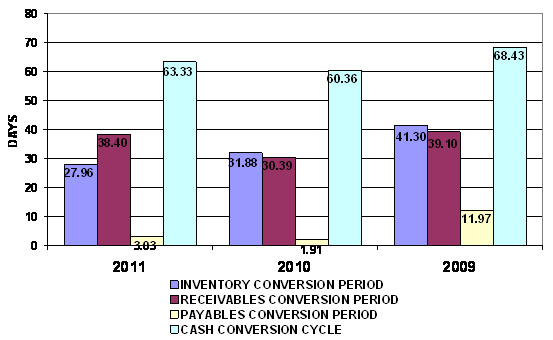
INVENTORY CONVERSION PERIOD |
DAYS |
27.96 |
31.88 |
41.30 |
|
INVENTORY TURNOVER |
TIMES |
13.05 |
11.45 |
8.84 |
|
RECEIVABLES CONVERSION PERIOD |
DAYS |
38.40 |
30.39 |
39.10 |
|
RECEIVABLES TURNOVER |
TIMES |
9.51 |
12.01 |
9.34 |
|
PAYABLES CONVERSION PERIOD |
DAYS |
3.03 |
1.91 |
11.97 |
|
CASH CONVERSION CYCLE |
DAYS |
63.33 |
60.36 |
68.43 |
|
|
|
|
|
|
|
PROFITABILITY
RATIO |
|
|
|
|
|
COST OF GOODS SOLD |
% |
93.47 |
95.25 |
92.40 |
|
SELLING & ADMINISTRATION |
% |
5.34 |
4.32 |
6.04 |
|
INTEREST |
% |
0.66 |
0.44 |
0.59 |
|
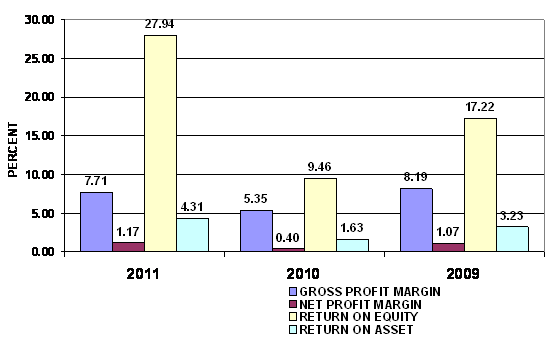
GROSS PROFIT MARGIN |
% |
7.71 |
5.35 |
8.19 |
|
NET PROFIT MARGIN BEFORE EX. ITEM |
% |
2.37 |
1.03 |
2.14 |
|
NET PROFIT MARGIN |
% |
1.17 |
0.40 |
1.07 |
|
RETURN ON EQUITY |
% |
27.94 |
9.46 |
17.22 |
|
RETURN ON ASSET |
% |
4.31 |
1.63 |
3.23 |
|
EARNING PER SHARE |
BAHT |
6,065.28 |
1,479.70 |
2,628.75 |
|
|
|
|
|
|
|
LEVERAGE RATIO |
|
|
|
|
|
DEBT RATIO |
TIMES |
0.85 |
0.83 |
0.81 |
|
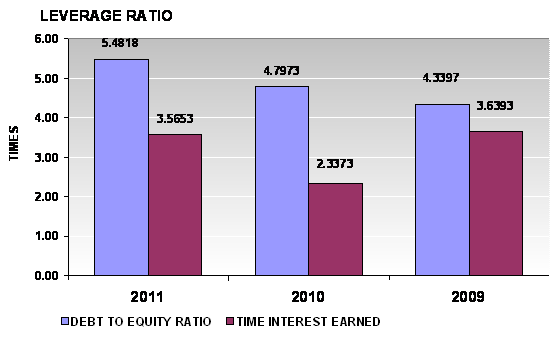
DEBT TO EQUITY RATIO |
TIMES |
5.48 |
4.80 |
4.34 |
|
TIME INTEREST EARNED |
TIMES |
3.57 |
2.34 |
3.64 |
|
|
|
|
|
|
|
ANNUAL GROWTH |
|
|
|
|
|
SALES GROWTH |
% |
40.28 |
50.84 |
|
|
OPERATING PROFIT |
% |
223.04 |
(27.66) |
|
|
NET PROFIT |
% |
309.90 |
(43.71) |
|
|
FIXED ASSETS |
% |
29.05 |
11.26 |
|
|
TOTAL ASSETS |
% |
55.16 |
11.27 |
|
ANNUAL GROWTH :
EXCELLENT
An annual sales growth is 40.28%. Turnover has increased from THB
6,928,490,397.73 in 2010 to THB 9,719,552,904.62 in 2011. While net profit has
increased from THB 27,670,360.27 in 2010 to THB 113,420,668.21 in 2011. And total
assets has increased from THB 1,695,781,899.23 in 2010 to THB 2,631,198,315.93
in 2011.
PROFITABILITY :
IMPRESSIVE
PROFITABILITY
RATIO
|
Gross Profit Margin |
7.71 |
Deteriorated |
Industrial Average |
16.61 |
|
Net Profit Margin |
1.17 |
Impressive |
Industrial Average |
0.89 |
|
Return on Assets |
4.31 |
Impressive |
Industrial Average |
3.75 |
|
Return on Equity |
27.94 |
Impressive |
Industrial Average |
13.21 |
Gross Profit Margin used to assess a firm's financial health by
revealing the proportion of money left over from revenues after accounting for
the cost of goods sold. Gross profit margin serves as the source for paying
additional expenses and future savings. The company's figure is 7.71%. When
compared with the industry average, the ratio of the company was lower. This
indicated that company may have problems with control over its costs.
Net Profit Margin is the indicator of the company's efficiency in that
net profit takes into consideration all expenses of the company. A low profit
margin indicates a low margin of safety, higher risk that a decline in sales
will erase profits and result in a net loss. The company's figure is 1.17%,
higher figure when compared with those of its average competitors in the same
industry, indicated that business was an efficient operator in a dominant position within its industry.
Return on Assets measures how efficiently profits are being generated
from the assets employed in the business when compared with the ratios of firms
in a similar business. A low ratio in comparison with industry averages
indicates an inefficient use of business assets. Return on Assets ratio is
4.31%, higher figure when compared with those of its average competitors in the
same industry, indicated that business was an efficient profit in a dominant position within its industry.
Return on Equity indicates how profitable a company is by comparing its net
income to its average shareholders' equity, ROE measures how much the
shareholders earned for their investment in the company. Return on Equity ratio
is 27.94%, higher figure when compared with those of its average competitors in
the same industry, indicated that business was an efficient profit in a dominant position within its industry.
Trend of the
average competitors in the same industry for last 5 years
Return on Assets Uptrend
Return on Equity Uptrend
LIQUIDITY : RISKY
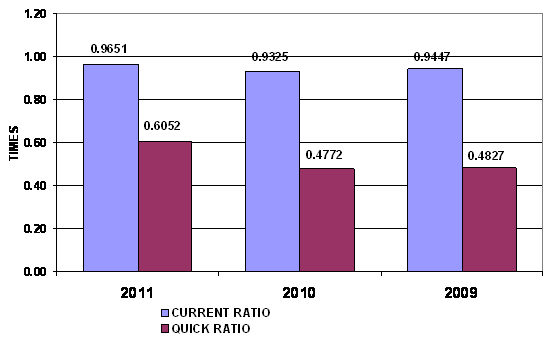
LIQUIDITY RATIO
|
Current Ratio |
0.97 |
Risky |
Industrial Average |
1.21 |
|
Quick Ratio |
0.61 |
|
|
|
|
Cash Conversion Cycle |
63.33 |
|
|
|
The Current Ratio is to ascertain whether a company's short-term assets
are readily available to pay off its short-term liabilities. The company's
figure is 0.97 times in 2011, increased from 0.93 times, then the company may
have problems meeting its short-term obligations. When compared with the
industry average, the ratio of the company was lower.
The Quick Ratio is a liquidity indicator that further refines the
current ratio by measuring the amount of the most liquid current assets there
are to cover current liabilities. The company's figure is 0.61 times in 2011,
increased from 0.48 times, then the company has not enough current assets that
presumably can be quickly converted to cash for pay financial obligations.
The Cash Conversion Cycle measures the number of days a company's cash
is tied up in the production and sales process of its operations and the
benefit from payment terms from its creditors. It meant the company could
survive when no cash inflow was received from sale for 64 days.
Trend of the
average competitors in the same industry for last 5 years
Current Ratio Uptrend
LEVERAGE :
ACCEPTABLE
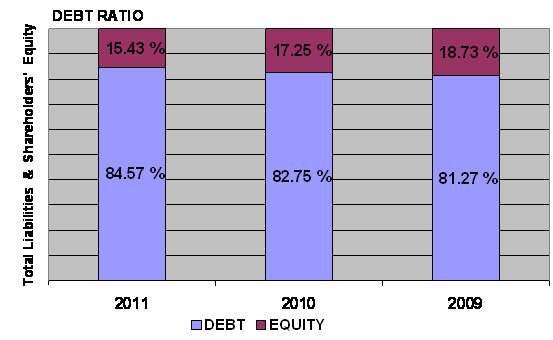
LEVERAGE RATIO
|
Debt Ratio |
0.85 |
Acceptable |
Industrial Average |
0.68 |
|
Debt to Equity Ratio |
5.48 |
Risky |
Industrial Average |
2.15 |
|
Times Interest Earned |
3.57 |
Impressive |
Industrial Average |
- |
Debt to Equity Ratio a measurement of how much suppliers, lenders,
creditors and obligors have committed to the company versus what the
shareholders have committed. A lower the percentage means that the company is
using less leverage and has a stronger equity position.
Times Interest Earned measuring a company's ability to meet its debt
obligations. Ratio is 3.57 higher than 1, so the company can pay interest
expenses on outstanding debt.
Debt Ratio shows the proportion of a company's assets which are financed
through debt. The company's figure is 0.85 greater than 0.5, most of the
company's assets are financed through debt.
Trend of the
average competitors in the same industry for last 5 years
Debt Ratio Downtrend
Times Interest Earned Downtrend
ACTIVITY :
IMPRESSIVE
ACTIVITY RATIO
|
Fixed Assets Turnover |
25.56 |
Impressive |
Industrial Average |
- |
|
Total Assets Turnover |
3.69 |
Satisfactory |
Industrial Average |
4.23 |
|
Inventory Conversion Period |
27.96 |
|
|
|
|
Inventory Turnover |
13.05 |
Impressive |
Industrial Average |
9.34 |
|
Receivables Conversion Period |
38.40 |
|
|
|
|
Receivables Turnover |
9.51 |
Impressive |
Industrial Average |
5.91 |
|
Payables Conversion Period |
3.03 |
|
|
|
The company's Account Receivable Ratio is calculated as 9.51 and 12.01
in 2011 and 2010 respectively. This ratio measures the efficiency of the
company in managing its trade debtors to generate revenue. A lower ratio may
indicate over extension and collection problems. Conversely, a higher ratio may
indicate an overtly stringent policy. In this case, the company's A/R ratio in
2011 decreased from 2010. This would suggest the company had deteriorated in
the management of its debt collections.
Inventory Turnover in Days Ratio indicates the liquidity of inventory.
It estimates the number of days that it will take to sell the current
inventory. Inventory is particularly sensitive to change in business
activities. The inventory turnover in days has decreased from 32 days at the
end of 2010 to 28 days at the end of 2011. This represents a positive trend.
And Inventory turnover has increased from 11.45 times in year 2010 to 13.05
times in year 2011.
The company's Total Asset Turnover is calculated as 3.69 times and 4.09
times in 2011 and 2010 respectively. This ratio is determined by dividing total
assets into total sales turnover. The ratio measures the activity of the assets
and the ability of the firm to generate sales through the use of the assets.
Trend of the
average competitors in the same industry for last 5 years
Fixed Assets Turnover Downtrend
Total Assets Turnover Downtrend
Inventory Turnover Downtrend
Receivables Turnover Downtrend
FOREIGN EXCHANGE RATES
|
Currency |
Unit
|
Indian Rupees |
|
US Dollar |
1 |
Rs.57.78 |
|
UK Pound |
1 |
Rs.89.71 |
|
Euro |
1 |
Rs.76.24 |
INFORMATION DETAILS
|
Report Prepared
by : |
MNL |
RATING EXPLANATIONS
|
RATING |
STATUS |
PROPOSED CREDIT LINE |
|
|
>86 |
Aaa |
Possesses an extremely sound financial base with the strongest
capability for timely payment of interest and principal sums |
Unlimited |
|
71-85 |
Aa |
Possesses adequate working capital. No caution needed for credit transaction.
It has above average (strong) capability for payment of interest and
principal sums |
Large |
|
56-70 |
A |
Financial & operational base are regarded healthy. General unfavourable
factors will not cause fatal effect. Satisfactory capability for payment of
interest and principal sums |
Fairly Large |
|
41-55 |
Ba |
Overall operation is considered normal. Capable to meet normal
commitments. |
Satisfactory |
|
26-40 |
B |
Capability to overcome financial difficulties seems comparatively
below average. |
Small |
|
11-25 |
Ca |
Adverse factors are apparent. Repayment of interest and principal sums
in default or expected to be in default upon maturity |
Limited with full
security |
|
<10 |
C |
Absolute credit risk exists. Caution needed to be exercised |
Credit not
recommended |
|
---- |
NB |
New Business |
---- |
This score serves as a reference to assess
SC’s credit risk and to set the amount of credit to be extended. It is
calculated from a composite of weighted scores obtained from each of the major
sections of this report. The assessed factors and their relative weights (as
indicated through %) are as follows:
Financial
condition (40%) Ownership
background (20%) Payment
record (10%)
Credit history
(10%) Market trend (10%) Operational size
(10%)
This report is issued at your request without any
risk and responsibility on the part of MIRA INFORM PRIVATE LIMITED (MIPL)
or its officials.