MIRA INFORM REPORT
|
Report Date : |
12.06.2013 |
IDENTIFICATION DETAILS
|
Name : |
DONG NAI PHARMACEUTICAL JOINT STOCK COMPANY |
|
|
|
|
Registered Office : |
No. 221B Pham Van Thuan Str, Tan Tien Ward, Bien Hoa City, Dong Nai
Province |
|
|
|
|
Country : |
Vietnam |
|
|
|
|
Financials (as on) : |
31.12.2012 |
|
|
|
|
Date of Incorporation : |
26.11.1996 |
|
|
|
|
Com. Reg. No.: |
3600248086 |
|
|
|
|
Legal Form : |
Public Company |
|
|
|
|
Line of Business : |
Manufacturing and trading in pharmaceutical, cosmetic, medical
material, medical equipments. |
|
|
|
|
No. of Employees : |
145 |
RATING & COMMENTS
|
MIRA’s Rating : |
B |
|
RATING |
STATUS |
PROPOSED CREDIT LINE |
|
|
26-40 |
B |
Capability to overcome financial difficulties seems comparatively
below average. |
Small |
|
Status : |
Moderate |
|
|
|
|
Payment Behaviour : |
No Complaints |
|
|
|
|
Litigation : |
Clear |
NOTES:
Any query related to this report can be made
on e-mail: infodept@mirainform.com
while quoting report number, name and date.
ECGC Country Risk Classification List – March, 31st, 2013
|
Country Name |
Previous Rating (31.12.2012) |
Current Rating (31.03.2013) |
|
Vietnam |
B1 |
B1 |
|
Risk Category |
ECGC
Classification |
|
Insignificant |
A1 |
|
Low |
A2 |
|
Moderate |
B1 |
|
High |
B2 |
|
Very High |
C1 |
|
Restricted |
C2 |
|
Off-credit |
D |
VIETNAM - ECONOMIC OVERVIEW
Vietnam is a densely-populated developing country that has
been transitioning from the rigidities of a centrally-planned economy since
1986. Vietnamese authorities have reaffirmed their commitment to economic
modernization in recent years. Vietnam joined the World Trade Organization in
January 2007, which has promoted more competitive, export-driven industries.
Vietnam became an official negotiating partner in the Trans-Pacific Partnership
trade agreement in 2010. Agriculture''s share of economic output has continued
to shrink from about 25% in 2000 to less than 22% in 2012, while industry''s
share increased from 36% to nearly 41% in the same period. State-owned
enterprises account for roughly 40% of GDP. Poverty has declined significantly,
and Vietnam is working to create jobs to meet the challenge of a labor force
that is growing by more than one million people every year. The global
recession hurt Vietnam''s export-oriented economy, with GDP in 2012 growing at
5%, the slowest rate of growth since 1999. In 2012, however, exports increased
by more than 18%, year-on-year; several administrative actions brought the
trade deficit back into balance. Between 2008 and 2011, Vietnam''s managed
currency, the dong, was devalued in excess of 20%, but its value remained
stable in 2012. Foreign direct investment inflows fell 4.5% to $10.5 billion in
2012. Foreign donors have pledged $6.5 billion in new development assistance
for 2013. Hanoi has oscillated between promoting growth and emphasizing
macroeconomic stability in recent years. In February 2011, the Government
shifted policy away from policies aimed at achieving a high rate of economic
growth, which had stoked inflation, to those aimed at stabilizing the economy,
through tighter monetary and fiscal control. Although Vietnam unveiled a broad,
"three pillar" economic reform program in early 2012, proposing the
restructuring of public investment, state-owned enterprises, and the banking
sector, little perceptible progress had been made by early 2013. Vietnam''s
economy continues to face challenges from an undercapitalized banking sector.
Non-performing loans weigh heavily on banks and businesses. In September 2012,
the official bad debt ratio climbed to 8.8%, though some independent analysts
believe it could be higher than 15%.
|
Source
: CIA |
SUBJECT IDENTIFICATION & LEGAL FORM
|
Current legal status |
||
|
English Name |
|
DONG NAI PHARMACEUTICAL JOINT STOCK COMPANY |
|
Vietnamese Name |
|
CONG TY CO PHAN DUOC DONG NAI |
|
Trade name |
|
DONAIPHARM |
|
Type of Business |
|
Joint stock company |
|
Year Established |
|
1996 |
|
Establishment Decision |
|
No. 5609/QD-UBT |
|
Date of Issuance |
|
26 Nov 1996 |
|
Place of Issuance |
|
People Committee of Dong Nai Province |
|
Business Registration No. |
|
3600248086 |
|
Date of Registration |
|
24 Apr 2009 |
|
Place of Registration |
|
Dong Nai Province Department of Planning and Investment |
|
Chartered capital |
|
VND 19,854,470,000 |
|
Status |
|
Public Company |
|
Stock symbol |
|
DPP |
|
Stock Market |
|
UPCOM |
|
Tax code |
|
3600248086 |
|
Total Employees |
|
145 |
Historical Identification & Legal form
|
List |
Changed Items |
Date of changes |
|
1 |
Subject has got Former Chief Accountant: Ms. Pham My Le Changed to: Ms. Pham Thi Thanh Thuy - The current Chief accountant |
01 May 2013 |
|
2 |
Subject has got former Business Registration No: 4703000293 dated on
23 Dec 2005 Changed to: 3600248086 |
24 Apr 2009 |
|
3 |
Subject has got former Board Of Director: Mr. NGUYEN ANH DUC -Director
Changed to: Mr. NGUYEN VAN PHUOC - Director |
01 Jan 2009 |
|
4 |
Subject has got former Registered English Name: DONGNAI PHARMACEUTICAL
COMPANY Changed to: DONG NAI PHARMACEUTICAL JOINT STOCK COMPANY |
01 Jan 2006 |
|
5 |
Subject has got former Registered Vietnamese Name: CONG TY DUOC PHAM
DONG NAI Changed to: CONG TY CO PHAN DUOC DONG NAI |
01 Jan 2006 |
ADDRESSES
|
Head Office |
||
|
Address |
|
No. 221B Pham Van Thuan Str, Tan Tien Ward, Bien Hoa City, Dong Nai
Province, Vietnam |
|
Telephone |
|
(84-61)3823107/ 3822691/ 3822218 |
|
Fax |
|
(84-61)3821608 / 3818300 |
|
Email |
|
|
|
Website |
|
|
|
|
||
|
Branch in Dong Nai |
||
|
Address |
|
Nguyen An Ninh Street - Phuoc Hai zone, Long Thanh District, Dong Nai
Province, Vietnam |
|
Telephone |
|
(84-61) 3 844 167 |
|
Fax |
|
(84-61) 3 844 167 |
|
|
||
|
Branch in Dong Nai |
||
|
Address |
|
Three-way crossroads Suoi Cat, Suoi Cat commune, Xuan Loc District,
Dong Nai Province, Vietnam |
|
Telephone |
|
(84-61) 3871433 |
|
Fax |
|
(84-61) 3871433 |
|
|
||
|
Branch in Dong Nai |
||
|
Address |
|
Hiep Quyet Hamlet Dinh Quan Town, Dinh Quan District, Dong Nai
Province, Vietnam |
|
Telephone |
|
(84-61) 3851097 |
|
Fax |
|
(84-61) 3851097 |
|
|
||
|
Branch in Dong Nai |
||
|
Address |
|
Pham Van Thuan Street - Trang Bom Town, Trang Bom District, Dong Nai
Province, Vietnam |
|
Telephone |
|
(84-61)3866248 |
|
Fax |
|
(84-61)3866248 |
|
|
||
SUBSIDIARIES AND RELATED COMPANIES
|
PARENT COMPANY - DONG NAI IMPORT EXPORT PROCESSING AGRICULTURAL
PRODUCTS AND FOODS COMPANY |
||
|
Business Registration |
|
3600268170 |
|
Date of Registration |
|
01 Jul 2010 |
|
Place of Registration |
|
Planning & Investment Department of Dong Nai Province |
|
Registered Capital |
|
VND 230,000,000,000 |
|
Tax code |
|
3600268170 |
|
Address |
|
Hanoi Highway - Long Binh Ward, Bien Hoa City, Dong Nai Province,
Vietnam |
|
Tel |
|
(84-61) 3892577/ 3892571 |
|
Fax |
|
(84-61) 3892578/ 3891549 |
|
Website |
|
|
DIRECTORS
|
1. NAME |
|
Mr. NGUYEN VAN PHUOC |
|
Position |
|
Chairman cum Director |
|
Date of Birth |
|
01 Jan 1962 |
|
ID Number/Passport |
|
271183067 |
|
ID Issue Date |
|
05 Jul 2006 |
|
ID Issue Place |
|
Dong Nai Department of Public Security |
|
Resident |
|
C239, KP3 Long Binh Ward, Bien Hoa City, Dong Nai
Province, Vietnam |
|
Nationality |
|
Vietnamese |
|
Qualification |
|
Pharmacist |
|
|
||
|
2. NAME |
|
Ms. NGUYEN THI THANH TRUC |
|
Position |
|
Deputy Director |
|
Date of Birth |
|
01 Jan 1960 |
|
ID Number/Passport |
|
270150508 |
|
ID Issue Date |
|
18 Feb 1998 |
|
ID Issue Place |
|
Dong Nai Department of Public Security |
|
Resident |
|
No. K3/297 Tan Binh Str, Buu Hoa Ward, Bien Hoa
City, Dong Nai Province, Vietnam |
|
Nationality |
|
Vietnamese |
|
Qualification |
|
Pharmacist |
|
|
||
|
3. NAME |
|
Ms. DO THI NGA |
|
Position |
|
Deputy Director |
|
Date of Birth |
|
01 Jan 1968 |
|
ID Number/Passport |
|
271344506 |
|
ID Issue Date |
|
16 Mar 1995 |
|
ID Issue Place |
|
Dong Nai Department of Public Security |
|
Resident |
|
272/36, KP2 Trung Dung Ward, Bien Hoa City, Dong
Nai Province, Vietnam |
|
Nationality |
|
Vietnamese |
|
Qualification |
|
Economic Bachelor |
|
|
||
|
4. NAME |
|
Ms. PHAM THI THANH THUY |
|
Position |
|
Chief Accountant |
|
Nationality |
|
Vietnamese |
BUSINESS NATURE AND ACTIVITIES
|
The subject registers and operates in the
following business activities: |
IMPORT & EXPORT ACTIVITIES
|
IMPORT: |
||
|
Types of products |
|
Materials |
|
Market |
|
Canada, China, India, France, Germany, Spanish, Southern African countries, ... |
|
|
||
|
EXPORT: |
||
|
Note: The subject does not export currently. |
||
BANKERS
|
1. JOINT STOCK COMMERCIAL BANK FOR FOREIGN TRADE OF VIETNAM DONG NAI
BRANCH |
||
|
Address |
|
No 77C Hung Dao Vuong, Trung Dung Ward, Bien Hoa City, Dong Nai
Province, Vietnam |
|
Telephone |
|
(84-61) 3823666 |
|
Fax |
|
(84-61) 3824191 |
|
|
||
|
2. VIETNAM EXPORT IMPORT COMMERCIAL JOINT STOCK BANK |
||
|
Address |
|
8th Floor, VinCom Center, No. 72 Le Thanh Ton street , 1 District, Ho
Chi Minh City, Vietnam |
|
Telephone |
|
(84-8) 3821 0055 - 3821 0056 |
|
Fax |
|
(84-8) 3829 6063 - 3821 6913 |
|
|
||
|
3. VIET NAM BANK FOR AGRICULTURE AND RURAL DEVELOPMENT DONG NAI BRANCH
|
||
|
Address |
|
No. 121-123 30/4 Str., Bien Hoa City, Dong Nai Province, Vietnam |
|
Telephone |
|
(84-61) 3 822 543 |
|
Fax |
|
(84-61) 3 822 585 |
SHAREHOLDERS
|
Following is founding shareholder list of the subject as in its business registration |
||
|
1. NAME |
|
DONG NAI IMPORT EXPORT PROCESSING AGRICULTURAL PRODUCTS AND FOODS
COMPANY |
|
Business Registration |
|
3600268170 |
|
Date of Registration |
|
01 Jul 2010 |
|
Place of Registration |
|
Planning & Investment Department of Dong Nai Province |
|
Registered Capital |
|
VND 230,000,000,000 |
|
Tax code |
|
3600268170 |
|
Address |
|
Hanoi Highway - Long Binh Ward, Bien Hoa City, Dong Nai Province,
Vietnam |
|
Tel |
|
(84-61) 3892577/ 3892571 |
|
Fax |
|
(84-61) 3892578/ 3891549 |
|
Email |
|
donafoods@hcm.vnn.vn |
|
Website |
|
http://www.donafoods.com |
|
Number of shares |
|
1,012,605 |
|
Value of shares |
|
VND 10,126,050,000 |
|
Percentage |
|
51% |
|
|
||
|
2. NAME |
|
NGOC THU PHARMACEUTICAL COMPANY LIMITED |
|
Business Registration |
|
0052770 |
|
Tax code |
|
3600282672 |
|
Address |
|
No. 32, 30/4 Str Quyet Thang Ward, Bien Hoa City, Dong Nai Province,
Vietnam |
|
Tel |
|
(84 - 61) 3822531 |
|
Number of shares |
|
147,595 |
|
Value of shares |
|
VND 1,475,950,000 |
|
Percentage |
|
7.43% |
|
|
||
|
3. NAME |
|
EMPLOYEE SHAREHOLDERS |
|
Number of shares |
|
22,885 |
|
Value of shares |
|
VND 228,850,000 |
|
Percentage |
|
1.15% |
FINANCIAL DATA
|
BALANCE SHEET |
|||
|
Unit: One VND |
|||
|
Balance sheet
date |
31/12/2012 |
31/12/2011 |
31/12/2010 |
|
Number of weeks |
52 |
52 |
52 |
|
ASSETS |
|||
|
A – CURRENT ASSETS |
72,407,039,697 |
73,704,666,463 |
77,162,615,342 |
|
I. Cash and cash equivalents |
4,169,917,797 |
5,046,098,787 |
7,109,239,722 |
|
1. Cash |
4,169,917,797 |
2,746,098,787 |
7,109,239,722 |
|
2. Cash equivalents |
0 |
2,300,000,000 |
0 |
|
II. Short-term investments |
0 |
0 |
0 |
|
1. Short-term investments |
0 |
0 |
0 |
|
2. Provisions for devaluation of short-term investments |
0 |
0 |
0 |
|
III. Accounts receivable |
47,921,771,630 |
49,054,594,689 |
53,716,450,380 |
|
1. Receivable from customers |
47,768,092,333 |
48,633,753,547 |
52,349,895,930 |
|
2. Prepayments to suppliers |
153,679,297 |
298,463,794 |
1,366,554,450 |
|
3. Inter-company receivable |
0 |
0 |
0 |
|
4. Receivable according to the progress of construction |
0 |
0 |
0 |
|
5. Other receivable |
0 |
122,377,348 |
0 |
|
6. Provisions for bad debts |
0 |
0 |
0 |
|
IV. Inventories |
19,957,532,523 |
19,373,619,442 |
15,990,993,908 |
|
1. Inventories |
19,957,532,523 |
19,373,619,442 |
16,109,064,308 |
|
2. Provisions for devaluation of inventories |
0 |
0 |
-118,070,400 |
|
V. Other Current Assets |
357,817,747 |
230,353,545 |
345,931,332 |
|
1. Short-term prepaid expenses |
95,754,352 |
169,707,178 |
67,059,805 |
|
2. VAT to be deducted |
0 |
5,646,367 |
239,151,440 |
|
3. Taxes and other accounts receivable from the State |
127,303,395 |
0 |
512,587 |
|
4. Other current assets |
134,760,000 |
55,000,000 |
39,207,500 |
|
B. LONG-TERM ASSETS |
22,242,686,367 |
25,333,057,293 |
26,793,022,746 |
|
I. Long term accounts receivable |
0 |
1,184,043,781 |
1,184,043,781 |
|
1. Long term account receivable from customers |
0 |
0 |
0 |
|
2. Working capital in affiliates |
0 |
0 |
0 |
|
3. Long-term inter-company receivable |
0 |
0 |
0 |
|
4. Other long-term receivable |
0 |
1,184,043,781 |
1,184,043,781 |
|
5. Provisions for bad debts from customers |
0 |
0 |
0 |
|
II. Fixed assets |
21,921,225,967 |
23,664,500,924 |
25,059,254,013 |
|
1. Tangible assets |
21,921,225,967 |
23,664,500,924 |
25,059,254,013 |
|
- Historical costs |
39,433,246,569 |
39,741,183,575 |
39,276,646,682 |
|
- Accumulated depreciation |
-17,512,020,602 |
-16,076,682,651 |
-14,217,392,669 |
|
2. Financial leasehold assets |
0 |
0 |
0 |
|
- Historical costs |
0 |
0 |
0 |
|
- Accumulated depreciation |
0 |
0 |
0 |
|
3. Intangible assets |
0 |
0 |
0 |
|
- Initial costs |
0 |
0 |
0 |
|
- Accumulated amortization |
0 |
0 |
0 |
|
4. Construction-in-progress |
0 |
0 |
0 |
|
III. Investment property |
0 |
0 |
0 |
|
Historical costs |
0 |
0 |
0 |
|
Accumulated depreciation |
0 |
0 |
0 |
|
IV. Long-term investments |
11,400,000 |
11,400,000 |
11,400,000 |
|
1. Investments in affiliates |
0 |
0 |
0 |
|
2. Investments in business concerns and joint ventures |
0 |
0 |
0 |
|
3. Other long-term investments |
11,400,000 |
11,400,000 |
11,400,000 |
|
4. Provisions for devaluation of long-term investments |
0 |
0 |
0 |
|
V. Other long-term assets |
310,060,400 |
473,112,588 |
538,324,952 |
|
1. Long-term prepaid expenses |
310,060,400 |
473,112,588 |
538,324,952 |
|
2. Deferred income tax assets |
0 |
0 |
0 |
|
3. Other long-term assets |
0 |
0 |
0 |
|
VI. Goodwill |
0 |
0 |
0 |
|
1. Goodwill |
0 |
0 |
0 |
|
TOTAL ASSETS |
94,649,726,064 |
99,037,723,756 |
103,955,638,088 |
|
|
|||
|
LIABILITIES |
|||
|
A- LIABILITIES |
67,339,411,014 |
70,886,918,086 |
79,231,179,982 |
|
I. Current liabilities |
65,013,673,770 |
66,903,634,303 |
72,197,939,112 |
|
1. Short-term debts and loans |
10,090,000,000 |
10,616,000,000 |
10,211,000,000 |
|
2. Payable to suppliers |
50,264,453,605 |
50,449,928,556 |
55,625,212,706 |
|
3. Advances from customers |
305,542,886 |
2,159,934,369 |
4,374,957,838 |
|
4. Taxes and other obligations to the State Budget |
2,004,308,402 |
1,580,885,875 |
935,939,393 |
|
5. Payable to employees |
1,828,797,749 |
952,845,591 |
701,905,279 |
|
6. Accrued expenses |
370,201,879 |
124,361,838 |
0 |
|
7. Inter-company payable |
0 |
0 |
0 |
|
8. Payable according to the progress of construction contracts |
0 |
0 |
0 |
|
9. Other payable |
0 |
1,012,605,000 |
348,923,896 |
|
10. Provisions for short-term accounts payable |
0 |
0 |
0 |
|
11. Bonus and welfare funds |
150,369,249 |
7,073,074 |
0 |
|
II. Long-Term Liabilities |
2,325,737,244 |
3,983,283,783 |
7,033,240,870 |
|
1. Long-term accounts payable to suppliers |
0 |
0 |
0 |
|
2. Long-term inter-company payable |
0 |
0 |
0 |
|
3. Other long-term payable |
1,371,290,189 |
996,950,000 |
1,074,200,000 |
|
4. Long-term debts and loans |
954,447,055 |
2,808,414,140 |
5,788,510,282 |
|
5. Deferred income tax payable |
0 |
0 |
0 |
|
6. Provisions for unemployment allowances |
0 |
177,919,643 |
170,530,588 |
|
7. Provisions for long-term accounts payable |
0 |
0 |
0 |
|
8. Unearned Revenue |
0 |
0 |
0 |
|
9. Science and technology development fund |
0 |
0 |
0 |
|
B- OWNER’S EQUITY |
27,310,315,050 |
28,150,805,670 |
24,724,458,106 |
|
I. OWNER’S EQUITY |
27,231,005,913 |
28,071,496,533 |
21,928,550,151 |
|
1. Capital |
19,854,470,000 |
19,854,470,000 |
19,854,470,000 |
|
2. Share premiums |
0 |
0 |
0 |
|
3. Other sources of capital |
2,917,157,439 |
2,065,713,257 |
1,418,824,902 |
|
4. Treasury stocks |
0 |
0 |
0 |
|
5. Differences on asset revaluation |
0 |
0 |
0 |
|
6. Foreign exchange differences |
0 |
-915,001 |
19,597,589 |
|
7. Business promotion fund |
912,133,711 |
302,017,257 |
189,015,241 |
|
8. Financial reserved fund |
540,223,520 |
305,563,345 |
189,015,240 |
|
9. Other funds |
0 |
0 |
0 |
|
10. Retained earnings |
3,007,021,243 |
5,544,647,675 |
2,957,850,453 |
|
11. Construction investment fund |
0 |
0 |
0 |
|
12. Business arrangement supporting fund |
0 |
0 |
0 |
|
II. Other sources and funds |
79,309,137 |
79,309,137 |
95,684,681 |
|
1. Bonus and welfare funds (Elder form) |
0 |
0 |
16,375,544 |
|
2. Sources of expenditure |
79,309,137 |
79,309,137 |
79,309,137 |
|
3. Fund to form fixed assets |
0 |
0 |
0 |
|
MINORITY’S INTEREST |
0 |
0 |
0 |
|
TOTAL LIABILITIES AND OWNER’S EQUITY |
94,649,726,064 |
99,037,723,756 |
103,955,638,088 |
PROFIT & LOSS
STATEMENT
|
Description |
FY2012 |
FY2011 |
FY2010 |
|
1. Total Sales |
116,150,378,402 |
114,221,059,192 |
100,684,625,244 |
|
2. Deduction item |
179,470,452 |
278,094,807 |
295,003,070 |
|
3. Net revenue |
115,970,907,950 |
113,942,964,385 |
100,389,622,174 |
|
4. Costs of goods sold |
94,365,825,046 |
91,422,532,746 |
85,995,705,660 |
|
5. Gross profit |
21,605,082,904 |
22,520,431,639 |
14,393,916,514 |
|
6. Financial income |
425,317,562 |
352,125,046 |
97,393,780 |
|
7. Financial expenses |
1,819,202,795 |
2,546,694,595 |
2,117,509,491 |
|
- In which: Loan interest expenses |
1,665,914,578 |
2,067,421,946 |
1,601,279,996 |
|
8. Selling expenses |
8,913,333,895 |
9,143,172,901 |
6,159,813,069 |
|
9. Administrative overheads |
7,553,166,323 |
4,832,775,523 |
3,107,900,750 |
|
10. Net operating profit |
3,744,697,453 |
6,349,913,666 |
3,106,086,984 |
|
11. Other income |
336,381,566 |
223,212,900 |
39,195,813 |
|
12. Other expenses |
49,516,510 |
298,339,578 |
25,000,000 |
|
13. Other profit /(loss) |
286,865,056 |
-75,126,678 |
14,195,813 |
|
14. Total accounting profit before tax |
4,031,562,509 |
6,274,786,988 |
3,120,282,797 |
|
15. Current corporate income tax |
1,024,541,267 |
730,139,313 |
142,432,344 |
|
16. Deferred corporate income tax |
0 |
0 |
0 |
|
17. Interest from subsidiaries/related companies |
0 |
0 |
0 |
|
18. Profit after tax |
3,007,021,242 |
5,544,647,675 |
2,977,850,453 |
FINANCIAL RATIOS AND
AVERAGE INDUSTRY RATIOS
|
Description |
FY2012 |
FY2011 |
FY2010 |
Average Industry |
|
Current liquidity ratio |
1.11 |
1.10 |
1.07 |
1.80 |
|
Quick liquidity ratio |
0.81 |
0.81 |
0.85 |
1.12 |
|
Inventory circle |
4.73 |
4.72 |
5.09 |
3.56 |
|
Average receive period |
150.83 |
157.14 |
195.30 |
117.46 |
|
Utilizing asset performance |
1.23 |
1.15 |
0.97 |
1.10 |
|
Liability by total assets |
71.15 |
71.58 |
76.22 |
50.87 |
|
Liability by owner's equity |
246.57 |
251.81 |
320.46 |
169.03 |
|
Ebit / Total assets (ROA) |
6.02 |
8.42 |
4.54 |
12.05 |
|
Ebit / Owner's equity (ROE) |
20.86 |
29.63 |
19.10 |
27.25 |
|
Ebit / Total revenue (NPM) |
4.91 |
7.30 |
4.69 |
12.32 |
|
Gross profit / Total revenue (GPM) |
18.60 |
19.72 |
14.30 |
29.69 |
|
Note: The Average Industry was calculated by VietnamCredit based on our own statistical data |
||||
CASH FLOW STATEMENT
|
(Direct method) |
|||
|
Items |
FY2012 |
FY2011 |
FY2010 |
|
I. Cash flows from operating activities |
|||
|
1.Cash received from customers |
175,657,852,764 |
179,294,866,079 |
176,607,449,926 |
|
2. Cash paid to suppliers |
-139,844,529,711 |
-143,827,513,238 |
-147,168,911,509 |
|
3. Cash paid to employees |
-10,316,193,727 |
-8,626,507,424 |
-6,939,888,800 |
|
4. Interest paid |
-1,662,099,578 |
-2,068,054,389 |
-1,601,279,996 |
|
5. Income taxes paid |
-1,401,365,477 |
-726,131,475 |
0 |
|
6. Other operating cash receipts |
2,621,374,748 |
3,021,138,891 |
3,069,007,838 |
|
7. Other operating payments |
-20,487,575,997 |
-25,227,926,980 |
-14,103,086,490 |
|
Net cash flows from operating activities |
4,567,463,022 |
1,839,871,464 |
9,863,290,969 |
|
II. Cash flows from investing activities |
|||
|
1. Purchases and construction of fixed assets and other long-term
assets |
-107,922,727 |
-450,445,984 |
-2,143,740,141 |
|
2. Gains from disposals and liquidation of fixed assets and other
long-term assets |
0 |
0 |
0 |
|
3. Loans given and purchases of debt instruments of other entities |
0 |
0 |
0 |
|
4. Recovery of loans given and disposals of debt instruments of other
entities |
0 |
0 |
0 |
|
5. Investments into other entities |
0 |
0 |
0 |
|
6. Withdrawals of investments in other entities |
0 |
0 |
0 |
|
7. Receipts of loan interests, dividends and profit shared |
323,741,394 |
211,360,230 |
0 |
|
Net cash flows from investing activities |
215,818,667 |
-239,085,754 |
-2,143,740,141 |
|
III. Cash flows from financing activities |
|||
|
1. Gains from stock issuance and capital contributions from
shareholders |
0 |
0 |
0 |
|
2. Repayment for capital contributions and re-purchases of stocks
already issues |
0 |
0 |
0 |
|
3. Short-term and long-term loans received |
19,000,000,000 |
17,186,951,000 |
18,138,565,000 |
|
4. Loan principal amounts repaid |
-21,382,018,489 |
-19,975,696,553 |
-21,643,161,791 |
|
5. Payments for financial leasehold assets |
0 |
0 |
0 |
|
6. Dividends and profit already paid to the owners |
-3,277,469,068 |
-972,842,000 |
-334,653,000 |
|
Net cash flows from financing activities |
-5,659,487,557 |
-3,761,587,553 |
-3,839,249,791 |
|
Net cash flows during the year |
-876,205,868 |
-2,160,801,843 |
3,880,301,037 |
|
Beginning cash and cash equivalents |
5,046,098,787 |
7,207,815,631 |
3,327,514,594 |
|
Effects of fluctuations in foreign exchange rates |
24,878 |
-915,001 |
0 |
|
Ending cash and cash equivalents |
4,169,917,797 |
5,046,098,787 |
7,207,815,631 |
PAYMENT HISTORY &
PERFORMANCE EXPERIENCES
|
Trade Morality |
|
Fair |
|
Liquidity |
|
Medium |
|
Payment status |
|
Average |
|
Financial Situation |
|
Average |
|
Development trend |
|
Uptrend |
|
Litigation data |
|
No |
|
Bankruptcy |
|
No |
|
Payment Methods |
|
TT, L/C |
|
Sale Methods |
|
Retailer and Wholesaler |
|
Public opinion |
|
Average |
INTERPRETATION ON THE SCORES
|
DONG NAI PHARMACEUTICAL
JOINT STOCK COMPANY was founded in 1996 as a state owned company and
equitized into a joint stock company on 1st Jan, 2006. The subject
officially
became a public company in May 2007 and has
been exchanged on UPCOM of Hanoi Stock Exchange (HNX) with the stock symbol of DPP since 2010.
Currently, the subject is operating under the business registration number 3600248086 (the same as tax code) with the chartered capital of VND 19,854,470,000
in which parent
company of the subject is Dong Nai Import Export Processing Agricultural
Products and Foods Company with 51 percent of state shareholder. Head office of
the subject is located at No. 221B Pham Van Thuan Street, Tan Tien Ward -
Bien Hoa City - Dong Nai Province - Vietnam. Besides, the subject has also 4
branches, 20 medical stalls and 400 agents in Dong Nai province. Total
employees are about 145 people working in good condition of premises and
facilities. DONAIPHARM is
principally engaged in manufacturing and trading pharmaceutical, cosmetic,
medical material, medical equipments. It also involves in producing and
processing medical materials from animal and botany, providing import and
export services related to pharmaceutical products. Pharmaceutical materials
are mainly imported from China, India, Germany, Spanish, Southern African countries. The subject
also imports new-drug from Canada and France. Currently, the subject has no
had export activity yet. All the subject’s products are distributed in the
domestic market, mainly in Dong Nai Province and Hochiminh city. Besides, it
also distributes for Pharmaceutical Company in other provinces such as Ben
Tre, Binh Thuan, Daklak, Hanoi,… According to the
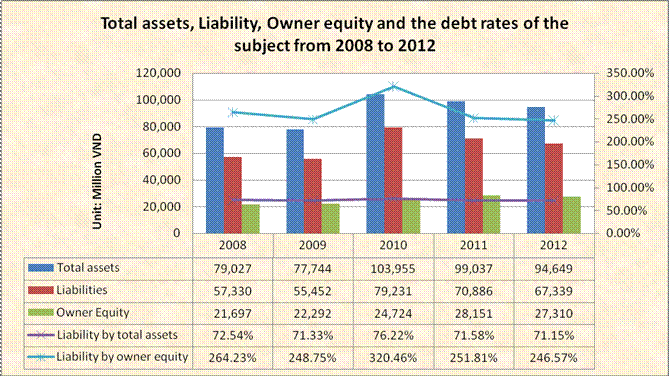
above financial data, the subject’s operation is effective. The value of
total assets at the end of 2012 was VND 94,649 million and reduced slightly
in comparison with that in 2011. Liability and owner equity of the subject
also have downtrend in recent years. However, Liability by total asset has
not changed much over years, the subject always kept them in stable rate
(about 70%). This is no good sign for creditors. Its liquidity ratios were
lower than the average industry index but it was still at acceptable level. Following is a
chart which showed total assets, liability, owner equity and the debt rates
of the subject from 2008 to 2012
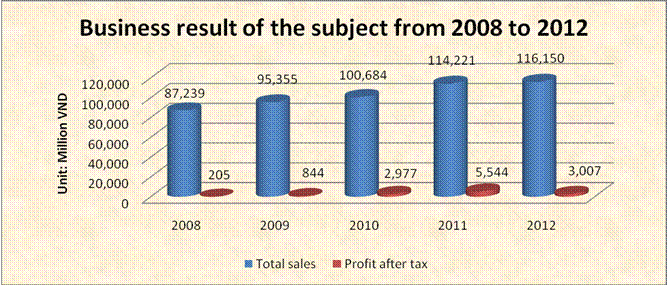
On its income
statement, total sales of the subject company increased slightly year by
year. In 2012, total sales reached VND 116,150 million
and were higher VND 1,929 million than that in 2011. The profit after tax of
VND 3,007 million in 2012 was a sharp reduction in comparison with the result
of VND 5,544 million in the previous year. Low profit after tax was seen as
effects of unfavorable economic conditions to the business performance. The
sharp increase in the material costs; higher expenses for selling and
administrative overheads are factors to decreasing profit after tax. In general, the subject in the industry is rather good and development
is uptrend. The liquidity ratio is average as well as profit ratio. Management
capacity is fair. At current, the subject has capacity to meet small and
medium financial commitments. |
INDUSTRY DATA
|
Industry code |
GDP growth speed by price compared with 1994 (%) |
Total enterprises 2010 |
Total employees 2011 (Thous.pers.) |
Annual average capital of enterprises 2010 (billion dongs) |
||
|
2012 |
2011 |
|||||
|
Agriculture, Forestry and Fishing |
2.72 |
4.00 |
8,887 |
24,362.9 |
95,227 |
|
|
Industry and Construction |
4.52 |
5.53 |
95,217 |
10,718.9 |
3,641,376 |
|
|
Trade and Services |
6.42 |
6.69 |
187,195 |
15,270.2 |
6,957,082 |
|
|
|
||||||
|
ECONOMIC INDICATORS |
||||||
|
|
||||||
|
|
2012 |
2011 |
2010 |
|||
|
Population
(Million person) |
88.78 |
87.84 |
86.93 |
|||
|
Gross
Domestic Products (USD billion) |
136 |
119 |
102.2 |
|||
|
GDP Growth
(%) |
5.03 |
5.89 |
6.78 |
|||
|
GDP Per
Capita (USD/person/year) |
1,540 |
1,300 |
1,160 |
|||
|
Inflation
(% Change in Composite CPI) |
9.21 |
18.58 |
11.75 |
|||
|
State
Budget Deficit compared with GDP (%) |
4.8 |
4.9 |
5.8 |
|||
|
|
||||||
|
SERVICE TRADE PERFORMANCE |
||||||
|
|
||||||
|
Billion USD |
2012 |
2011 |
2010 |
|||
|
Exports |
114.6 |
96.3 |
72.2 |
|||
|
Imports |
114.3 |
105.8 |
84.8 |
|||
|
Trade
Balance |
0.3 |
-9.5 |
-12.6 |
|||
Source: General Statistics Office
FOREIGN EXCHANGE RATES
|
Currency |
Unit
|
Indian Rupees |
|
US Dollar |
1 |
Rs.58.92 |
|
|
1 |
Rs.91.80 |
|
Euro |
1 |
Rs.78.18 |
INFORMATION DETAILS
|
Report Prepared
by : |
SDA |
RATING EXPLANATIONS
|
RATING |
STATUS |
PROPOSED CREDIT LINE |
|
|
>86 |
Aaa |
Possesses an extremely sound financial base with the strongest
capability for timely payment of interest and principal sums |
Unlimited |
|
71-85 |
Aa |
Possesses adequate working capital. No caution needed for credit
transaction. It has above average (strong) capability for payment of interest
and principal sums |
Large |
|
56-70 |
A |
Financial & operational base are regarded healthy. General unfavourable
factors will not cause fatal effect. Satisfactory capability for payment of
interest and principal sums |
Fairly Large |
|
41-55 |
Ba |
Overall operation is considered normal. Capable to meet normal
commitments. |
Satisfactory |
|
26-40 |
B |
Capability to overcome financial difficulties seems comparatively
below average. |
Small |
|
11-25 |
Ca |
Adverse factors are apparent. Repayment of interest and principal sums
in default or expected to be in default upon maturity |
Limited with full
security |
|
<10 |
C |
Absolute credit risk exists. Caution needed to be exercised |
Credit not
recommended |
|
---- |
NB |
New Business |
---- |
This score serves as a reference to assess
SC’s credit risk and to set the amount of credit to be extended. It is
calculated from a composite of weighted scores obtained from each of the major
sections of this report. The assessed factors and their relative weights (as
indicated through %) are as follows:
Financial
condition (40%) Ownership
background (20%) Payment
record (10%)
Credit history
(10%) Market trend (10%) Operational size
(10%)
This report is issued at your request without any
risk and responsibility on the part of MIRA INFORM PRIVATE LIMITED (MIPL)
or its officials.