MIRA INFORM REPORT
|
Report Date : |
19.06.2013 |
IDENTIFICATION DETAILS
|
Name : |
NAM DINH SILK TEXTILE JOINT STOCK COMPANY |
|
|
|
|
Registered Office : |
No. 4 Ha Huy Tap, Nam Dinh City, Nam Dinh Province |
|
|
|
|
Country : |
Vietnam |
|
|
|
|
Financials (as on) : |
31.12.2011 (Unaudited) |
|
|
|
|
Year of Establishment : |
1920 |
|
|
|
|
Com. Reg. No.: |
0600016097 |
|
|
|
|
Legal Form : |
Joint stock company |
|
|
|
|
Line of Business : |
The subject is specializing in production
and trading in many kinds of fiber and fabric for domestic market and for
export. |
|
|
|
|
No. of Employees : |
400 |
RATING & COMMENTS
|
MIRA’s Rating : |
B |
|
RATING |
STATUS |
PROPOSED CREDIT LINE |
|
|
26-40 |
B |
Capability to overcome financial difficulties seems
comparatively below average. |
Small |
|
Status : |
Moderate |
|
Payment Behaviour : |
No Complaints |
|
Litigation : |
Clear |
NOTES
:
Any query related to this report
can be made on e-mail: infodept@mirainform.com while quoting report
number, name and date.
ECGC Country Risk Classification List – March 31st,
2013
|
Country Name |
Previous Rating (31.12.2012) |
Current Rating (31.03.2013) |
|
Viet Nam |
B1 |
B1 |
|
Risk Category |
ECGC
Classification |
|
Insignificant |
A1 |
|
Low |
A2 |
|
Moderate |
B1 |
|
High |
B2 |
|
Very High |
C1 |
|
Restricted |
C2 |
|
Off-credit |
D |
VIETNAM - ECONOMIC OVERVIEW
Vietnam is a densely-populated developing country that has been transitioning from the rigidities of a centrally-planned economy since 1986. Vietnamese authorities have reaffirmed their commitment to economic modernization in recent years. Vietnam joined the World Trade Organization in January 2007, which has promoted more competitive, export-driven industries. Vietnam became an official negotiating partner in the Trans-Pacific Partnership trade agreement in 2010. Agriculture''s share of economic output has continued to shrink from about 25% in 2000 to less than 22% in 2012, while industry''s share increased from 36% to nearly 41% in the same period. State-owned enterprises account for roughly 40% of GDP. Poverty has declined significantly, and Vietnam is working to create jobs to meet the challenge of a labor force that is growing by more than one million people every year. The global recession hurt Vietnam''s export-oriented economy, with GDP in 2012 growing at 5%, the slowest rate of growth since 1999. In 2012, however, exports increased by more than 18%, year-on-year; several administrative actions brought the trade deficit back into balance. Between 2008 and 2011, Vietnam''s managed currency, the dong, was devalued in excess of 20%, but its value remained stable in 2012. Foreign direct investment inflows fell 4.5% to $10.5 billion in 2012. Foreign donors have pledged $6.5 billion in new development assistance for 2013. Hanoi has oscillated between promoting growth and emphasizing macroeconomic stability in recent years. In February 2011, the Government shifted policy away from policies aimed at achieving a high rate of economic growth, which had stoked inflation, to those aimed at stabilizing the economy, through tighter monetary and fiscal control. Although Vietnam unveiled a broad, "three pillar" economic reform program in early 2012, proposing the restructuring of public investment, state-owned enterprises, and the banking sector, little perceptible progress had been made by early 2013. Vietnam''s economy continues to face challenges from an undercapitalized banking sector. Non-performing loans weigh heavily on banks and businesses. In September 2012, the official bad debt ratio climbed to 8.8%, though some independent analysts believe it could be higher than 15%.
|
Source : CIA |
SUBJECT IDENTIFICATION & LEGAL FORM
|
||
|
|
||
Current legal status
|
||
|
Registered English Name |
|
NAM DINH SILK TEXTILE JOINT STOCK COMPANY |
|
Registered Vietnamese Name |
|
CONG TY CO PHAN DET LUA NAM DINH |
|
Registered short name |
|
NASILKMEX |
|
Type of Business |
|
Joint stock company |
|
Year Established |
|
1920 |
|
Business Registration No. |
|
0600016097 |
|
Date of Registration |
|
21 Dec 2012 |
|
Place of Registration |
|
Nam Dinh Department of Planning &
Investment |
|
Chartered capital |
|
VND 18,500,000,000 |
|
Status |
|
Unlisted |
|
Tax code |
|
0600016097 |
|
Total Employees |
|
400 |
Historical Identification & Legal form
|
List |
Changed Items |
Date of changes |
|
1 |
Subject has got former Business
Registration No: 0703000953 Changed to: 0600016097 |
21
Dec 2012 |
|
2 |
Subject has got former Chartered capital:
VND 11.5 billion Changed to: VND 18.5 billion |
21
Dec 2012 |
|
3 |
Subject has got former Business
Registration No: 106064 Changed to: 0703000953 |
01
Jan 2008 |
|
4 |
Subject has got former Registered English
Name: NAM DINH SILK TEXTILE COMPANY Changed to: NAM DINH SILK TEXTILE JOINT
STOCK COMPANY |
2003
|
|
5 |
Subject has got former Type of Business:
State Owned Enterprise Changed to: Joint stock Company |
2003
|
|
|
||
ADDRESSES
|
||
|
|
||
|
Head Office |
||
|
Address |
|
No. 4 Ha Huy Tap, Nam Dinh City, Nam Dinh
Province, Vietnam |
|
Telephone |
|
(84-350) 3848215/ 3849622 |
|
Fax |
|
(84-350) 3849652 |
|
Email |
|
|
|
Note |
|
Currently, we could not confirm if the given email is belonged to
the subject or not. We also sent an email to that address but no one replies. |
|
|
||
|
Branch in Ha Noi
|
||
|
Address |
|
Floor 6, Textile Institue Building, No.
478 Minh Khai Street, Hai Ba Trung District, Ha Noi City, Vietnam |
|
|
||
|
Branch in Thanh
Hoa |
||
|
Address |
|
Bac Son Ward, Sam Son District, Thanh Hoa
Province, Vietnam |
|
|
||
DIRECTORS
|
||
|
|
||
|
1.
NAME |
|
Mr.
DAO VAN PHUONG |
|
Position |
|
Chairman cum General Director |
|
Date of Birth |
|
20 Oct 1958 |
|
ID Number/Passport |
|
162659649 |
|
ID Issue Date |
|
26 Dec 2007 |
|
ID Issue Place |
|
Nam Dinh Police
Department |
|
Resident |
|
No. 240 Quang Trung
Street, Nam Dinh City, Nam Dinh Province, Vietnam |
|
Nationality |
|
Vietnamese |
|
Tel/Mobile phone |
|
(84) 913299006 |
|
Email |
|
daophuong58@gmail.com |
|
|
||
|
2.
NAME |
|
Mr.
NGUYEN THU BON |
|
Position |
|
Deputy General Director |
|
Nationality |
|
Vietnamese |
|
|
||
|
3.
NAME |
|
Mr.
TRAN DAI HIEU |
|
Position |
|
Chief Accountant |
|
Nationality |
|
Vietnamese |
|
|
||
BUSINESS NATURE AND ACTIVITIES
|
|
|
|
The
subject is specializing in production and trading in many kinds of fiber and
fabric for domestic market and for export. |
|
|
IMPORT & EXPORT ACTIVITIES
|
||
|
|
||
|
IMPORT: |
||
|
·
Types of products |
|
Cotton and raw fiber, equipment |
|
·
Market |
|
Korea, Japan, Singapore, Thailand, Indonesia, EU, USA |
|
|
||
|
EXPORT: |
||
|
·
Market |
|
Japan. |
|
|
||
BANKERS
|
||
|
|
||
|
1.
VIET NAM JOINT STOCK COMMERCIAL BANK FOR INDUSTRY AND TRADE NAM DINH BRANCH |
||
|
Address |
|
No. 73 Quang Trung Str, Nam Dinh City, Nam Dinh Province, Vietnam |
|
Telephone |
|
(84- 350) 3849 346 |
|
|
||
|
SHAREHOLDERS |
||
|
|
||
|
1.
NAME |
|
VIETNAM
NATIONAL TEXTILE AND GARMENT GROUP |
|
Business Registration |
|
0100100008 |
|
Registered Capital |
|
VND 3,400,000,000,000 |
|
Tax code |
|
0100100008 |
|
Address |
|
No.41A Ly Thai To Street, Hoan Kiem
District, Ha Noi City, Vietnam |
|
Tel |
|
(84-4) 38257700 |
|
Fax |
|
(84-4) 38262269 |
|
Email |
|
info@vinatex.com.vn |
|
Website |
|
www.vinatex.com |
|
Percentage |
|
10% |
|
|
||
|
2.
NAME |
|
Other
505 Shareholders |
|
Percentage |
|
90% |
|
|
||
|
FINANCIAL DATA |
|||
|
|
|||
BALANCE SHEET
|
|||
Unit:
One VND
|
|||
|
Balance sheet
date |
31/12/2011 |
31/12/2010 |
31/12/2009 |
|
Number of weeks |
52 |
52 |
52 |
|
Audit status |
Unaudited |
Unaudited |
Unknown |
ASSETS
|
|||
|
A – CURRENT
ASSETS |
152,807,000,000
|
133,903,000,000
|
54,668,749,907
|
|
I. Cash and cash
equivalents |
26,068,000,000
|
22,814,000,000
|
24,205,441,390
|
|
1. Cash |
26,068,000,000 |
22,814,000,000 |
24,205,441,390 |
|
2. Cash equivalents |
0 |
0 |
0 |
|
II. Short-term investments
|
0 |
0 |
0 |
|
1. Short-term investments |
0 |
0 |
0 |
|
2. Provisions for devaluation of short-term investments |
0 |
0 |
0 |
|
III. Accounts
receivable |
1,911,000,000
|
2,568,000,000
|
8,308,723,535
|
|
1. Receivable from customers |
364,000,000 |
0 |
5,586,564,673 |
|
2. Prepayments to suppliers |
840,000,000 |
2,019,000,000 |
2,609,088,029 |
|
3. Inter-company receivable |
0 |
0 |
0 |
|
4. Receivable according to the progress of construction |
0 |
0 |
0 |
|
5. Other receivable |
707,000,000 |
549,000,000 |
113,070,833 |
|
6. Provisions for bad debts |
0 |
0 |
0 |
|
IV. Inventories |
110,064,000,000
|
93,470,000,000
|
21,719,115,384
|
|
1. Inventories |
110,064,000,000 |
93,470,000,000 |
26,057,853,387 |
|
2. Provisions for devaluation of inventories |
0 |
0 |
-4,338,738,003 |
|
V. Other Current
Assets |
14,764,000,000
|
15,051,000,000
|
435,469,598
|
|
1. Short-term prepaid expenses |
0 |
0 |
0 |
|
2. VAT to be deducted |
14,756,000,000 |
15,051,000,000 |
175,869,699 |
|
3. Taxes and other accounts receivable from the State |
0 |
0 |
0 |
|
4. Other current assets |
8,000,000 |
0 |
259,599,899 |
|
B. LONG-TERM
ASSETS |
72,542,000,000
|
62,979,000,000
|
38,055,136,195
|
|
I. Long term
accounts receivable |
0 |
0 |
0 |
|
1. Long term account receivable from customers |
0 |
0 |
0 |
|
2. Working capital in affiliates |
0 |
0 |
0 |
|
3. Long-term inter-company receivable |
0 |
0 |
0 |
|
4. Other long-term receivable |
0 |
0 |
0 |
|
5. Provisions for bad debts from customers |
0 |
0 |
0 |
|
II. Fixed assets
|
32,004,000,000
|
24,241,000,000
|
36,803,308,186
|
|
1. Tangible assets |
19,638,000,000 |
24,065,000,000 |
32,791,044,523 |
|
- Historical costs |
87,092,000,000 |
83,258,000,000 |
115,467,506,914 |
|
- Accumulated depreciation |
-67,454,000,000 |
-59,193,000,000 |
-82,676,462,391 |
|
2. Financial leasehold assets |
0 |
0 |
0 |
|
- Historical costs |
0 |
0 |
0 |
|
- Accumulated depreciation |
0 |
0 |
0 |
|
3. Intangible assets |
6,000,000 |
10,000,000 |
0 |
|
- Initial costs |
13,000,000 |
13,000,000 |
0 |
|
- Accumulated amortization |
-7,000,000 |
-3,000,000 |
0 |
|
4. Construction-in-progress |
12,360,000,000 |
166,000,000 |
4,012,263,663 |
|
III. Investment
property |
0 |
0 |
0 |
|
Historical costs |
0 |
0 |
0 |
|
Accumulated depreciation |
0 |
0 |
0 |
|
IV. Long-term
investments |
0 |
0 |
430,840,000
|
|
1. Investments in affiliates |
0 |
0 |
0 |
|
2. Investments in business concerns and joint ventures |
0 |
0 |
0 |
|
3. Other long-term investments |
0 |
0 |
430,840,000 |
|
4. Provisions for devaluation of long-term investments |
0 |
0 |
0 |
|
V. Other
long-term assets |
40,538,000,000
|
38,738,000,000
|
820,988,009
|
|
1. Long-term prepaid expenses |
40,538,000,000 |
38,738,000,000 |
820,988,009 |
|
2. Deferred income tax assets |
0 |
0 |
0 |
|
3. Other long-term assets |
0 |
0 |
0 |
|
VI. Goodwill |
0 |
0 |
0 |
|
1. Goodwill |
0 |
0 |
0 |
|
TOTAL ASSETS |
225,349,000,000
|
196,882,000,000
|
92,723,886,102
|
|
|
|||
LIABILITIES
|
|||
|
A- LIABILITIES |
171,076,000,000
|
147,142,000,000
|
77,435,107,702
|
|
I. Current
liabilities |
157,581,000,000
|
130,598,000,000
|
50,050,566,581
|
|
1. Short-term debts and loans |
114,353,000,000 |
87,981,000,000 |
16,663,074,703 |
|
2. Payable to suppliers |
18,549,000,000 |
9,941,000,000 |
17,675,314,217 |
|
3. Advances from customers |
1,290,000,000 |
17,236,000,000 |
9,355,316,133 |
|
4. Taxes and other obligations to the State Budget |
747,000,000 |
1,351,000,000 |
2,202,645,849 |
|
5. Payable to employees |
19,863,000,000 |
11,482,000,000 |
1,097,407,835 |
|
6. Accrued expenses |
2,222,000,000 |
1,890,000,000 |
132,171,377 |
|
7. Inter-company payable |
0 |
0 |
0 |
|
8. Payable according to the progress of construction contracts |
0 |
0 |
0 |
|
9. Other payable |
557,000,000 |
717,000,000 |
982,115,511 |
|
10. Provisions for short-term accounts payable |
0 |
0 |
1,942,520,956 |
|
11. Bonus and welfare funds |
0 |
0 |
0 |
|
II. Long-Term
Liabilities |
13,495,000,000
|
16,544,000,000
|
27,384,541,121
|
|
1. Long-term accounts payable to suppliers |
0 |
0 |
0 |
|
2. Long-term inter-company payable |
0 |
0 |
0 |
|
3. Other long-term payable |
2,000,000 |
2,000,000 |
0 |
|
4. Long-term debts and loans |
11,587,000,000 |
15,141,000,000 |
26,912,000,000 |
|
5. Deferred income tax payable |
0 |
0 |
0 |
|
6. Provisions for unemployment allowances |
1,906,000,000 |
1,401,000,000 |
472,541,121 |
|
7. Provisions for long-term accounts payable |
0 |
0 |
0 |
|
8. Unearned Revenue |
0 |
0 |
0 |
|
9. Science and technology development fund |
0 |
0 |
0 |
|
B- OWNER’S
EQUITY |
54,273,000,000
|
49,740,000,000
|
15,288,778,400
|
|
I. OWNER’S
EQUITY |
48,743,000,000
|
44,352,000,000
|
15,127,142,135
|
|
1. Capital |
30,000,000,000 |
30,000,000,000 |
13,374,090,000 |
|
2. Share premiums |
0 |
0 |
0 |
|
3. Other sources of capital |
0 |
0 |
0 |
|
4. Treasury stocks |
0 |
0 |
0 |
|
5. Differences on asset revaluation |
0 |
0 |
0 |
|
6. Foreign exchange differences |
0 |
0 |
81,555,778 |
|
7. Business promotion fund |
15,320,000,000 |
11,584,000,000 |
250,000,000 |
|
8. Financial reserved fund |
3,423,000,000 |
2,768,000,000 |
0 |
|
9. Other funds |
0 |
0 |
0 |
|
10. Retained earnings |
0 |
0 |
1,421,496,357 |
|
11. Construction investment fund |
0 |
0 |
0 |
|
12. Business arrangement supporting fund |
0 |
0 |
0 |
|
II. Other
sources and funds |
5,530,000,000
|
5,388,000,000
|
161,636,265
|
|
1. Bonus and welfare funds (Elder form) |
5,525,000,000 |
5,383,000,000 |
161,636,265 |
|
2. Sources of expenditure |
5,000,000 |
5,000,000 |
0 |
|
3. Fund to form fixed assets |
0 |
0 |
0 |
|
MINORITY’S
INTEREST |
0 |
0 |
0 |
|
TOTAL
LIABILITIES AND OWNER’S EQUITY |
225,349,000,000
|
196,882,000,000
|
92,723,886,102
|
|
|
|||
PROFIT & LOSS STATEMENT
|
|||
|
|
|||
|
Description |
FY2011 |
FY2010 |
FY2009 |
|
1. Total Sales |
507,735,000,000
|
- |
161,580,113,746
|
|
2. Deduction item |
0 |
- |
1,942,520,956 |
|
3. Net revenue |
507,735,000,000
|
- |
159,637,592,790
|
|
4. Costs of goods sold |
476,668,000,000 |
- |
143,528,385,030 |
|
5. Gross profit |
31,067,000,000
|
- |
16,109,207,760
|
|
6. Financial income |
6,252,000,000 |
- |
862,539,535 |
|
7. Financial expenses |
7,180,000,000 |
- |
2,732,061,938 |
|
- In which: Loan interest expenses |
7,127,000,000 |
- |
1,169,615,940 |
|
8. Selling expenses |
3,213,000,000 |
- |
1,430,975,031 |
|
9. Administrative overheads |
19,310,000,000 |
- |
6,748,628,235 |
|
10. Net operating profit |
7,616,000,000
|
- |
6,060,082,091
|
|
11. Other income |
1,117,000,000 |
- |
568,085,423 |
|
12. Other expenses |
0 |
- |
2,567,662,529 |
|
13. Other profit /(loss) |
1,117,000,000
|
- |
-1,999,577,106
|
|
14. Total accounting profit before tax |
8,733,000,000
|
- |
4,060,504,985
|
|
15. Current corporate income tax |
2,183,000,000 |
- |
1,024,307,297 |
|
16. Deferred corporate income tax |
0 |
- |
- |
|
17. Interest from subsidiaries/related companies |
0 |
- |
- |
|
18. Profit after tax |
6,550,000,000
|
- |
3,036,197,688
|
|
|
||||
FINANCIAL RATIOS AND AVERAGE INDUSTRY RATIOS
|
||||
|
|
||||
|
Description |
FY2011 |
FY2010 |
FY2009 |
Average
Industry |
|
Current liquidity ratio |
0.97 |
1.03 |
1.09 |
1.21 |
|
Quick liquidity ratio |
0.27 |
0.31 |
0.66 |
0.57 |
|
Inventory circle |
4.68 |
- |
5.23 |
4.48 |
|
Average receive period |
1.37 |
- |
19.00 |
55.27 |
|
Utilizing asset performance |
2.25 |
- |
1.72 |
1.24 |
|
Liability by total assets |
75.92 |
74.74 |
83.51 |
62.56 |
|
Liability by owner's equity |
315.21 |
295.82 |
506.48 |
255.09 |
|
Ebit / Total assets (ROA) |
7.04 |
- |
5.64 |
10.05 |
|
Ebit / Owner's equity (ROE) |
29.22 |
- |
34.21 |
36.71 |
|
Ebit / Total revenue (NPM) |
3.12 |
- |
3.24 |
8.86 |
|
Gross profit / Total revenue (GPM) |
6.12 |
- |
9.97 |
13.96 |
|
Note: The Average Industry was calculated by VietnamCredit
based on our own statistical data |
||||
|
|
||||
PAYMENT HISTORY &
PERFORMANCE EXPERIENCES
|
||
|
|
||
|
Trade Morality |
|
Fair |
|
Liquidity |
|
Medium |
|
Payment status |
|
Average |
|
Financial Situation |
|
Above Average |
|
Development trend |
|
Stable |
|
Litigation data |
|
No Record |
|
Bankruptcy |
|
No Record |
|
Payment Methods |
|
L/C, T/T, D/P |
|
Sale Methods |
|
To contracts |
|
Public opinion |
|
Well-known |
|
|
INTERPRETATION ON THE SCORES
|
|
|
|
The subject was originally established in 1920 as a small silk factory.
When Vietnam gained the independence in 1975, it operated under name “Nam
Dinh Silk Textile Company” as a state owned enterprise. The subject has
changed its legal form into Joint Stock Company since 2003 and its name also
changed to name “Nam Dinh Silk Textile Joint Stock Company” according to the
Business Registration No. 0703000953 with chartered capital is VND 11,500
million. Currently, the subject is operating under the business registration
No. 0600016097 which is the same with its tax code. The company’s chartered
capital also increased to VND 18.5 billion. Vietnam National Textile and
Garment Group still hold 10% of its chartered capital. The head office of the subject is located at No. 4, Ha Huy Tap Street,
Nam Dinh City, Nam Dinh Province. At this address, it has three mills
factories including: fiber mill, textile mill and dyeing mill. Besides, it
has also on branch at Hanoi City and one branch in Thanh Hoa province. The subject is specializing in manufacturing and trading in many kinds
of fiber and fabric. Its annual productivity of the subject is fairly high.
The company imports cotton and raw fiber from Asia market (Korea, Japan,
Singapore, Thailand, Indonesia) and some European countries…, imports
machine, equipments from USA, EU. Its products are fairly good and
diversified. Its products are distributed in domestic market and for export.
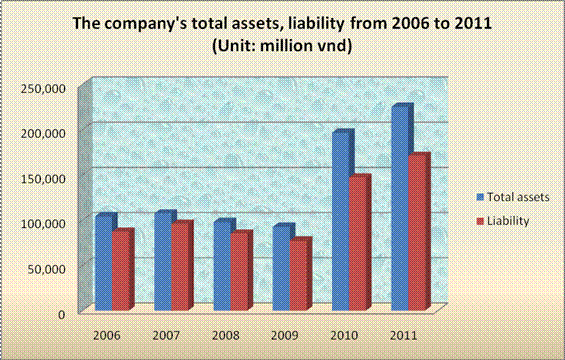
Its main export market is Japan. The company’s financial situation is considered above average.
Following is the chart showing the company’s total assets and liability
through years:
According to the chart above, the company total assets had
downturn from 2006 to 2009. The company’s total assets in 2009 were VND 92.7
billion; decreased 11.1% compared to 2006. However, the company’s total
assets increased quickly again in 2010. The total assets in 2010 were VND
196.9 billion; increased 112.3% compared to 2009. This number was increased
to VND 225.3 billion in 2011; went up 14.5% compared to 2010. According to
the chart above, the company’s assets was financed largely by liability.
Liabilities by total assets from 2006 to 2011 were always above 70%. However,
the ratio of Liabilities by total assets in recent years had downturn. The
subject is less depends on the external financial resources. That is the good
sign for the development of the subject. On the side of profitability, the business result of the subject in
recent years is quite good. The company’s total sales in 2011 were VND 507.7 billion;
more than three times higher than 2009. Profit after tax also increased from
VND 3.0 billion in 2009 to VND 6.6 billion in 2011. Profitability is
considered fairly well. In general, the subject has operated for a long time in this field. Its
development growth speed seems not high but fairly stable. Now, the subject
has capacity to meet small and normal financial commitments. |
------------ APPENDIX
1 ----------
|
INDUSTRY
DATA |
||||||
|
|
||||||
|
Industry
code |
GDP growth
speed by price compared with 1994 (%) |
Total
enterprises 2010 |
Total
employees 2011 (Thous.pers.) |
Annual
average capital of enterprises 2010 (billion dongs) |
||
|
2012 |
2011 |
|||||
|
Agriculture,
Forestry and Fishing |
2.72 |
4.00 |
8,887 |
24,362.9 |
95,227 |
|
|
Industry
and Construction |
4.52 |
5.53 |
95,217 |
10,718.9 |
3,641,376 |
|
|
Trade
and Services |
6.42 |
6.69 |
187,195 |
15,270.2 |
6,957,082 |
|
|
|
||||||
|
ECONOMIC
INDICATORS |
||||||
|
|
||||||
|
|
2012 |
2011 |
2010 |
|||
|
Population (Million
person) |
88.78 |
87.84 |
86.93 |
|||
|
Gross Domestic
Products (USD billion) |
136 |
119 |
102.2 |
|||
|
GDP Growth (%) |
5.03 |
5.89 |
6.78 |
|||
|
GDP Per Capita
(USD/person/year) |
1,540 |
1,300 |
1,160 |
|||
|
Inflation (% Change
in Composite CPI) |
9.21 |
18.58 |
11.75 |
|||
|
State Budget
Deficit compared with GDP (%) |
4.8 |
4.9 |
5.8 |
|||
|
|
||||||
|
SERVICE
TRADE PERFORMANCE |
||||||
|
|
||||||
|
Billion USD |
2012 |
2011 |
2010 |
|||
|
Exports |
114.6 |
96.3 |
72.2 |
|||
|
Imports |
114.3 |
105.8 |
84.8 |
|||
|
Trade Balance |
0.3 |
-9.5 |
-12.6 |
|||
Source: General
Statistics Office
FOREIGN EXCHANGE RATES
|
Currency |
Unit
|
Indian
Rupees |
|
US Dollar |
1 |
Rs.58.45 |
|
UK Pound |
1 |
Rs.91.59 |
|
Euro |
1 |
Rs.77.91 |
INFORMATION DETAILS
|
Report
Prepared by : |
NLM |
RATING EXPLANATIONS
|
RATING |
STATUS |
PROPOSED CREDIT LINE |
|
|
>86 |
Aaa |
Possesses an extremely sound financial base with the strongest
capability for timely payment of interest and principal sums |
Unlimited |
|
71-85 |
Aa |
Possesses adequate working capital. No caution needed for
credit transaction. It has above average (strong) capability for payment of interest
and principal sums |
Large |
|
56-70 |
A |
Financial & operational base are regarded healthy.
General unfavourable factors will not cause fatal effect. Satisfactory
capability for payment of interest and principal sums |
Fairly
Large |
|
41-55 |
Ba |
Overall operation is considered normal. Capable to meet
normal commitments. |
Satisfactory |
|
26-40 |
B |
Capability to overcome financial difficulties seems
comparatively below average. |
Small |
|
11-25 |
Ca |
Adverse factors are apparent. Repayment of interest and
principal sums in default or expected to be in default upon maturity |
Limited
with full security |
|
<10 |
C |
Absolute credit risk exists. Caution needed to be
exercised |
Credit
not recommended |
|
-- |
NB |
New
Business |
-- |
This score serves as a reference
to assess SC’s credit risk and to set the amount of credit to be extended. It
is calculated from a composite of weighted scores obtained from each of the
major sections of this report. The assessed factors and their relative weights
(as indicated through %) are as follows:
Financial
condition (40%) Ownership
background (20%) Payment
record (10%)
Credit
history (10%) Market
trend (10%) Operational
size (10%)
This report is issued at your request without any risk
and responsibility on the part of MIRA INFORM PRIVATE LIMITED (MIPL) or its
officials.