MIRA
INFORM REPORT
|
Report Date : |
20.06.2013 |
IDENTIFICATION DETAILS
|
Name : |
ENC NATURSTEN
APS |
|
|
|
|
Registered Office : |
Englandsvej 15700
Svendborg |
|
|
|
|
Country : |
Denmark |
|
|
|
|
Financials (as on) : |
2012 |
|
|
|
|
Date of Incorporation : |
09.10.1996 |
|
|
|
|
Com. Reg. No.: |
19401782 |
|
|
|
|
Legal Form : |
Private limited company
- ApS |
|
|
|
|
Line of Business : |
Wholesale of wood, construction
materials and sanitary equipment |
|
|
|
|
No. of Employees : |
Not Available |
RATING & COMMENTS
|
MIRA’s Rating : |
Ba |
|
RATING |
STATUS |
PROPOSED CREDIT LINE |
|
|
41-55 |
Ba |
Overall operation is considered normal. Capable to meet normal
commitments. |
Satisfactory |
|
Status : |
Satisfactory |
|
|
|
|
Payment Behaviour : |
No Complaints |
|
|
|
|
Litigation : |
Clear |
NOTES:
Any query related to this report can be made
on e-mail: infodept@mirainform.com
while quoting report number, name and date.
ECGC Country Risk Classification List – March, 31st, 2013
|
Country Name |
Previous Rating (31.12.2012) |
Current Rating (31.03.2013) |
|
Denmark |
A2 |
A2 |
|
Risk Category |
ECGC
Classification |
|
Insignificant |
A1 |
|
Low |
A2 |
|
Moderate |
B1 |
|
High |
B2 |
|
Very High |
C1 |
|
Restricted |
C2 |
|
Off-credit |
D |
denmark - ECONOMIC OVERVIEW
This thoroughly modern market economy features a high-tech
agricultural sector, state-of-the-art industry with world-leading firms in
pharmaceuticals, maritime shipping and renewable energy, and a high dependence
on foreign trade. Denmark is a member of the European Union (EU); Danish
legislation and regulations conform to EU standards on almost all issues. Danes
enjoy a high standard of living and the Danish economy is characterized by
extensive government welfare measures and an equitable distribution of income.
Denmark is a net exporter of food and energy and enjoys a comfortable balance
of payments surplus but depends on imports of raw materials for the
manufacturing sector. Within the EU, Denmark is among the strongest supporters
of trade liberalization. After a long consumption-driven upswing, Denmark''s
economy began slowing in 2007 with the end of a housing boom. Housing prices
dropped markedly in 2008-09 and, following a short respite in 2010, has since
continued to decline. The global financial crisis has exacerbated this cyclical
slowdown through increased borrowing costs and lower export demand, consumer
confidence, and investment. The global financial crisis cut Danish real GDP in
2008-09. Denmark made a modest recovery in 2010 with real GDP growth of 1.3%,
in part because of increased government spending; however, the country
experienced a technical recession in late 2010-early 2011. Historically low
levels of unemployment rose sharply with the recession and have remained at
about 6% in 2010-12, based on the national measure, about two-thirds average EU
unemployment. An impending decline in the ratio of workers to retirees will be
a major long-term issue. Denmark maintained a healthy budget surplus for many
years up to 2008, but the budget balance swung into deficit in 2009. In spite
of the deficits, the new coalition government delivered a modest stimulus to
the economy in 2012. Nonetheless, Denmark''s fiscal position remains among the
strongest in the EU with public debt at about 45% of GDP in 2012. Despite
previously meeting the criteria to join the European Economic and Monetary
Union (EMU), so far Denmark has decided not to join, although the Danish krone
remains pegged to the euro. Denmark held the EU presidency during the first
half of 2012; priorities included promoting a responsible, dynamic, green, and
safe Europe, while working to steer Europe out of its euro zone economic
crisis.
|
Source
: CIA |
Summary
Company name ENC NATURSTEN
APS
Operative address ENGLANDSVEJ 1
5700 SVENDBORG
Denmark
Legal
form Private limited company
- ApS
Registration
number Trade register number:
19401782
VAT-number DK19 40 17 82
![]() Year 2012 Mutation 2011 Mutation 2010
Year 2012 Mutation 2011 Mutation 2010
Fixed assets 72.430 -14,85 85.062 -35,25 131.375
![]() Total receivables 255.786 14,25 223.875 -37,96 360.845
Total receivables 255.786 14,25 223.875 -37,96 360.845
![]() Total equity 435.789 -4,65 457.023 15,14 396.943
Total equity 435.789 -4,65 457.023 15,14 396.943
Short term
liabilities 829.328 -13,94 963.632 -8,49 1.053.014
![]() Net result -20.522 -134,40 59.664 1.546,81 3.623
Net result -20.522 -134,40 59.664 1.546,81 3.623
![]() W orking capital 365.505 -2,30 374.111 38,77 269.594
W orking capital 365.505 -2,30 374.111 38,77 269.594
Quick ratio 0,31 29,17 0,24
Contact information
Company
name ENC
NATURSTEN APS
Operative
address ENGLANDSVEJ 1
5700 SVENDBORG Denmark
Correspondence address ENGLANDSVEJ 1
5700 SVENDBORG Denmark
Telephone number +45
70102103
Fax number +45
70102113
Registration
Registration
number Trade register number:
19401782
Trade register number:
19401782
VAT-number DK19 40 17 82
Status Active
Establishment date 1996-10-09
Legal form Private limited company - ApS
Subscribed share capital DKK
125.000
Activities
NACE Wholesale of wood, construction materials and sanitary equipment (4673)
Relations
Shareholders ULTIMATE GLOBAL SHAREHOLDER Name: HGM HOLDING APS
National id number:
25700074
Address: Bratenvej 10
Zipcode: 5700
City: SVENDBORG Country:
DK
Phone: +45 62225264
FAX: +45 62225274
Type: Industrial company
Share direct: 100.00% Share TOTAL: 100.00%
TOTAL assets: 3.64 mil.
EUR
Profit loss
before tax: -0.0435
mil. EUR
Profit loss
after tax net
income:
-0.0774 mil.
EUR
Shareholders funds: 3.3621 mil.
EUR
SHAREHOLDERS
Name: HGM HOLDING APS National id number:
25700074
Address: Bratenvej 10
Zipcode: 5700
City: SVENDBORG Country:
DK
Phone: +45 62225264
FAX: +45 62225274
Type: Industrial company
Share direct:
100.00%
TOTAL assets: 3.64 mil.
EUR
Profit loss
before tax: -0.0435
mil. EUR
Profit loss
after tax net
income:
-0.0774 mil.
EUR
Shareholders funds: 3.3621 mil.
EUR
Number of employees: 0
Bank details
Accounts Danske Bank
Management
Management Fullname: Mrs. Charlotte Gravholt
Faurhoj
Type: Individual Gender:
Female
Address: Denmark
Number of involvements:
2
Function: General Manager
Level of responsibility:
Highest
executive
Appointment
date: 2011/05/24
Fullname: Mr. Henrik Gronning Madsen
Type: Individual
Gender:
Male
Country of nationality:
Denmark
Address: Denmark
Number of involvements:
7
Function: General Manager
Level of responsibility:
Highest
executive
Appointment
date: 2004/03/08
Financial analysis
Trend Fluctuating
Profitability Negative
Solvability Sufficient
Liquidity Sufficient
Show amount in Euro
 Key figures
|
Year |
2012 |
2011 |
2010 |
2009 |
2008 |
|
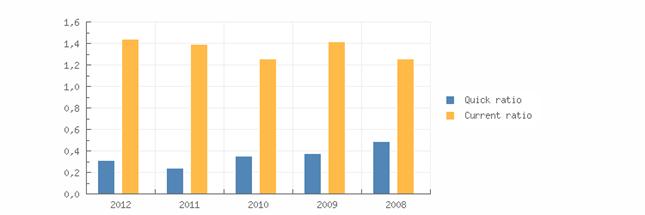
Quick ratio |
0,31 |
0,24 |
0,35 |
0,38 |
0,49 |
|
Current ratio |
1,44 |
1,39 |
1,26 |
1,42 |
1,26 |
|
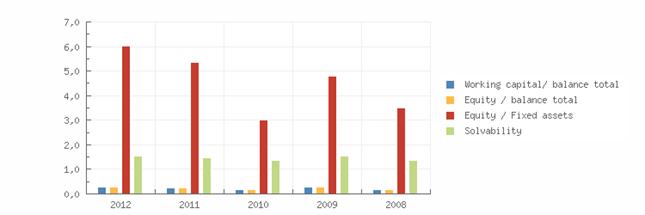
W orking capital/
balance total |
0,29 |
0,26 |
0,19 |
0,27 |
0,19 |
|
Equity / balance total |
0,29 |
0,26 |
0,19 |
0,27 |
0,19 |
|
Equity / Fixed assets |
6,02 |
5,37 |
3,02 |
4,78 |
3,50 |
|
Solvability |
1,53 |
1,48 |
1,38 |
1,53 |
1,37 |
|
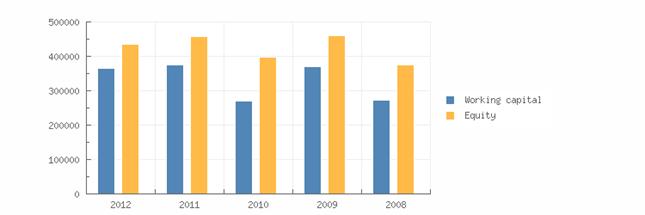
W orking capital |
365.505 |
374.111 |
269.594 |
368.870 |
271.807 |
|
Equity |
435.789 |
457.023 |
396.943 |
460.752 |
374.607 |
|
Mutation equity |
-4,65 |
15,14 |
-13,85 |
23,00 |
|
|
Mutation short term
liabilities |
-13,94 |
-8,49 |
19,86 |
-14,63 |
|
|
Return on total assets (ROA) |
-2,11 |
5,70 |
0,36 |
10,66 |
11,79 |
|
Return on equity
(ROE) |
-6,12 |
17,76 |
1,32 |
31,08 |
44,29 |
|
Gross margin |
389.246 |
446.541 |
385.939 |
537.588 |
378.091 |
|
Operating result |
-4.963 |
106.697 |
33.012 |
177.316 |
184.020 |
|
Net result after taxes |
-20.522 |
59.664 |
3.623 |
105.583 |
121.697 |
|
Cashflow |
-939 |
85.868 |
28.449 |
128.957 |
137.780 |
|
EBITDA |
14.620 |
132.901 |
57.837 |
200.689 |
200.103 |
Summary The 2012 financial result
structure
is
a positive working capital of
365.505 euro, which is in agreement with 29 % of the total assets of the company.
The working capital has diminished with -2.3 % compared to previous
year. The ratio,
with respect to the total assets of the company
has
however,
increased.
The deterioration between 2011 and
2012 has mainly
been
caused by a reduction of the current
assets.
The current ratio of the company in 2012 was
1.44. When the current
ratio is
below
1.5, the company may have
problems meeting its short-term
obligations.
The quick
ratio in 2012 of the company was
0.31. A company
with a Quick
Ratio of less
than 1 cannot currently pay back
its current
liabilities.
The 2011 financial result
structure
is
a positive working capital of 374.111
euro,
which
is in agreement with 26 % of the total assets
of the company.
The working capital has increased with 38.77 % compared to previous
year. The ratio,
with respect to the total assets of the company
has
however,
increased.
The improvement
between 2010 and
2011 has mainly
been
caused by an increase of
the
current assets.
The current
ratio of the company in 2011 was
1.39. When the current
ratio is
below
1.5, the company may have
problems meeting its short-term
obligations.
The quick
ratio in 2011 of the company was
0.24. A company
with a Quick
Ratio of less
than 1 cannot currently pay back
its current
liabilities.
Financial statement
Auditor Name:
Lilly Jeppesen
Last annual account 2012
Remark annual account The company
is
obliged to file its
financial statements.
Type of annual
account Corporate
Annual account ENC NATURSTEN APS
ENGLANDSVEJ 1
5700 SVENDBORG Denmark
 Balance
|
Year End date |
2012 1970-01-01 |
2011 1970-01-01 |
2010 1970-01-01 |
2009 1970-01-01 |
2008 1970-01-01 |
|
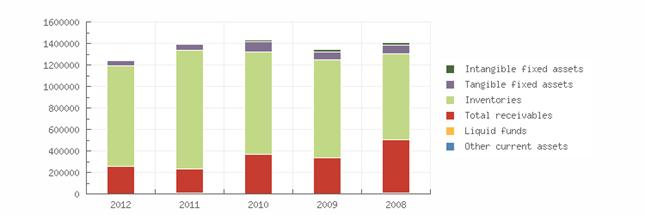
Intangible fixed assets |
4.024 |
9.407 |
14.761 |
20.149 |
25.465 |
|
Tangible fixed
assets |
47.080 |
55.499 |
96.485 |
76.165 |
81.489 |
|
Other fixed assets |
21.327 |
20.157 |
20.129 |
|
|
|
Fixed assets |
72.430 |
85.062 |
131.375 |
96.315 |
106.954 |
|
Inventories |
936.229 |
1.102.445 |
958.005 |
911.294 |
797.999 |
|
Total receivables |
255.786 |
223.875 |
360.845 |
333.004 |
498.046 |
|
Liquid funds |
2.548 |
|
|
269 |
2.412 |
|
Other current assets |
268 |
11.422 |
3.757 |
2.821 |
2.412 |
|
Current assets |
1.194.833 |
1.337.743 |
1.322.608 |
1.247.388 |
1.300.870 |
|
Total assets |
1.267.263 |
1.422.805 |
1.453.983 |
1.343.702 |
1.407.824 |
|
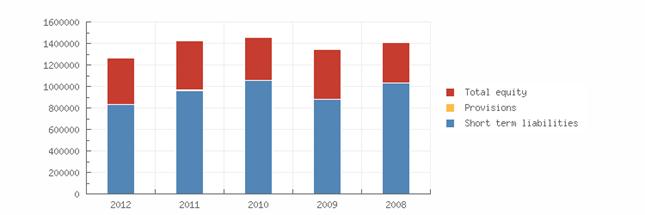
Total equity |
435.789 |
457.023 |
396.943 |
460.752 |
374.607 |
|
Provisions |
2.146 |
2.150 |
3.892 |
4.299 |
4.155 |
|
Accounts payable |
123.132 |
111.400 |
131.375 |
96.315 |
101.593 |
|
Short term liabilities |
829.328 |
963.632 |
1.053.014 |
878.518 |
1.029.063 |
|
Total liabilities |
1.267.263 |
1.422.805 |
1.453.983 |
1.343.702 |
1.407.824 |
Summary 126726200 % by current
assets. The assets are being
financed by an equity of
126726300 %, and total debt
of -126726200 %.
The total assets
of the company decreased with -2.14 % between 2010 and
2011.
This downturn is
mainly retrievable in the fixed asset decrease of -35.25
%.
In 2011 the assets
of the company were 142280500 % composed of fixed assets
and
-
142280400 % by current assets. The assets
are
being financed by an equity of 142280500 %, and total debt
of -142280400 %.
Profit and loss
|
Year |
2012 |
2011 |
2010 |
2009 |
2008 |
|
Gross margin |
389.246 |
446.541 |
385.939 |
537.588 |
378.091 |
|
W ages and salaries |
374.760 |
313.775 |
328.236 |
336.899 |
177.988 |
|
Amorization and depreciation |
19.583 |
26.204 |
24.826 |
23.373 |
16.083 |
|
Operating expenses |
394.209 |
339.845 |
352.928 |
360.273 |
194.072 |
|
Operating result |
-4.963 |
106.697 |
33.012 |
177.316 |
184.020 |
|
Financial income |
16.632 |
17.066 |
8.186 |
8.463 |
2.547 |
|
Financial expenses |
38.227 |
42.464 |
36.098 |
42.583 |
20.640 |
|
Financial result |
-21.595 |
-25.398 |
-27.912 |
-34.120 |
-18.094 |
|
Result on
ordinary operations before taxes |
-26.692 |
81.165 |
5.234 |
143.196 |
165.926 |
|
Taxation on the result of
ordinary activities |
-6.170 |
21.501 |
1.610 |
37.612 |
44.229 |
|
Result of ordinary activities after taxes |
-20.522 |
59.664 |
3.623 |
105.583 |
121.697 |
|
Net result |
-20.522 |
59.664 |
3.623 |
105.583 |
121.697 |
Summary The gross profit
of the company decreased by -12.83
% between 2011 and 2012.
The operating result
of the company declined with -104.65 % between 2011 and
2012.
This evolution implies an decrease of the company's economic profitability.
The result
of these changes is
a reduction of the company's Economic
Profitability
of -
137.02 % of the analysed period, being
equal to 2011 % in the year 2012.
The Net Result of the company
increased by -134.4 % between 2011 and
2012.
The company's Financial Profitability
has
been
positively affected by the financial activities
in comparison to the EBITs behaviour.
The result of these variations is a profitability
increase of -134.46 % of the analysed period, being
-6.12 % in the year
2012.
The company's financial profitability
has
been
positively affected by its
financial
structure.
The gross
profit of the company
grew with 15.7 % between 2010 and 2011.
The operating result
of the company grew
with 223.21 % between 2010 and
2011.
This evolution implies an increase of the company's economic profitability.
The result
of these changes is
an increase of the company's Economic Profitability of
1483.33 % of the analysed period, being
equal to 2010 % in the year 2011.
The Net Result of the company
decreased by 1546.72 % between 2010 and
2011.
The
company's Financial Profitability has been negatively affected by the financial activities
in comparison to the EBITs behaviour.
The result of these variations is a profitability
reduction of 1245.45
% of the analysed period,
being 17.76
% in the year
2011.
The company's financial structure has slowed down its financial profitability.

Publications
Remarks Status: Active
Category:
Small company
Last year:
2012
Result last
year: -20.522
EUR
TOTAL assets
last year:
1.267.263 EUR Number of shareholders:
1
Number of subsidiaries: 0
Number of branches: 0
FOREIGN EXCHANGE RATES
|
Currency |
Unit
|
Indian Rupees |
|
US Dollar |
1 |
Rs.58.74 |
|
|
1 |
Rs.91.99 |
|
Euro |
1 |
Rs.78.70 |
INFORMATION DETAILS
|
Report Prepared
by : |
SDA |
RATING EXPLANATIONS
|
RATING |
STATUS |
PROPOSED CREDIT LINE |
|
|
>86 |
Aaa |
Possesses an extremely sound financial base with the strongest
capability for timely payment of interest and principal sums |
Unlimited |
|
71-85 |
Aa |
Possesses adequate working capital. No caution needed for credit
transaction. It has above average (strong) capability for payment of interest
and principal sums |
Large |
|
56-70 |
A |
Financial & operational base are regarded healthy. General
unfavourable factors will not cause fatal effect. Satisfactory capability for
payment of interest and principal sums |
Fairly Large |
|
41-55 |
Ba |
Overall operation is considered normal. Capable to meet normal
commitments. |
Satisfactory |
|
26-40 |
B |
Capability to overcome financial difficulties seems comparatively
below average. |
Small |
|
11-25 |
Ca |
Adverse factors are apparent. Repayment of interest and principal sums
in default or expected to be in default upon maturity |
Limited with
full security |
|
<10 |
C |
Absolute credit risk exists. Caution needed to be exercised |
Credit not
recommended |
|
---- |
NB |
New Business |
---- |
This score serves as a reference to assess SC’s credit risk
and to set the amount of credit to be extended. It is calculated from a
composite of weighted scores obtained from each of the major sections of this
report. The assessed factors and their relative weights (as indicated through
%) are as follows:
Financial
condition (40%) Ownership
background (20%) Payment
record (10%)
Credit history
(10%) Market trend
(10%) Operational
size (10%)
This report is issued at your request without any
risk and responsibility on the part of MIRA INFORM PRIVATE LIMITED (MIPL)
or its officials.