MIRA
INFORM REPORT
|
Report Date : |
21.06.2013 |
IDENTIFICATION DETAILS
|
Name : |
STP & I PUBLIC COMPANY LIMITED |
|
|
|
|
Registered Office : |
3rd Floor, |
|
|
|
|
Country : |
|
|
|
|
|
Financials (as on) : |
31.12.2012 |
|
|
|
|
Date of Incorporation : |
28.01.1975 |
|
|
|
|
Com. Reg. No.: |
0107538000452 [Former :
BOR.MOR.JOR.568] |
|
|
|
|
Legal Form : |
Public Limited Company |
|
|
|
|
Line of Business : |
Engineering, Fabrication and Construction Contractor
|
|
|
|
|
No. of Employees : |
2,640 |
RATING & COMMENTS
|
MIRA’s Rating : |
Ba |
|
RATING |
STATUS |
PROPOSED CREDIT LINE |
|
|
41-55 |
Ba |
Overall operation is considered normal. Capable to meet normal
commitments. |
Satisfactory |
|
Status : |
Good |
|
Payment Behaviour : |
No Complaints |
|
Litigation : |
Clear |
NOTES:
Any query related to this report can be made
on e-mail: infodept@mirainform.com
while quoting report number, name and date.
ECGC Country Risk Classification List – March, 31st, 2013
|
Country Name |
Previous Rating (31.12.2012) |
Current Rating (31.03.2013) |
|
Thailand |
B1 |
B1 |
|
Risk Category |
ECGC
Classification |
|
Insignificant |
A1 |
|
Low |
A2 |
|
Moderate |
B1 |
|
High |
B2 |
|
Very High |
C1 |
|
Restricted |
C2 |
|
Off-credit |
D |
thailand - ECONOMIC OVERVIEW
With a well-developed infrastructure, a free-enterprise
economy, generally pro-investment policies, and strong export industries, Thailand
achieved steady growth due largely to industrial and agriculture exports -
mostly electronics, agricultural commodities, automobiles and parts, and
processed foods. Thailand is trying to maintain growth by encouraging domestic
consumption and public investment to offset weak exports in 2012. Unemployment,
at less than 1% of the labor force, stands as one of the lowest levels in the
world, which puts upward pressure on wages in some industries. Thailand also
attracts nearly 2.5 million migrant workers from neighboring countries. The
Thai government is implementing a nation-wide 300 baht ($10) per day minimum
wage policy and deploying new tax reforms designed to lower rates on
middle-income earners. The Thai economy has weathered internal and external
economic shocks in recent years. The global economic severely cut Thailand''s
exports, with most sectors experiencing double-digit drops. In 2009, the
economy contracted 2.3%. However, in 2010, Thailand''s economy expanded 7.8%,
its fastest pace since 1995, as exports rebounded. In late 2011 growth was
interrupted by historic flooding in the industrial areas in Bangkok and its
five surrounding provinces, crippling the manufacturing sector. Industry
recovered from the second quarter of 2012 onward with GDP growth at 5.5% in
2012. The government has approved flood mitigation projects worth $11.7
billion, which were started in 2012, to prevent similar economic damage, and an
additional $75 billion for infrastructure over the next seven years with a plan
to start in 2013.
|
Source
: CIA |
Company name
STP & I PUBLIC COMPANY LIMITED
SUMMARY
BUSINESS ADDRESS : 3rd
FLOOR, SINO-THAI TOWER,
32/24
SUKHUMVIT 21 ROAD [ASOKE], KLONGTOEY
NUA, WATTANA, BANGKOK
10110, THAILAND
TELEPHONE :
[66] 2260-1181
FAX : [66] 2260-1182
E-MAIL ADDRESS : contact@stpi.co.th
REGISTRATION ADDRESS : SAME AS BUSINESS
ADDRESS
ESTABLISHED : 1975
REGISTRATION NO. : 0107538000452 [Former
: BOR.MOR.JOR.568]
TAX ID NO. : 3101013207
CAPITAL REGISTERED : BHT. 371,000,000
CAPITAL PAID-UP : BHT.
369,360,995
FISCAL YEAR CLOSING DATE : DECEMBER 31
LEGAL STATUS : PUBLIC LIMITED
COMPANY
EXECUTIVE : MR. MASTHAWIN
CHARNVIRAKUL, THAI
MANAGING DIRECTOR
NO. OF STAFF : 2,640
LINES OF BUSINESS : ENGINEERING, FABRICATION
AND
CONSTRUCTION CONTRACTOR
CORPORATE PROFILE
OPERATING TREND : STABLE
PRESENT SITUATION : OPERATING NORMALLY
REPUTATION : GOOD
WITH NORMAL BUSINESS
ENGAGEMENT
MANAGEMENT STANDARD : MANAGING WITH
GOOD PERFORMANCE
HISTORY
The subject was
established on January
28, 1975 as
a private limited
company under the
registered name “Sino-Thai Pressure
Vessel Co., Ltd.” with
the aim of
being a manufacturer
of boilers.
On April 12, 1989, its
name was changed
to “Sino-Thai Pressure
Vessel and Iron
Works Co., Ltd.” [STP
& I]. In
1990, the subject
has expanded its
business to steel
fabrication work with
a total capacity
of 20,000 tons/year.
In 1994, the
subject moved to
new workshop located
on 89,600 square
meters of area
in Chonburi Province
with a total
capacity of 30,000
tons/year, with state
of the art
equipment.
On September 1,
1995 the subject
changed its name
and status to
a public limited
company, namely STP
& I PUBLIC
COMPANY LIMITED, as
well as listing
on the Stock
Exchange of Thailand
on May 14,
1996.
Presently, its core business
is engaged in
steel structure fabrication,
piping fabrication, process
module and other steel
fabrication. It currently employs
2,640 staff.
Its production process
was qualified under
the world leading
standard, namely:
- ISO 9001 : 2008
- API [American
Society of Mechanical
Engineers]
- JSCA [Japan
Steel Constructions Association]
- Class H
The subject’s registered
address was initially
located at 69
Moo 3, Bangna-Trad
Rd., K.M. 53.5,
T. Klong-tum-ru, A.
Muang, Cholburi 20000.
Later, it was
moved to 26th Floor,
Sino-Thai Tower, 32/56
Asoke Rd., Klongtoey
Nua, Wattana, Bangkok
10110,
Presently, its registered
address is 3rd Floor,
Sino-Thai Tower, 32/24
Sukhumvit 21 Road
[Asoke], Klongtoey Nua, Wattana,
Bangkok 10110, and
this is the
company’s current operation
address.
THE BOARD OF DIRECTORS
|
Name |
|
Nationality |
Age |
|
|
|
|
|
|
Mr. Masthawin Charnvirakul |
[x] |
Thai |
42 |
|
Pol. Gen. Jate Mongkolhutthi |
|
Thai |
60 |
|
Mr. Wicha Jiwalai |
|
Thai |
69 |
|
Mr. Chamni Janchai |
|
Thai |
57 |
|
Mr. Suwat Riensiriwan |
|
Thai |
59 |
|
Mr. Anutin Charnvirakul |
[x] |
Thai |
47 |
|
Mr. Choavalit Limpanich |
|
Thai |
53 |
|
Adm. Amorntep Na Bangchang |
|
Thai |
59 |
AUTHORIZED PERSON
One of the
mentioned directors [x] can
sign on behalf
of the subject
with the company’s
affixed.
MANAGEMENT
Mr. Masthawin Charnvirakul
is the Managing
Director.
He is Thai
nationality with the age
of 42 years
old.
Mr. Suwat Riensiriwan
is the Deputy
Managing Director 1.
He is Thai
nationality with the
age of 59
years old.
Mr. Choavalit Limpanich
is the Deputy
Managing Director 2.
He is Thai
nationality with the
age of 53
years old.
LT. JG. Kitti Junsangsri
is the Marketing & Estimation Department
Manager.
He is Thai
nationality.
Mr. Thammanoon Narind is
the Fabrication Plants
Department Manager
[Chonburi, Rayong and
Sriracha].
He is Thai
nationality.
Mr. Damrong Panket is
the Laemchabang Assembly
Yard Department Manager.
He is Thai
nationality.
Mrs. Anilrat Nitisaroj
is the Business
Development & Legal
Department Manager.
She is Thai
nationality.
Mrs. Atitaya Charnvirakul
is the Administrative Department
Manager.
She is Thai
nationality.
Ms. Prempha Hitaphan is
the Finance & Accounting Department
Manager.
She is Thai
nationality.
BUSINESS OPERATIONS
The subject’s core
business is engaged
in provide servicing
of three main
businesses as follows:
1. ENGINEERING SERVICE
a) Engineering Service:
STP & I
provides engineering service
in detail design
of steel-to-steel connection,
shop drawing for
steel structure, piping
and erection works
by various specialized
software.
b) Fabrication: STP
& I provides
fabrication service and
has capability to
fabricate steel and
pipe in workshop
which equipped with state
of art machine and
equipment, CNC cutting
and welding machine,
press machine, automatic
blasting machine and
other tools necessary
to undertake the
variety and complexity
of fabricated products
to ensure the
efficiency of fabrication
processes and cost
effective.
c) Construction: STP &
I’s construction works
include assembly, mechanical
equipment installation and
erection for various
manufacturing plants. STP
& I performs
the works both
at the company’s
facilities and at
the client’s project
site.
Its products can
be categorized into
4 groups:
1. Steel structure
fabrication
2. Piping fabrication
3. Process module
4. Other fabrication
steel
Its business has
been served to
industrial projects, such
as power plant,
refinery, high-rise building,
roof structure, bridge,
elevator, airport and
etc.
PRODUCTIONS
100,000-115,000 tons per
annum
PURCHASE
80% of raw
materials and equipments
for manufacturing are
purchased from local
suppliers, and the
remaining 20% are
imported from Japan,
Germany, United States
of America, United Kingdom, Taiwan,
Australia, Republic of
China, Korea, India,
and Singapore.
MAJOR SUPPLIERS
Mitsui & Co.,
Ltd. : Japan
Sahaviriya Plate Mill
Co., Ltd. : Thailand
LPN Plate Mill
Co., Ltd. :
Thailand
S.A. Petrotech Co.,
Ltd. : Thailand
Samchai Steel Co., Ltd. : Thailand
Udom Lohakij Co., Ltd. : Thailand
Siam Yamato Steel Co., Ltd. : Thailand
Thai Metal Import
Co., Ltd. : Thailand
EXPORT [COUNTRIES]
90% of the
products is exported
mainly to Japan,
Singapore, Korea, Republic
of China, Indonesia,
Germany, Malaysia, India,
Australia, Taiwan and
the countries in
Middle East.
SALES [LOCAL]
10% of products
is sold and
serviced locally to
various manufacturers, wholesalers,
end-user and Thai Government.
Its customers are
classified into two
groups: project owner and sub-contractor.
MAJOR CUSTOMERS
JGC Corporation
Kellogg Brown &
Root [KBR]
Chiyoda Corporation
Foster Wheeler International
Corporation
Woodside Burrup Pty
Bechtel International Inc.
Mitsubishi Heavy Industries
Taisei Corporation
Obayashi Corporation
Foster Wheeler Energy
Limited
JFE Engineering
SK Engineering and
Construction
Toyo Engineering Corporation
LNG Onshore, Australia
REVENUE STRUCTURE
[Company and
subsidiaries]
|
|
2012 |
2011 |
||
|
Income from |
[Million Baht] |
% |
[Million Baht] |
% |
|
|
|
|
|
|
|
Steel Structure Fabrication |
126.02 |
3.76 |
119.13 |
7.96 |
|
Piping Fabrication |
483.24 |
14.41 |
72.44 |
4.84 |
|
Process Module |
2,152.54 |
64.20 |
516.33 |
34.48 |
|
Other Fabrication Steel [by Company and subsidiaries] |
378.24 |
11.28 |
293.13 |
19.58 |
|
Other Income [by Company and subsidiaries] |
212.86 |
6.35 |
496.33 |
33.15 |
|
Total Income |
3,352.90 |
100.00 |
1,497.36 |
100.00 |
SUBSIDIARIES AND AFFILIATED
COMPANIES
|
Company |
Type of
Business |
% of
Investment |
|
STIT 2011 Co.,
Ltd. |
Sell & Rent of Construction
Equipment |
100.00 |
|
STIT Co., Ltd. |
Sell & Rent of Construction
Equipment |
100.00 |
|
LGR [Thailand] Co.,
Ltd. |
Holding Company |
100.00 |
CREDIT
Sales are by
cash or on
the credits term
of 30-60 days.
Local bills are
paid by cash
or on the
credits term of
30-60 days.
Imports are by
L/C at sight
or on the
credit term of 120
days and T/T
on the credit
term of 30
days.
Exports are against
L/C at sight
or on the
credit term of
120 days and
T/T.
BANKING
Bangkok Bank Public
Co., Ltd.
[Head Office
: 333 Silom
Rd., Silom, Bangrak,
Bangkok 10500]
Kasikornbank Public Co.,
Ltd.
[Head Office
: 1 Rajburana
Rd., Rajburana, Bangkok
10140]
Siam Commercial Bank
Public Co., Ltd.
[Head Office
: 9 Ratchadapisek
Rd., Ladyao, Jatujak,
Bangkok 10900]
The Hongkong &
Shanghai Banking Corp.
[Bangkok Branch
: 64 Silom
Rd., Silom, Bangrak,
Bangkok 10500]
Krung Thai Bank
Public Co., Ltd.
[Head Office
: 35 Sukhumvit
Rd., Klongtoey Nua,
Wattana, Bangkok 10110]
EMPLOYMENT
The subject employs
approximately 2,640 staff
comprising office staff,
engineers,
technicians and factory
workers.
LOCATION DETAILS
The premise is
owned for administrative office
at the heading
address. Premise is
located in a
prime commercial area.
Factory I [Area:
89,600 Square meters]
69 Moo 3, Bangna-Trad
Rd., T. Klongtumru,
A. Muang, Chonburi
20000.
Tel.: [66] 38
214-131-9 Fax: [66]
38 214-120, 213-547
Factory II [Area:
76,800 Square meters]
45/10
Moo 4, Banlang-Nongbon, T.
Nikom Pattana, A. Nikom
Pattana, Rayong 21180.
Tel.: [66] 38
897-120-30 Fax: [66]
38 897-140-1.
Factory III [Area:
81,600 Square meters]
389/34
Moo 4, T. Nongkham,
A. Sriracha, Chonburi 20280.
Factory IV [Area:
305,600 Square meters]
48/1
Moo 3, T. Thungsukhla, A. Sriracha,
Chonburi 20230.
COMMENT
In the year
2012 the company has been awarded
the module assembly
project for LNG
Onshore Facilities which
to date, accounts
for the largest
project the company
has ever undertaken.
The prefabrication of the modular
components will be
fabricated and assembled
in Thailand before
being shipped to
Australia for final
installation in the
LNG Onshore Facilities.
With the project
worth US$739 million,
the company has
gained the highest
volume of workload
in its history,
thus, driving a continued
growth of the
company for the
next three years.
The company’s performance
in 2012 has
improved significantly from the
year 2011 both
in terms of
increasing workload and
higher profit. Furthermore, the
company has continuously
maintained its operation
without any Lost
Time Incidents from previous
years.
FINANCIAL INFORMATION
The capital was
initially registered at
Bht. 2,000,000, divided
into 20,000 shares
of Bht. 100
each.
The capital was
increased later as
followings:
Bht. 3,000,000 on
March 3, 1975
Bht. 8,000,000 on
May 6, 1985
Bht. 30,000,000 on
April 12, 1989
Bht. 150,000,000 on
August 14, 1990
Bht. 175,000,000 on
March 31, 1995
Bht. 371,000,000 on
December 3, 2010
The latest registered
capital was at
Bht. 371,000,000 divided
into 371,000,000 shares
of Bht. 1 each,
with the current
capital paid-up at
Bht. 369,360,995.
MAIN SHAREHOLDERS
[as at March
21, 2013] at
Bht. 368,492,092 of
capitalization
|
NAME |
HOLDING |
% |
|
|
|
|
|
Mr. Anutin Charnvirakul |
37,406,883 |
10.15 |
|
Thai NVDR Co.,
Ltd. |
21,697,620 |
5.89 |
|
Best Quality Skills
Co., Ltd. |
17,700,000 |
4.80 |
|
Mr. Suthep Sethboonsrang |
17,037,083 |
4.62 |
|
Equity Plus Co.,
Ltd. |
16,000,000 |
4.34 |
|
Mr. Choavalit Limpanich |
14,749,999 |
4.00 |
|
Mr. Yanyong Nitisaroch |
14,264,892 |
3.87 |
|
Mr. Jirat Tarapetchsawad |
12,846,136 |
3.49 |
|
Mr. Chavarat Charnvirakul |
10,362,639 |
2.81 |
|
Ms. Sureerat Techakamolsuk |
9,400,000 |
2.55 |
|
Mrs. Patthira Tarapetchsawad |
9,021,701 |
2.45 |
|
Others |
188,005,139 |
51.03 |
Total Shareholders :
3,100
NAME OF AUDITOR & CERTIFIED
PUBLIC ACCOUNTANT NO.
Mr. Krisada Lertvana No.
4958
BALANCE SHEET [BAHT]
The latest financial
figures published for
December 31, 2012,
2011 & 2010
were:
ASSETS
|
Current Assets |
2012 |
2011 |
2010 |
|
|
|
|
|
|
Cash and Cash Equivalents |
315,453,361 |
54,317,925 |
57,463,018 |
|
Short-term Investment |
3,396,636,709 |
1,332,094,009 |
1,602,863,020 |
|
Trade Accounts and Other
Receivable |
551,445,416 |
61,046,188 |
133,172,781 |
|
Undue Income |
372,518,730 |
71,763,738 |
604,072 |
|
Work Guarantee |
- |
17,555,774 |
98,948,396 |
|
Inventories |
24,661,092 |
31,116,031 |
54,552,821 |
|
Other Current Assets
|
42,993,921 |
13,311,898 |
35,141,017 |
|
|
|
|
|
|
Total Current Assets
|
4,703,709,229 |
1,581,205,563 |
1,982,745,125 |
|
Cash at Bank
pledged as a
Collateral |
23,882,970 |
24,579,969 |
55,274,489 |
|
Long-term Lending to Subsidiaries |
50,000,000 |
- |
- |
|
Investment in Subsidiaries |
135,000,000 |
135,000,000 |
135,000,000 |
|
Other Long-term Investment |
540,650,357 |
642,452,287 |
841,074,420 |
|
Real Estate for Investment |
29,498,000 |
- |
- |
|
Fixed Assets |
1,360,138,206 |
981,375,171 |
1,125,337,760 |
|
Intangible Assets |
6,414,817 |
5,966,595 |
5,841,375 |
|
Other Non-current Assets |
19,173,334 |
26,542,038 |
15,545,807 |
|
Total Assets |
6,868,466,913 |
3,397,121,623 |
4,160,818,976 |
LIABILITIES &
SHAREHOLDERS' EQUITY [BAHT]
|
Current
Liabilities |
2012 |
2011 |
2010 |
|
|
|
|
|
|
Trade Accounts & Other
Payable |
303,206,780 |
71,131,469 |
63,644,317 |
|
Undue Construction Cost |
151,832,360 |
2,509,629 |
464,000,000 |
|
Advance from Customer |
1,774,685 |
10,494,322 |
13,622,511 |
|
Advance Cash for
Construction |
1,909,336,355 |
- |
179,707,500 |
|
Current Portion of
Long-term Lease Contract Liabilities |
1,360,046 |
838,086 |
953,842 |
|
Accrued Income Tax |
154,376,165 |
- |
39,461,646 |
|
Short-term Estimated Liabilities |
- |
7,889,983 |
3,522,091 |
|
Other Current Liabilities |
38,236,756 |
32,085,426 |
12,956,926 |
|
|
|
|
|
|
Total Current Liabilities |
2,560,123,147 |
124,948,915 |
777,868,833 |
|
Long-term Lease Contract
Liabilities - Net of
Current Portion |
3,381,069 |
- |
838,086 |
|
Reserve for Long-term
Employee Benefits |
42,768,710 |
38,147,106 |
- |
|
Long-term Estimated Liabilities |
180,000,000 |
180,000,000 |
180,000,000 |
|
Total Liabilities |
2,786,272,926 |
343,096,021 |
958,706,919 |
|
|
|
|
|
|
Shareholders' Equity |
|
|
|
|
|
|
|
|
|
Share capital : Baht 1
par value authorized, & issued share
capital 371,000,000 shares |
371,000,000 |
371,000,000 |
371,000,000 |
|
|
|
|
|
|
Capital Paid |
368,492,092 |
367,873,233 |
367,546,097 |
|
Surplus on Share
Capital |
|
|
|
|
Premium on common stock |
1,355,620,919 |
1,354,703,769 |
1,354,218,953 |
|
Surplus share |
99,327,356 |
- |
- |
|
Retained Earning Appropriated for
statutory reserve |
37,100,000 |
37,100,000 |
37,100,000 |
|
Surplus share reserve |
- |
35,653,539 |
35,653,539 |
|
Unappropriated [Deficit] |
2,118,594,466 |
1,293,157,239 |
1,423,449,431 |
|
Other Components of Shareholder Equity |
103,059,154 |
1,191,361 |
19,797,576 |
|
Surplus share |
- |
[35,653,539] |
[35,653,539] |
|
Total Shareholders' Equity |
4,082,193,987 |
3,054,025,602 |
3,202,112,057 |
|
Total Liabilities & Shareholders' Equity |
6,868,466,913 |
3,397,121,623 |
4,160,818,976 |
PROFIT & LOSS ACCOUNT
|
Revenue |
2012 |
2011 |
2010 |
|
|
|
|
|
|
Production income |
2,761,794,161 |
707,897,862 |
4,436,109,605 |
|
Sales & services income
|
16,359,519 |
33,954,079 |
106,272,503 |
|
Other Income |
|
|
|
|
Interest income |
84,487,115 |
46,702,081 |
38,011,467 |
|
Dividend income |
27,071,250 |
21,086,064 |
13,443,334 |
|
Gain on
exchange rate |
70,552,901 |
- |
3,756,976 |
|
Reversal of
costs not paid |
- |
399,123,116 |
- |
|
Income from reversal of
accounts payable |
- |
- |
19,799,508 |
|
Gain on
sales of Investment |
- |
- |
152,000,788 |
|
Other |
30,322,754 |
24,836,377 |
48,231,229 |
|
Total Revenues |
2,990,587,700 |
1,233,599,579 |
4,817,625,410 |
|
Expenses |
|
|
|
|
|
|
|
|
|
Cost of Production |
1,754,289,496 |
736,388,160 |
2,565,376,423 |
|
Cost of Goods
Sold & Services
|
6,273,146 |
26,480,004 |
84,456,086 |
|
Selling & Administrative Expenses |
269,036 |
1,156,576 |
6,662,361 |
|
Administration Expenses |
70,667,478 |
85,083,788 |
69,947,082 |
|
Total Expenses |
1,831,499,156 |
849,108,528 |
2,726,441,952 |
|
|
|
|
|
|
Profit / [Loss] before Financial Cost &
Income Tax |
1,159,088,544 |
384,491,051 |
2,091,183,458 |
|
Financial Cost |
[1,292,866] |
[670,333] |
[970,786] |
|
Profit / [Loss] before Income Tax |
1,157,795,678 |
383,820,718 |
2,090,212,672 |
|
Income Tax |
[251,540,140] |
- |
[52,837,289] |
|
|
|
|
|
|
Net Profit / [Loss] |
906,255,538 |
383,820,718 |
2,037,375,383 |
FINANCIAL ANALYSIS
|
ITEM |
UNIT |
2012 |
2011 |
2010 |
|
|
|
|
|
|
|
LIQUIDITY RATIO |
|
|
|
|
|
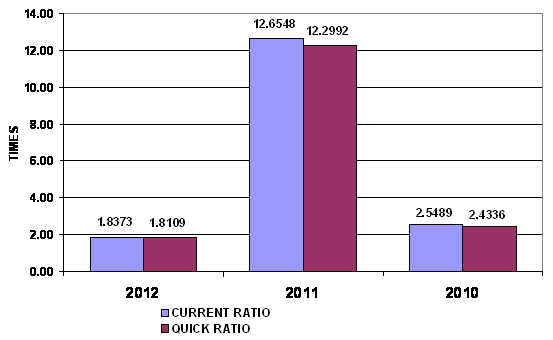
CURRENT RATIO |
TIMES |
1.84 |
12.65 |
2.55 |
|
QUICK RATIO |
TIMES |
1.81 |
12.30 |
2.43 |
|
|
|
|
|
|
|
ACTIVITY RATIO |
|
|
|
|
|
FIXED ASSETS TURNOVER |
TIMES |
2.04 |
0.76 |
4.04 |
|
TOTAL ASSETS TURNOVER |
TIMES |
0.40 |
0.22 |
1.09 |
|
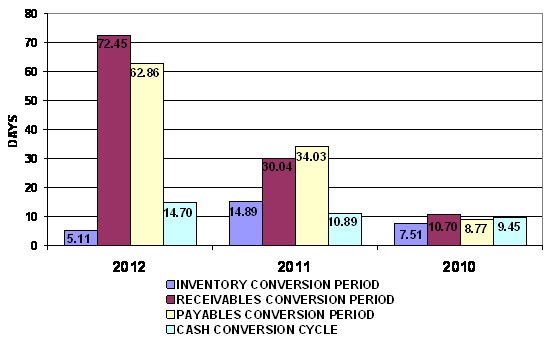
INVENTORY CONVERSION PERIOD |
DAYS |
5.11 |
14.89 |
7.51 |
|
INVENTORY TURNOVER |
TIMES |
71.39 |
24.52 |
48.57 |
|
RECEIVABLES CONVERSION PERIOD |
DAYS |
72.45 |
30.04 |
10.70 |
|
RECEIVABLES TURNOVER |
TIMES |
5.04 |
12.15 |
34.11 |
|
PAYABLES CONVERSION PERIOD |
DAYS |
62.86 |
34.03 |
8.77 |
|
CASH CONVERSION CYCLE |
DAYS |
14.70 |
10.89 |
9.45 |
|
|
|
|
|
|
|
PROFITABILITY RATIO |
|
|
|
|
|
COST OF GOODS SOLD |
% |
63.37 |
102.83 |
58.34 |
|
SELLING & ADMINISTRATION |
% |
0.01 |
0.16 |
0.15 |
|
INTEREST |
% |
0.05 |
0.09 |
0.02 |
|
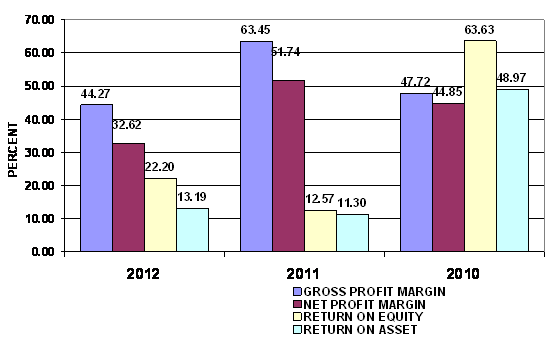
GROSS PROFIT MARGIN |
% |
44.27 |
63.45 |
47.72 |
|
NET PROFIT MARGIN BEFORE EX. ITEM |
% |
41.72 |
51.83 |
46.04 |
|
NET PROFIT MARGIN |
% |
32.62 |
51.74 |
44.85 |
|
RETURN ON EQUITY |
% |
22.20 |
12.57 |
63.63 |
|
RETURN ON ASSET |
% |
13.19 |
11.30 |
48.97 |
|
EARNING PER SHARE |
BAHT |
2.46 |
1.04 |
5.54 |
|
|
|
|
|
|
|
LEVERAGE RATIO |
|
|
|
|
|
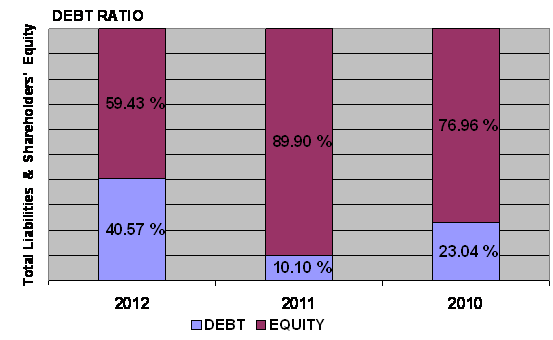
DEBT RATIO |
TIMES |
0.41 |
0.10 |
0.23 |
|
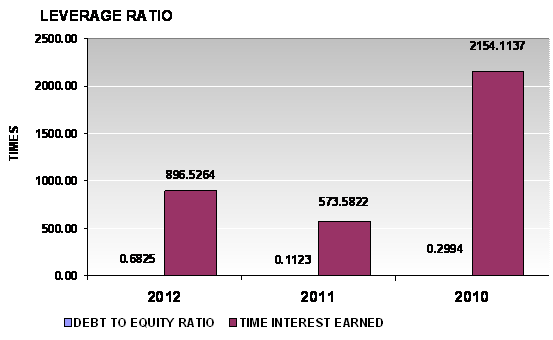
DEBT TO EQUITY RATIO |
TIMES |
0.68 |
0.11 |
0.30 |
|
TIME INTEREST EARNED |
TIMES |
896.53 |
573.58 |
2,154.11 |
|
|
|
|
|
|
|
ANNUAL GROWTH |
|
|
|
|
|
SALES GROWTH |
% |
274.49 |
(83.67) |
|
|
OPERATING PROFIT |
% |
201.46 |
(81.61) |
|
|
NET PROFIT |
% |
136.11 |
(81.16) |
|
|
FIXED ASSETS |
% |
38.60 |
(12.79) |
|
|
TOTAL ASSETS |
% |
102.18 |
(18.35) |
|
ANNUAL GROWTH : EXCELLENT
An annual sales growth is 274.49%. Turnover has increased from THB
741,851,941.00 in 2011 to THB 2,778,153,680.00 in 2012. While net profit has
increased from THB 383,820,718.00 in 2011 to THB 906,255,538.00 in 2012. And
total assets has increased from THB 3,397,121,623.00 in 2011 to THB
6,868,466,913.00 in 2012.
PROFITABILITY : EXCELLENT
PROFITABILITY RATIO
|
Gross Profit Margin |
44.27 |
Impressive |
Industrial Average |
1.58 |
|
Net Profit Margin |
32.62 |
Impressive |
Industrial Average |
0.36 |
|
Return on Assets |
13.19 |
Impressive |
Industrial Average |
0.83 |
|
Return on Equity |
22.20 |
Impressive |
Industrial Average |
2.03 |
Gross Profit Margin used to assess a firm's financial health by revealing
the proportion of money left over from revenues after accounting for the cost
of goods sold. Gross profit margin serves as the source for paying additional
expenses and future savings. The company’s figure is 44.27%. When compared with
the industry average, the ratio of the company was higher, indicated that
company was more profitable than the same industry.
Net Profit Margin is the indicator of the company's efficiency in that
net profit takes into consideration all expenses of the company. A low profit
margin indicates a low margin of safety, higher risk that a decline in sales
will erase profits and result in a net loss. The company’s figure is 32.62%, higher figure when compared with
those of its average competitors in the same industry, indicated that business
was an efficient operator in a dominant
position within its industry.
Return on Assets measures how efficiently profits are being generated
from the assets employed in the business when compared with the ratios of firms
in a similar business. A low ratio in comparison with industry averages
indicates an inefficient use of business assets. Return on Assets ratio is
13.19%, higher figure when compared with those of its average competitors in
the same industry, indicated that business was an efficient profit in a dominant position within its industry.
Return on Equity indicates how profitable a company is by comparing its
net income to its average shareholders' equity, ROE measures how much the
shareholders earned for their investment in the company. Return on Equity ratio
is 22.2%, higher figure when compared with those of its average competitors in
the same industry, indicated that business was an efficient profits in a
dominant position within its industry.
Trend of the average competitors in the same industry for last 5 years
Return on Assets Downtrend
Return on Equity Downtrend
LIQUIDITY : IMPRESSIVE
LIQUIDITY RATIO
|
Current Ratio |
1.84 |
Impressive |
Industrial Average |
1.31 |
|
Quick Ratio |
1.81 |
|
|
|
|
Cash Conversion Cycle |
14.70 |
|
|
|
The Current Ratio is to ascertain whether a company's short-term assets
are readily available to pay off its short-term liabilities. The company's figure
is 1.84 times in 2012, decreased from 12.65 times, then it is generally
considered to have good short-term financial strength. When compared with the
industry average, the ratio of the company was higher, indicated that company
was an efficient operator in a dominant position within its industry.
The Quick Ratio is a liquidity indicator that further refines the
current ratio by measuring the amount of the most liquid current assets there
are to cover current liabilities. The company's figure is 1.81 times in 2012,
decreased from 12.3 times, although excluding inventory so the company still
have good short-term financial strength.
The Cash Conversion Cycle measures the number of days a company's cash
is tied up in the production and sales process of its operations and the
benefit from payment terms from its creditors. It meant the company could
survive when no cash inflow was received from sale for 15 days.
Trend of the average competitors in the same industry for last 5 years
Current Ratio Uptrend
LEVERAGE : EXCELLENT
LEVERAGE RATIO
|
Debt Ratio |
0.41 |
Impressive |
Industrial Average |
0.59 |
|
Debt to Equity Ratio |
0.68 |
Impressive |
Industrial Average |
1.42 |
|
Times Interest Earned |
896.53 |
Impressive |
Industrial Average |
- |
Debt to Equity Ratio a measurement of how much suppliers, lenders,
creditors and obligors have committed to the company versus what the
shareholders have committed. A lower the percentage means that the company is
using less leverage and has a stronger equity position.
Times Interest Earned measuring a company's ability to meet its debt
obligations. Ratio is 896.53 higher than 1, so the company can pay interest
expenses on outstanding debt.
Debt Ratio shows the proportion of a company's assets which are financed
through debt. The company's figure is 0.41 less than 0.5, most of the company's
assets are financed through equity.
Trend of the average competitors in the same industry for last 5 years
Debt Ratio Downtrend
Times Interest Earned Downtrend
ACTIVITY : IMPRESSIVE
ACTIVITY RATIO
|
Fixed Assets Turnover |
2.04 |
Impressive |
Industrial Average |
- |
|
Total Assets Turnover |
0.40 |
Deteriorated |
Industrial Average |
2.26 |
|
Inventory Conversion Period |
5.11 |
|
|
|
|
Inventory Turnover |
71.39 |
Impressive |
Industrial Average |
5.11 |
|
Receivables Conversion Period |
72.45 |
|
|
|
|
Receivables Turnover |
5.04 |
Impressive |
Industrial Average |
3.82 |
|
Payables Conversion Period |
62.86 |
|
|
|
The company's Account Receivable Ratio is calculated as 5.04 and 12.15
in 2012 and 2011 respectively. This ratio measures the efficiency of the company
in managing its trade debtors to generate revenue. A lower ratio may indicate
over extension and collection problems. Conversely, a higher ratio may indicate
an overtly stringent policy. In this case, the company's A/R ratio in 2012
decreased from 2011. This would suggest the company had deteriorated in the
management of its debt collections.
Inventory Turnover in Days Ratio indicates the liquidity of inventory.
It estimates the number of days that it will take to sell the current
inventory. Inventory is particularly sensitive to change in business
activities. The inventory turnover in days has decreased from 15 days at the
end of 2011 to 5 days at the end of 2012. This represents a positive trend. And
Inventory turnover has increased from 24.52 times in year 2011 to 71.39 times
in year 2012.
The company's Total Asset Turnover is calculated as 0.4 times and 0.22
times in 2012 and 2011 respectively. This ratio is determined by dividing total
assets into total sales turnover. The ratio measures the activity of the assets
and the ability of the firm to generate sales through the use of the assets.
Trend of the average competitors in the same industry for last 5 years
Fixed Assets Turnover Downtrend
Total Assets Turnover Uptrend
Inventory Turnover Uptrend
Receivables Turnover Downtrend
FOREIGN EXCHANGE RATES
|
Currency |
Unit
|
Indian Rupees |
|
US Dollar |
1 |
Rs.59.70 |
|
|
1 |
Rs.92.22 |
|
Euro |
1 |
Rs.79.19 |
INFORMATION DETAILS
|
Report Prepared
by : |
SDA |
RATING EXPLANATIONS
|
RATING |
STATUS |
PROPOSED CREDIT LINE |
|
|
>86 |
Aaa |
Possesses an extremely sound financial base with the strongest capability
for timely payment of interest and principal sums |
Unlimited |
|
71-85 |
Aa |
Possesses adequate working capital. No caution needed for credit
transaction. It has above average (strong) capability for payment of interest
and principal sums |
Large |
|
56-70 |
A |
Financial & operational base are regarded healthy. General
unfavourable factors will not cause fatal effect. Satisfactory capability for
payment of interest and principal sums |
Fairly Large |
|
41-55 |
Ba |
Overall operation is considered normal. Capable to meet normal
commitments. |
Satisfactory |
|
26-40 |
B |
Capability to overcome financial difficulties seems comparatively
below average. |
Small |
|
11-25 |
Ca |
Adverse factors are apparent. Repayment of interest and principal sums
in default or expected to be in default upon maturity |
Limited with
full security |
|
<10 |
C |
Absolute credit risk exists. Caution needed to be exercised |
Credit not
recommended |
|
---- |
NB |
New Business |
---- |
This score serves as a reference to assess SC’s credit risk
and to set the amount of credit to be extended. It is calculated from a
composite of weighted scores obtained from each of the major sections of this report.
The assessed factors and their relative weights (as indicated through %) are as
follows:
Financial
condition (40%) Ownership
background (20%) Payment
record (10%)
Credit history
(10%) Market trend
(10%) Operational
size (10%)
This report is issued at your request without any
risk and responsibility on the part of MIRA INFORM PRIVATE LIMITED (MIPL)
or its officials.