MIRA
INFORM REPORT
|
Report Date : |
22.06.2013 |
IDENTIFICATION DETAILS
|
Name : |
CORTEFIEL SA |
|
|
|
|
Registered Office : |
Avenida Llano Castellano, 51, 28034 |
|
|
|
|
Country : |
|
|
|
|
|
Financials (as on) : |
28.02.2011 |
|
|
|
|
Date of Incorporation : |
01.01.1956 |
|
|
|
|
Legal Form : |
Joint-Stock Company |
|
|
|
|
Line of Business : |
Retail sale of clothes |
|
|
|
|
No. of Employees : |
5.574 |
RATING & COMMENTS
|
MIRA’s Rating : |
B |
|
RATING |
STATUS |
PROPOSED CREDIT LINE |
|
|
26-40 |
B |
Capability to overcome financial difficulties seems comparatively
below average. |
Small |
|
Status : |
Moderate |
|
Payment Behaviour : |
No Complaints |
|
Litigation : |
Clear |
NOTES:
Any query related to this report can be made
on e-mail: infodept@mirainform.com
while quoting report number, name and date.
ECGC Country Risk Classification List – March 31st 2013
|
Country Name |
Previous Rating (31.12.2012) |
Current Rating (31.03.2013) |
|
Spain |
A2 |
A2 |
|
Risk Category |
ECGC
Classification |
|
Insignificant |
A1 |
|
Low |
A2 |
|
Moderate |
B1 |
|
High |
B2 |
|
Very High |
C1 |
|
Restricted |
C2 |
|
Off-credit |
D |
spain ECONOMIC OVERVIEW
After almost 15
years of above average GDP growth, the Spanish economy began to slow in late 2007
and entered into a recession in the second quarter of 2008. GDP contracted by
3.7% in 2009, ending a 16-year growth trend, and by another 0.3% in 2010; GDP
expanded 0.4% in 2011, before contracting 1.4% in 2012. The economy has once
again fallen into recession as deleveraging in the private sector, fiscal
consolidation, and continued high unemployment weigh on domestic demand and
investment, even as exports have shown signs of resiliency. The unemployment
rate rose from a low of about 8% in 2007 to 26.0% in 2012. The economic
downturn has also hurt Spain's public finances. The government budget deficit
peaked at 11.2% of GDP in 2010 and the process to reduce this imbalance has
been slow despite the central government's efforts to raise new tax revenue and
cut spending. Spain reduced its budget deficit to 9.4% of GDP in 2011, and
roughly 7.4% of GDP in 2012, above the 6.3% target negotiated between Spain and
the EU. Although Spain's large budget deficit and poor economic growth
prospects remain a source of concern for foreign investors, the government's
ongoing efforts to cut spending and introduce flexibility into the labor
markets are intended to assuage these concerns. The government is also taking
steps to shore up the banking system, namely by using up to $130 billion in EU
funds to recapitalize struggling banks exposed to the collapsed domestic
construction and real estate sectors.
|
Source : CIA |
Company name
CORTEFIEL SA
CIF/NIF: A08099459
Company situation: Active
Answer to the data
in your request
Telephone number
The numbers provided (913873427, 913873809) are correct.
Business Name
The correct registered name is the one indicated in this report and not
the one mentioned in your request.
Information
associated to the latest filed accounts
A provisional report is sent while we wait to receive the Accounts from the Trade Register.
EXECUTIVE SUMMARY
Identification
Current Business Name: CORTEFIEL SA
Commercial name: SPRINGFIELD
WOMAN; WOMEN’S SECRET
Other names: YES
Current Address:
AVENIDA LLANO CASTELLANO, 51
28034 MADRID
Branches: 185
Telephone number: 913873400 Fax: 913873604
URL: www.cortefiel.com , www.grupocortefiel.com
, www.fiftyfactory.com
Trade Risk
Incidents: YES
Financial Information
Balance sheet latest sales (2011): 745.319.000,00 € (Mercantile Register)
Result: 16.009.000 €
Total Assets: 1.099.680.000 €
Share capital: 262.574.209,95 €
Employees: 5.574
Listed on a Stock Exchange: NO
Commercial Information
Incorporation date: 07/11/1956
Activity: Retail sale of clothes
NACE 2009 CODE: 4771
International Operations: Imports
Corporate Structure
Vice-president:
Parent Company:
Participations: 17
Other Complementary Information
Latest filed accounts in the Mercantile Register: 2012
Latest act published in BORME: 18/06/2013 Resignations
Latest press article: 20/06/2013 LA VANGUARDIA (GOVERNING BODIES)
Bank Entities: There are
The date when this report was last updated is 21/06/2013.
The information contained in this report has been investigated and
contrasted on 15/04/2013
Financial situation
|
Exercise:2011 |
Evolution |
|||
|
Immediate
liquidity |
|
Good |
|
|
|
Indebtedness |
|
Important |
|
|
|
Profitability |
|
Sufficient |
|
|
|
Soundness |
|
Degraded |
|
|
Performance
|
Incidents |
|
Exceptional |
|
Business
Trajectory |
|
Superior |
Rating Explanation
Financial situation
•
The company’s financial situation is normal.
•
The company’s financial situation evolution has
been negative.
•
The sales evolution has been negative
not the results one, which has been positive.
•
The auditor’s opinion about the latest accounts has
been favourable.
Company Structure
•
The company’s capitalization degree determines that
its structure is sound.
•
The company’s size is big depending on
its sales volume.
•
The employees evolution has been negative.
Performance and Incidences
•
The available information indicates that the
company does not have payment incidences.
•
He have detected recent legal actions or claims
from the Administration against this company.
Accounts Filing
•
The company files regularly its accounts.
Other Complementary Information
•
Se ha procedido a realizar una revisión de la
calificación de la sociedad por parte de uno de nuestros analistas derivada del
resultado de nuestras investigaciones.
Reasons of the
last outstanding calculation in the note
|
DATE |
CHANGE |
RESULTING NOTE |
EVENT |
|
21/06/2013 |
Equal |
11 |
•
Variation in the rating system with regards to
legal incidences information. |
|
24/05/2013 |
Equal |
11 |
•
Variation in the rating system with regards to
legal incidences information. |
|
26/04/2013 |
Increase |
11 |
•
One of our analysts has carried a detailed
revision of all available information of the company. |
|
24/04/2013 |
Reduction |
7 |
•
Variation in the rating system with regards to
legal incidences information. |
|
10/04/2013 |
Equal |
9 |
•
Variation in the rating system with regards to
legal incidences information. |
INCIDENTS

Summary
LEGAL ACTIONS: 3 ( Last:20/03/2013 , first: 16/11/2011
)
|
|
|
|
|
Insolvency Proceeding: |
0 |
|
|
Civil Court: |
0 |
|
|
Labour Courts: |
3 |
|
ADMINISTRATIVE CLAIMS: 3 ( Last:11/04/2013 , first:
03/03/2011 )
|
|
|
|
|
With the Social Security: |
0 |
|
|
With the Tax Authorities: |
0 |
|
|
With Other Official bodies: |
3 |
|
AFFECTED BY:
1 Company / Companies in Insolvency Proceedings.
Last Legal Actions
figures expressed in €
LABOUR COURT.
|
DATE |
INCIDENCE STATUS |
ACTOR |
AMOUNT |
|
20/03/2013 |
CLAIM FOR A SUM IN LABOUR COURT |
|
|
|
04/09/2012 |
CLAIM FOR A SUM IN LABOUR COURT |
|
|
|
16/11/2011 |
CLAIM FOR A SUM IN LABOUR COURT |
|
|
Details of the
Latest Legal Actions
figures expressed in €
LABOUR COURT.
|
|
|
|
Conducted in |
MALAGA, SOCIAL COURT N. 12 |
|
Writ Number |
1558/2009 |
|
Complaint Date |
20/03/2013 |
Record of the claim
|
PHASE |
CLAIM FOR A SUM
IN LABOUR COURT |
|
|
Date of the Edict: 24/05/2013 |
|
|
Source: Published in Gazette of MALAGA, page 19 |
Plaintiffs
|
NAME |
DATE |
AMOUNT |
ENFORCEMENT NUMBER |
|
PEREZ MORENO TEODORA |
20/03/2013 |
|
|
figures expressed in €
LABOUR COURT.
|
|
|
|
Conducted in |
MALAGA, SOCIAL COURT N. 11 |
|
Writ Number |
1397/2009 |
|
Complaint Date |
04/09/2012 |
Record of the claim
|
PHASE |
CLAIM FOR A SUM
IN LABOUR COURT |
|
|
Date of the Edict: 07/11/2012 |
|
|
Source: Published in Gazette of SEVILLA, page 19 |
Plaintiffs
|
NAME |
DATE |
AMOUNT |
ENFORCEMENT NUMBER |
|
GIL GIL JOSE |
04/09/2012 |
|
17.0/2013.0 |
Latest
Administrative Claims
figures expressed in €
WITH OTHER OFFICIAL BODIES.
Seizures
|
DATE |
ORGANIZATION |
AMOUNT |
|
11/04/2013 |
TOWN/ CITY HALL DE LEIOA |
|
|
03/03/2011 |
DEPUTATION/ DELEGATION PROVINCIAL DE MALAGA |
|
Notifications
|
DATE |
ORGANIZATION |
AMOUNT |
|
10/11/2011 |
MINISTRY DE TRABAJO E INMIGRACION - SERVICIO PUBLICO DE EMPLEO
ESTATAL |
2.556,00 |
Detail of the
Latest Administrative Claims
figures expressed in €
Seizures
WITH OTHER OFFICIAL BODIES.
Phase: SEIZURE
Organization: TOWN/ CITY HALL DE LEIOA
Concept: Other debts
Date of the claim: 11/04/2013
Source: Published in the VIZCAYA Gazette, on 22/04/2013, page 10.208
figures expressed in €
Notifications
WITH OTHER OFFICIAL BODIES.
Phase: DEBTS WITH OFFICIAL BODIES
Organization: MINISTRY DE TRABAJO E INMIGRACION - SERVICIO
PUBLICO DE EMPLEO ESTATAL
Concept: Other debts
Date of the claim: 10/11/2011
Source: Published in the Gazette of CIUDAD REAL, on 19/12/2011, page 17.444
Amount : 2.556
R.A.I.
COMPANY NOT REGISTERED IN THE R.A.I.
This company is not registered in the Disputed Bills register (R.A.I.)
DATE AND TIME OF THE CONSULTATION
17/06/2013 15:06:21
Information from the Registro de Aceptaciones Impagados (RAI)- Disputed
Bills register.
It can only be used for information legitimate needs of the consulting
party, in accordance with its social or business activity, in order to grant a
credit or the monitoring or control of the already granted credits and can not
be transmitted or communicated to thirds, nor copied, duplicated, reproduced
nor implemented to any database , owned or external, or reused it in anyway,
direct or indirectly.
FINANCIAL ELEMENTS AND SECTORIAL COMPARATIVE
FINANCIAL ELEMENTS
Figures given in thousands €
|
|
28/02/2011 (12) BALANCE SHEET |
% ASSETS |
28/02/2010 (12) BALANCE SHEET |
% ASSETS |
28/02/2009 (12) BALANCE SHEET |
% ASSETS |
|
ASSETS |
|
|
|
|
|
|
|
A) NON CURRENT ASSETS |
897.842,00 |
81,65 |
944.546,00 |
82,26 |
937.100,00 |
74,70 |
|
B) CURRENT ASSETS |
201.838,00 |
18,35 |
203.705,00 |
17,74 |
317.437,00 |
25,30 |
|
LIABILITIES |
|
|
|
|
|
|
|
A) NET WORTH |
323.287,00 |
29,40 |
302.742,00 |
26,37 |
208.035,00 |
16,58 |
|
B) NON CURRENT LIABILITIES |
564.912,00 |
51,37 |
658.236,00 |
57,33 |
840.775,00 |
67,02 |
|
C) CURRENT LIABILITIES |
211.481,00 |
19,23 |
187.273,00 |
16,31 |
205.727,00 |
16,40 |
Profit and loss
account analysis ![]()
Figures given in thousands €
|
|
28/02/2011 (12) BALANCE SHEET |
% NET TURNOVER |
28/02/2010 (12) BALANCE SHEET |
% NET TURNOVER |
28/02/2009 (12) BALANCE SHEET |
% NET TURNOVER |
|
SALES |
745.319,00 |
|
761.263,00 |
|
839.489,00 |
|
|
GROSS MARGIN |
397.106,00 |
53,28 |
388.891,00 |
51,08 |
418.674,00 |
49,87 |
|
EBITDA |
84.711,00 |
11,37 |
4.979,00 |
0,65 |
104.920,00 |
12,50 |
|
EBIT |
20.681,00 |
2,77 |
-18.988,00 |
-2,49 |
27.380,00 |
3,26 |
|
NET RESULT |
16.009,00 |
2,15 |
-30.855,00 |
-4,05 |
-1.285,00 |
-0,15 |
|
EFFECTIVE TAX RATE (%) |
-122,36 |
-0,02 |
-40,24 |
-0,01 |
-442,80 |
-0,05 |
COMPARATIVE SECTOR ANALYSIS
Values table
Figures expressed in %
|
|
COMPANY (2011) |
SECTOR |
DIFFERENCE |
|
BALANCE SHEET ANALYSIS: % on the total
assets |
|
|
|
|
ASSETS |
|||
|
A) NON CURRENT ASSETS |
81,65 |
74,44 |
7,21 |
|
A) CURRENT ASSETS |
18,35 |
25,56 |
-7,21 |
|
LIABILITIES |
|||
|
A) NET WORTH |
29,40 |
38,86 |
-9,46 |
|
B) NON CURRENT LIABILITIES |
51,37 |
32,05 |
19,32 |
|
C) CURRENT LIABILITIES |
19,23 |
29,09 |
-9,86 |
|
|
|
|
|
|
|
COMPANY (2011) |
SECTOR |
DIFFERENCE |
|
PROFIT AND LOSS ACCOUNT ANALYSIS: % on the total
operating income |
|
|
|
|
SALES |
97,15 |
98,74 |
-1,59 |
|
GROSS MARGIN |
51,76 |
48,73 |
3,03 |
|
EBITDA |
11,04 |
13,81 |
-2,77 |
|
EBIT |
2,70 |
9,22 |
-6,52 |
|
NET RESULT |
2,09 |
7,06 |
-4,97 |
Sector Composition
Compared sector (NACE 2009): 4771
Number of companies: 18
Size (sales figure): > 40,000,000.00 Euros
OTHER DATA FROM THE ANNUAL FINANCIAL REPORT
Results
Distribution
Source: annual financial report 2011
Figures given in €
|
DISTRIBUTION BASE |
APPLICATION A |
||
|
Profit and Loss Account Balance |
16.009.000,00 |
Legal Reserve |
1.601.000,00 |
|
Carry over |
0,00 |
Goodwill reserve |
13.008.000,00 |
|
Voluntary reserves |
0,00 |
Special reserves |
0,00 |
|
Other reserves disposable at will |
0,00 |
Voluntary reserves |
0,00 |
|
Total of Amounts to be distributed |
16.009.000,00 |
Dividends |
0,00 |
|
|
|
Carry over and others |
0,00 |
|
|
|
Compensation of previous exercises losses |
1.400.000,00 |
|
|
|
Application total |
16.009.000,00 |
Auditing
Source: filing of annual financial statement 2011
Auditors’ opinion: FAVOURABLE
Auditor: DELOITTE S.L.
Auditor emphasis:
Sin que afecte a nuestra opinión, llamamos la atención respecto de lo señalado
en la Nota 8-b de la
memoria adjunta, en la que se indica que la Sociedad participa
mayoritariamente en el capital social de
ciertas sociedades con algunas de las que realiza una parte muy
significativa de sus compras en los
términos y condiciones acordadas entre las mismas, centralizando así
mismo la gestión de los recursos
financieros de las sociedades del Grupo. Adicionalmente los
Administradores de la Sociedad han
decidido voluntariamente formular cuentas anuales consolidadas,
elaboradas de acuerdo a las Normas
Internacionales de Información Financiera adoptadas por la Unión Europea
(NIIF VE) sobre las que,
en esta misma fecha, hemos emitido nuestro informe de auditoría y en el
que expresamos una opinión
favorable. Un resumen de las cuentas anuales consolidadas de Cortefiel,
S.A. y Sociedades
Dependientes correspondientes al ejercicio anual terminado el 28 de
febrero de 2011 preparadas
conforme a las Normas Internacionales de Información Financiera
adoptadas por la Unión Europea
(NIIF UE) se detalla en la Nota 8-b de la memoria adjunta
Auditing fees: 156.000,00 €
Facts subsequent
to the closing
Source: Annual financial report 2011
En abril de 2011 el Grupo ha adquirido la totalidad del capital social
de la sociedad Cortix Beograd D.O.O. Mediante esta operación el Grupo adquiere
el negocio (20 tiendas en la actualidad) de su franquiciado en Serbia, Bosnia y
Macedonia. En el mes de marzo de 2011, la Sociedad ha procedido a pagar
anticipadamente el Tramo CAPEX del préstamo descrito en la Nota 14, por importe
36.500 miles de euros.
Company
ADDRESSES
Current Legal Seat Address:
AVENIDA LLANO CASTELLANO, 51
28034 MADRID
|
STREET |
POSTAL CODE |
TOWN |
PROVINCE |
|
CALLE GENERAL ALAVA, 24 |
01005 |
VITORIA-GASTEIZ |
Araba/Álava |
|
CALLE LA PAZ, 8 |
01004 |
VITORIA-GASTEIZ |
Araba/Álava |
|
LUGAR PARQUE COMERCIAL GORBEIA, 1 |
01196 |
ZIGOITIA |
Araba/Álava |
|
CALLE ALCALDE CONANGLA, 27 |
02006 |
ALBACETE |
Albacete |
|
CALLE MAYOR, 9 |
02001 |
ALBACETE |
Albacete |
|
AVENIDA REYES CATOLICOS, 123 |
02600 |
VILLARROBLEDO |
Albacete |
|
CALLE ROSARIO, 20 |
02001 |
ALBACETE |
Albacete |
|
CALLE CORREDORA, 37 |
03202 |
ELCHE/ELX |
Alicante |
|
AVENIDA DOCTOR GADEA, 24 |
03001 |
ALICANTE/ALACANT |
Alicante |
|
CALLE GRAN VIA |
03009 |
ALICANTE/ALACANT |
Alicante |
|
STREET |
POSTAL CODE |
TOWN |
PROVINCE |
|
CALLE ENRIQUE SEGURA OTAÑO, 9 |
06004 |
BADAJOZ |
Badajoz |
|
PASEO DEL DELEITE |
28300 |
ARANJUEZ |
Madrid |
|
AVENIDA DE LA LIBERTAD |
28770 |
COLMENAR VIEJO |
Madrid |
|
CALLE DE SUIZA, 12 |
28821 |
COSLADA |
Madrid |
|
CALLE PRECIADOS, 13 |
28013 |
MADRID |
Madrid |
CORPORATE STRUCTURE
ADMINISTRATIVE
LINKS
|
|
|
|
|
|
Distribution of the administration board |
|
|
Governing body : 14 members (latest change:
06/06/2013) Other Positions : 28 (latest change: 06/06/2013) Auditor : 2 (latest change: 19/10/2012) Operative Board Members : 3 (latest change: 10/04/2013) Non-current positions : 37 (latest change: 10/06/2013) |
|
|
Main Board
members, Directors and Auditor ![]()
Governing body
|
POSITION |
NAME AND SURNAME |
DATE APPOINTMENT |
|
VICE-PRESIDENT |
ESCRIBANO GARCIA, JUAN CARLOS |
14/12/2009 |
|
MANAGING DIRECTOR |
ESCRIBANO GARCIA BOSQUE, JUAN CARLOS |
25/05/2009 |
|
MEMBER OF THE BOARD |
THEATRE DIRECTORSHIP SERVICES ALPHA S AR L |
01/09/2006 |
|
MEMBER OF THE BOARD |
THEATRE DIRECTORSHIP SERVICES BETA S AR L |
01/09/2006 |
|
MEMBER OF THE BOARD |
MAURICE PARIS, MICHEL |
21/08/2007 |
|
MEMBER OF THE BOARD |
SZAFIR HOLCMAN, EZEQUIEL |
09/06/2009 |
|
MEMBER OF THE BOARD |
MALLO ALVAREZ, CARLOS |
16/11/2011 |
|
MEMBER OF THE BOARD |
DE SERDIO FERNANDEZ, RICARDO |
16/11/2011 |
|
MEMBER OF THE BOARD |
THEATRE DIRECTORSHISP SERVICES ALPHA S. AR. L |
16/11/2011 |
|
|
|
|
Auditor
|
POSITION |
NAME AND SURNAME |
DATE APPOINTMENT |
|
AUDITOR |
DELOITTE SL |
09/02/2010 |
|
CONSOLIDATED ACCOUNTS AUDITOR |
DELOITTE SL |
19/10/2012 |
Board members remuneration
Source: Annual financial report 2010
Board members remuneration: 1.798.000,00 €
|
POSITION |
NAME AND SURNAME |
|
General Manager |
SAENZ OLLER, FERNANDO |
|
Financial Manager |
GOMEZ, MARCOS |
|
Human Resources Director |
CHAROLA, DIEGO |
FINANCIAL LINKS
|
|
BUSINESS NAME |
TAX NUMBER/COUNTRY |
% |
SOURCE |
DATE REP. |
|
|
MEP RETAIL ESPAÑA SL |
B84332550 |
92,29 |
MERCANTILE REGISTER |
29/02/2012 |
|
|
JUPISA TRES SA |
A78604535 |
Indef. |
B.O.R.M.E. |
21/06/2013 |
|
|
LIQUID INVESTMENTS SL |
B84120716 |
Indef. |
B.O.R.M.E. |
01/10/2012 |
|
|
SERRANO 6 SL |
B81058992 |
Indef. |
B.O.R.M.E. |
16/12/2010 |
|
|
HINOJOSA VACAS ISABEL |
|
Indef. |
OWN SOURCES |
24/01/2008 |
|
|
COMPAÑIA GENERAL DE INVERSIONES, SICAV, SA |
A28038644 |
Indef. |
OWN SOURCES |
24/01/2008 |
|
|
BSN BANIF EUROPA 30 FIM. |
G78793452 |
Indef. |
OWN SOURCES |
24/01/2008 |
|
|
ECHEVARRIA ALTOZANO PILAR |
|
Indef. |
OWN SOURCES |
24/01/2008 |
|
|
HINOJOSA GARCIA PUENTE IGNACIO |
|
Indef. |
OWN SOURCES |
24/01/2008 |
|
|
CAIXA D’ESTALVIS I PENSIONS DE BARCELONA |
G58899998 |
Indef. |
OWN SOURCES |
24/01/2008 |
![]() Company
with rating inferior to 7
Company
with rating inferior to 7
Majority shareholder of MEP RETAIL ESPAÑA SL
|
|
BUSINESS NAME |
TAX NUMBER/COUNTRY |
% |
SOURCE |
DATE REP. |
|
|
MEP SARL |
LUXEMBOURG |
100,00 |
OWN SOURCES |
13/03/2013 |
|
|
BUSINESS NAME |
TAX NUMBER/COUNTRY |
% |
SOURCE |
DATE REP. |
|
|
CORTEFIEL SA (EXTINGUIDA) |
A28051761 |
100,00 |
OWN SOURCES |
30/11/2005 |
|
|
BANCO SANTANDER SA |
A39000013 |
Indef. |
MERCANTILE REGISTER |
31/12/2011 |
|
|
ULTRA RADIO SA |
A41003054 |
Indef. |
MERCANTILE REGISTER |
31/12/2011 |
![]() Company
with rating inferior to 7
Company
with rating inferior to 7
|
|
BUSINESS NAME |
TAX NUMBER/COUNTRY |
% |
SOURCE |
DATE REP. |
|
|
SERMAN 92 SL |
B80464860 |
100,00 |
OWN SOURCES |
19/03/2013 |
|
|
EUROFIEL CONFECCION SA |
A26007351 |
100,00 |
OWN SOURCES |
08/02/2013 |
|
|
CORTEFIEL POLSKA SZOO |
POLAND |
100,00 |
MERCANTILE REGISTER |
28/02/2011 |
|
|
CORTEFIEL COMMERCIAL SA |
SWITZERLAND |
100,00 |
MERCANTILE REGISTER |
28/02/2011 |
|
|
QUIRAL BELGIQUE N.V. |
BELGIUM |
100,00 |
MERCANTILE REGISTER |
28/02/2011 |
|
|
SPRINGFIELD HUNGARY TRADING LT |
HUNGARY |
100,00 |
MERCANTILE REGISTER |
28/02/2011 |
|
|
FASHION AUCTION SPAIN SL |
B85757847 |
100,00 |
MERCANTILE REGISTER |
28/02/2011 |
|
|
CORTEFIEL FRANCE SA |
FRANCE |
100,00 |
MERCANTILE REGISTER |
28/02/2011 |
|
|
CONFEMO CONFECCOES E MODA DE ESPHANA LDA |
PORTUGAL |
100,00 |
MERCANTILE REGISTER |
28/02/2011 |
|
|
SPRINGFIELD HANDELSGESELLSCHAFT GMBH |
AUSTRIA |
100,00 |
MERCANTILE REGISTER |
28/02/2011 |
|
|
BUSINESS NAME |
TAX NUMBER/COUNTRY |
% |
SOURCE |
DATE REP. |
|
|
SPRINGFIELD SPORTSWEAR GMBH & CO KG |
GERMANY |
100,00 |
MERCANTILE REGISTER |
28/02/2011 |
|
|
CLASSE AFFAIRES SA |
FRANCE |
100,00 |
MERCANTILE REGISTER |
28/02/2011 |
|
|
SPRINGFIELD HANDELSGESELLSEHAFT GMBH |
GERMANY |
100,00 |
MERCANTILE REGISTER |
28/02/2011 |
BUSINESS INFORMATION
Incorporation date: 07/11/1956
Establishment
date: 01/01/1956
Founder’s Name: LA TITULAR ES LA
FUNDADORA INICIAL DEL NEGOCIO
Activity
Activity: Retail sale of clothes
NACE 2009 CODE: 4771
NACE 2009 Activity: Retail sale of clothing in specialised
stores
Business: FABRICACION COMPRAVENTA Y EN GENERAL CUALQUIER
CLASE DE COMERCIO, AL POR MENOR Y AL POR MAYOR YA SEA NACIONAL O INTERNACIONAL
DE IMPORTACION O DE EXPORTACION ASI COMO CUALQUIER INDUSTRIAL RELACIONADOS CON
TODA CLASE DE H
Latest employees figure: 5.574 (2013)
% of fixed employees: 62,99%
% of temporary employees: 37,01%
% of men: 20,89%
% of women: 79,11%
Employees
evolution
|
|
|
|
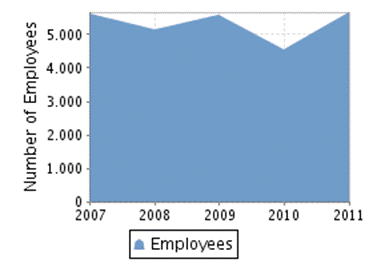
Source: Annual financial report 2011
|
CATEGORY |
AVERAGE NUMBER OF EMPLOYEES |
MEN |
WOMEN |
|
Distribution by sexes |
|
944 |
3.574 |
COMMERCIAL OPERATIONS
SALES
National Distribution: 100%
•
El 90.51% de su cifra de negocio corresponde a la
venta de tiendas.
•
El 8.98% de su cifra de negocio corresponde a las
empresas del grupo y asociadas.
•
El 0.28% de su cifra de negocio corresponde a las
mayoristas, uniformes y otros.
•
El 0.13% de su cifra de negocio corresponde a la
prestación de servicios a terceros.
•
El 0.08% de su cifra de negocio corresponde a los
arreglos.
•
El 0.02% de su cifra de negocio corresponde a la
prestación de servicios al grupo.
Professional and
advertising services ![]()
Source: Annual financial report 2011
Professional services
expenses: 4.353.000,00 €
Advertising services expenses: 18.602.000,00 €
|
ENTITY |
BRANCH |
ADDRESS |
TOWN OR CITY |
PROVINCE |
|
BANCO BILBAO VIZCAYA ARGENTARIA, S.A. |
|
|
MADRID |
|
Discount facilities: 0
Credit policy: 1
Mortgage loan: 0
Loans with no real security: 0
|
|
|
|
Debt type: Credit policy |
Granted limit:5.000.000,00 € Used limit:0,00 € Available limit:5.000.000,00
€ Source: Filed
Accounts (2011) |
|
|
|
FORMER NAMES:
•
COMERCIAL ESPAÑOLA DEL VESTIDO SA
Brand name: CTF (Valid)
Type: JOINT Scope: NATIONAL Date: 07/03/2013
Brand name: ABERDEEN (Valid)
Type: JOINT Scope: NATIONAL Date: 05/03/2013
Brand name: MILANO (Valid)
Type: JOINT Scope: NATIONAL Date: 03/10/2012
Brand name: W SHAPE BY WOMEN’SECRET (Valid)
Type: JOINT Scope: NATIONAL Date: 17/09/2012
Brand name: WOMEN’SECRET (Valid)
Type: JOINT Scope: INTERNATIONAL
Date: 12/09/2012
LEGAL STRUCTURE
Constitution Data
Register Date: 07/11/1956
Legal form: Joint-stock Company
Share capital: 262.574.209,95 €
Paid-up capital: 262.574.209,95 €
Obligation to fill in Financial Statements: YES
Chamber census: YES (2011)
B.O.R.M.E.
(OFFICIAL GAZETTE OF
THE MERCANTILE REGISTER) ![]()
· Acts on activity: 1 (Last: 28/09/2006)
Acts on
administrators: 55 (Last: 18/06/2013, first: 05/05/1993)
Acts on
capital: 3 (Last: 14/05/2010, first: 11/08/2006)
Acts on creation: 0
Acts on filed
accounts: 26 (Last: 12/04/2011, first: 15/01/1992)
Acts on
identification: 2 (Last: 28/09/2006, first: 02/08/1993)
Acts on
Information: 22 (Last: 05/11/2012, first: 05/05/1993)
Acts on
proceedings: 9 (Last: 28/09/2006, first: 04/05/2006)
Latest acts in
B.O.R.M.E.
Other acts
|
ACT |
DATE |
NOTICE NUM. |
MERCANTILE REGISTER |
|
Resignations |
18/06/2013 |
278289 |
Madrid |
|
Appointments |
14/06/2013 |
274383 |
Madrid |
|
Resignations |
14/06/2013 |
274383 |
Madrid |
|
Appointments |
07/06/2013 |
262305 |
Madrid |
|
Resignations |
07/06/2013 |
262305 |
Madrid |
|
Appointments |
06/03/2013 |
111851 |
Madrid |
|
Website of the company |
05/11/2012 |
452480 |
Madrid |
|
Other concepts |
05/11/2012 |
452480 |
Madrid |
|
Appointments |
05/11/2012 |
452480 |
Madrid |
|
Appointments |
30/10/2012 |
444103 |
Madrid |
PRESS ARTICLES
Press summary by
type of information (last five years) ![]()
Legal notices: 0
Structural Data: 49 (Last: 20/06/2013, first: 17/01/2008)
Informative data: 22 (Last: 24/05/2013, first: 10/02/2009)
Financial Information: 16 (Last: 12/03/2013, first:
16/06/2008)
Negative information: 0
Business lines: 5 (Last: 26/03/2012, first: 12/03/2008)
Historical press releases: 42 (Last: 06/12/2007, first:
29/06/2006)
Latest press
article published ![]()
20/06/2013 LA
VANGUARDIA (Page 51) GOVERNING BODIES
Ansel van den Auwelant, presidente no ejecutivo de GRUPO CORTEFIEL,
presentó el 19/06/13 la dimisión por motivos personales. La gestión de la
compañía pasará al actual consejero delegado y vicepresidente del grupo, Juan
Carlos Escribano García-Bosque.
19/06/2013 EL PERIÓDICO DE CATALUNYA - GOVERNING
BODIES
La compañía textil CORTEFIEL anunció el 18/06/13 la dimisión de su
presidente no ejecutivo, Anselm van den Auwelant, que deja la compañía después
de diez 10 años. Respecto a su sucesor, desde Cortefiel señalaron a Servimedia
aunque todavía no existe decisión al respecto.
24/05/2013 EXPANSIÓN DEL PAIS
VASCO - ENVIRONMENT
Los establecimientos de CORTEFIEL y MCDONALD’S en Max Center han sido
premiados por Sonae Sierra por destacar en sus prácticas medioambientales entre
todos los comerciantes de los nueve centros que tiene el grupo en España.
12/03/2013 EXPANSIÓN (Page 13) BRANCHES
El grupo textil CORTEFIEL ha decidido apostar por la
internacionalización como fórmula para paliar los efectos de la caída de
consumo en España. CORTEFIEL abrirá 1.000 tiendas en China durante los próximos
5 años. El pasado mes de octubre CORTEFIEL inauguro los primeros
establecimientos en el gigante asiático en ciudades como Shanghai, Guangzhou y
Pekín de las firmas SPRINGFIELD y PEDRO DEL HIERRO. Su objetivo es lograr que
el 50% de su facturación provenga del exterior. Además de las tiendas que se
inaugurarán en China, CORTEFIEL prepara la apertura de 260 nuevos
establecimientos en Rusia. SPRINGFIELD, la enseña juvenil, seguirá abriendo
locales en España (entre 20 y 30 tiendas nuevas).
12/03/2013 CINCO DIAS (Page 14) FINANCIAL
DATA
CORTEFIEL ha avanzado que el grupo cerrará su ejercicio fiscal 2012-2013
con unos 1.000 millones de ventas, cifra similar al año anterior, impulsadas
por el negocio internacional, con crecimiento de entre el 30% y el 40%, que ha
amortiguado la caída de consumo en España.
Complementary
Information
Corporate Social Responsibility
Esta empresa se adhirió al Pacto Mundial el 14/02/2002. (Fuente: Red
Española del Pacto Mundial de Naciones Unidas).
Último informe de progreso
presentado: Año 2011
Financial Information
El balance del Registro Mercantil cerrado a 28/02/2011 (Deposito 2011)
esta disponible en INFORMA, pero existen datos en los nuevos estados contables
incorrectamente presentados.
Current situation
Según Depósito de 28/02/2006 la sociedad permaneció inactiva durante
dicho periodo.
FINANCIAL INFORMATION
The information on the last Individual Filed Accounts contained in this
report is extracted from the Mercantile Register file of the legal address of
the Company and dated 16/07/2012.
SITUATION
BALANCE-SHEET
Assets
Figures given in thousands €
|
|
28/02/2011 (12) |
% ASSETS |
28/02/2010 (12) |
% ASSETS |
28/02/2009 (12) |
% ASSETS |
|
A) NON CURRENT ASSETS |
897.842,00 |
81,65 |
944.546,00 |
82,26 |
937.100,00 |
74,70 |
|
I. Intangible assets |
549.440,00 |
49,96 |
577.366,00 |
50,28 |
603.575,00 |
48,11 |
|
3. Patents, licences , trademarks and similars |
250.372,00 |
22,77 |
273.360,00 |
23,81 |
|
|
|
4. Goodwill |
|
|
260.157,00 |
22,66 |
260.157,00 |
20,74 |
|
5. Software |
2.156,00 |
0,20 |
1.868,00 |
0,16 |
1.022,00 |
0,08 |
|
7. Other intangible assets |
296.912,00 |
27,00 |
41.981,00 |
3,66 |
342.396,00 |
27,29 |
|
II. Tangible fixed assets |
132.253,00 |
12,03 |
137.544,00 |
11,98 |
153.507,00 |
12,24 |
|
2. Technical fittings and other tangible assets |
125.299,00 |
11,39 |
130.350,00 |
11,35 |
152.170,00 |
12,13 |
|
3. Fixed assets in progress and advances |
6.954,00 |
0,63 |
7.194,00 |
0,63 |
1.337,00 |
0,11 |
|
III. Real-estate investments |
|
|
|
|
|
|
|
IV. Long term investments in associated and affiliated companies |
196.948,00 |
17,91 |
210.919,00 |
18,37 |
156.624,00 |
12,48 |
|
1. Net worth instruments |
192.491,00 |
17,50 |
207.328,00 |
18,06 |
145.450,00 |
11,59 |
|
2. Credits to companies |
4.457,00 |
0,41 |
3.591,00 |
0,31 |
11.174,00 |
0,89 |
|
V. Long Term Financial Investments |
15.211,00 |
1,38 |
13.422,00 |
1,17 |
16.103,00 |
1,28 |
|
4. By-products |
928,00 |
0,08 |
|
|
6,00 |
0,00 |
|
5. Other financial assets |
14.283,00 |
1,30 |
13.422,00 |
1,17 |
13.343,00 |
1,06 |
|
6. Other investments |
|
|
|
|
2.754,00 |
0,22 |
|
VI. Assets by deferred taxes |
1.636,00 |
0,15 |
3.361,00 |
0,29 |
7.291,00 |
0,58 |
|
VII. Non current commercial debts |
2.354,00 |
0,21 |
1.934,00 |
0,17 |
|
|
|
B) CURRENT ASSETS |
201.838,00 |
18,35 |
203.705,00 |
17,74 |
317.437,00 |
25,30 |
|
I. Non-current assets maintained for sale |
|
|
|
|
2.415,00 |
0,19 |
|
II. Stocks |
69.793,00 |
6,35 |
66.150,00 |
5,76 |
85.146,00 |
6,79 |
|
1. Goods available for sale |
|
|
|
|
85.146,00 |
6,79 |
|
4. Finished goods |
69.793,00 |
6,35 |
66.150,00 |
5,76 |
|
|
|
b) Short production cycle |
69.793,00 |
6,35 |
66.150,00 |
5,76 |
|
|
|
III. Trade Debtors and other receivable accounts |
51.670,00 |
4,70 |
64.761,00 |
5,64 |
76.178,00 |
6,07 |
|
1. Clients |
3.289,00 |
0,30 |
6.076,00 |
0,53 |
3.325,00 |
0,27 |
|
b) Clients for sales and short term services
rendering |
3.289,00 |
0,30 |
6.076,00 |
0,53 |
3.325,00 |
0,27 |
|
2. Clients group and associated companies |
45.742,00 |
4,16 |
56.212,00 |
4,90 |
66.751,00 |
5,32 |
|
3. Other debts |
765,00 |
0,07 |
1.183,00 |
0,10 |
3.759,00 |
0,30 |
|
4. Staff |
407,00 |
0,04 |
169,00 |
0,01 |
416,00 |
0,03 |
|
6. Other credits with the Public Administrations |
1.467,00 |
0,13 |
1.121,00 |
0,10 |
1.927,00 |
0,15 |
|
IV. Short term investments in associated and affiliated companies |
180,00 |
0,02 |
8.499,00 |
0,74 |
1.165,00 |
0,09 |
|
2. Credits to companies |
|
|
8.499,00 |
0,74 |
1.165,00 |
0,09 |
|
5. Other financial assets |
180,00 |
0,02 |
|
|
|
|
|
V. Short term financial investments |
|
|
|
|
|
|
|
VI. Short term periodifications |
323,00 |
0,03 |
100,00 |
0,01 |
460,00 |
0,04 |
|
VII. Cash and equivalents |
79.872,00 |
7,26 |
64.195,00 |
5,59 |
152.073,00 |
12,12 |
|
1. Treasury |
39.820,00 |
3,62 |
4.595,00 |
0,40 |
3.573,00 |
0,28 |
|
2. Other cash equivalents |
40.052,00 |
3,64 |
59.600,00 |
5,19 |
148.500,00 |
11,84 |
|
TOTAL ASSETS (A + B) |
1.099.680,00 |
100,00 |
1.148.251,00 |
100,00 |
1.254.537,00 |
100,00 |
Net Worth and Liabilities
Figures given in thousands €
|
|
28/02/2011 (12) |
% ASSETS |
28/02/2010 (12) |
% ASSETS |
28/02/2009 (12) |
% ASSETS |
|
A) NET WORTH |
323.287,00 |
29,40 |
302.742,00 |
26,37 |
208.035,00 |
16,58 |
|
A-1) Equity |
322.790,00 |
29,35 |
303.288,00 |
26,41 |
232.657,00 |
18,55 |
|
I. Capital |
262.574,00 |
23,88 |
252.638,00 |
22,00 |
131.478,00 |
10,48 |
|
1. Authorized capital |
262.574,00 |
23,88 |
252.638,00 |
22,00 |
131.478,00 |
10,48 |
|
II. Issue premium |
6.456,00 |
0,59 |
6.456,00 |
0,56 |
6.456,00 |
0,51 |
|
III. Reserves |
75.280,00 |
6,85 |
76.334,00 |
6,65 |
96.008,00 |
7,65 |
|
1. Legal and statutory |
|
|
76.334,00 |
6,65 |
6.535,00 |
0,52 |
|
2. Other funds |
75.280,00 |
6,85 |
|
|
89.473,00 |
7,13 |
|
IV. (Net worth own shares and participations) |
-5.389,00 |
-0,49 |
|
|
|
|
|
V. Results from previous years |
-32.140,00 |
-2,92 |
-1.285,00 |
-0,11 |
|
|
|
2. (Prior years losses) |
-32.140,00 |
-2,92 |
-1.285,00 |
-0,11 |
|
|
|
VI. Other loans from partners |
|
|
|
|
|
|
|
VII. Exercise Result |
16.009,00 |
1,46 |
-30.855,00 |
-2,69 |
-1.285,00 |
-0,10 |
|
VIII. (Interim dividend) |
|
|
|
|
|
|
|
IX. Other net worth instruments |
|
|
|
|
|
|
|
A-2) Value changes adjustments |
497,00 |
0,05 |
-546,00 |
-0,05 |
-24.622,00 |
-1,96 |
|
I. Financial assets available for sale |
|
|
|
|
|
|
|
II. Coverage operations |
497,00 |
0,05 |
-546,00 |
-0,05 |
-24.622,00 |
-1,96 |
|
III. Non-current assets and related liabilities, maintained for sale |
|
|
|
|
|
|
|
IV. Conversion differences |
|
|
|
|
|
|
|
V. Other |
|
|
|
|
|
|
|
A-3) Received legacies, grants and subventions |
|
|
|
|
|
|
|
B) NON CURRENT LIABILITIES |
564.912,00 |
51,37 |
658.236,00 |
57,33 |
840.775,00 |
67,02 |
|
I. Long term provisions |
3.235,00 |
0,29 |
1.076,00 |
0,09 |
1.286,00 |
0,10 |
|
4. Other provisions |
3.235,00 |
0,29 |
1.076,00 |
0,09 |
1.286,00 |
0,10 |
|
II. Long term debts |
277.131,00 |
25,20 |
338.025,00 |
29,44 |
443.832,00 |
35,38 |
|
2. Debts with bank entities |
275.673,00 |
25,07 |
335.285,00 |
29,20 |
437.999,00 |
34,91 |
|
4. By-products |
|
|
1.282,00 |
0,11 |
4.302,00 |
0,34 |
|
5. Other financial liabilities |
1.458,00 |
0,13 |
1.458,00 |
0,13 |
1.531,00 |
0,12 |
|
III. Long term debts with associated and affiliated companies |
242.477,00 |
22,05 |
276.121,00 |
24,05 |
351.051,00 |
27,98 |
|
IV. Liabilities by deferred taxes |
42.069,00 |
3,83 |
43.014,00 |
3,75 |
44.606,00 |
3,56 |
|
V. Long term periodifications |
|
|
|
|
|
|
|
VI. Non current trade creditors |
|
|
|
|
|
|
|
VII. Long term debts with special characteristics |
|
|
|
|
|
|
|
C) CURRENT LIABILITIES |
211.481,00 |
19,23 |
187.273,00 |
16,31 |
205.727,00 |
16,40 |
|
I. Liabilities related with non-current assets maintained for sale |
|
|
|
|
|
|
|
II. Short term provisions |
2.206,00 |
0,20 |
2.227,00 |
0,19 |
136,00 |
0,01 |
|
III. Short term debts |
20.613,00 |
1,87 |
8.501,00 |
0,74 |
16.102,00 |
1,28 |
|
2. Debts with bank entities |
19.133,00 |
1,74 |
6.079,00 |
0,53 |
7.173,00 |
0,57 |
|
4. By-products |
1.480,00 |
0,13 |
2.422,00 |
0,21 |
8.929,00 |
0,71 |
|
IV. Short term debts with associated and affiliated companies |
113.549,00 |
10,33 |
113.482,00 |
9,88 |
134.606,00 |
10,73 |
|
V. Trade creditors and other payable accounts |
70.504,00 |
6,41 |
58.470,00 |
5,09 |
54.533,00 |
4,35 |
|
1. Suppliers |
36.682,00 |
3,34 |
30.979,00 |
2,70 |
32.130,00 |
2,56 |
|
b) Short term suppliers |
36.682,00 |
3,34 |
30.979,00 |
2,70 |
32.130,00 |
2,56 |
|
4. Staff (pending remunerations) |
12.869,00 |
1,17 |
15.540,00 |
1,35 |
10.141,00 |
0,81 |
|
6. Other debts with Public Administrations |
20.953,00 |
1,91 |
11.951,00 |
1,04 |
12.262,00 |
0,98 |
|
VI. Short term periodifications |
4.609,00 |
0,42 |
4.593,00 |
0,40 |
350,00 |
0,03 |
|
VII. Short term debts with special characteristics |
|
|
|
|
|
|
|
TOTAL NET WORTH AND LIABILITIES (A + B + C) |
1.099.680,00 |
100,00 |
1.148.251,00 |
100,00 |
1.254.537,00 |
100,00 |
PROFIT AND LOSS ACCOUNT
Figures given in thousands €
|
|
28/02/2011 (12) |
%OPERATING INCOME |
28/02/2010 (12) |
%OPERATING INCOME |
28/02/2009 (12) |
%OPERATING INCOME |
|
A) CONTINUED OPERATIONS |
|
|
|
|
|
|
|
1. Net Turnover |
745.319,00 |
97,15 |
761.263,00 |
97,43 |
839.489,00 |
97,32 |
|
A) Sales |
744.383,00 |
97,03 |
757.352,00 |
96,93 |
836.736,00 |
97,00 |
|
b) Services provided |
936,00 |
0,12 |
3.911,00 |
0,50 |
2.753,00 |
0,32 |
|
2. Variation in stocks of finished goods and work in progress |
|
|
|
|
|
|
|
3. Works for its own assets |
|
|
|
|
|
|
|
4. Supplies |
-370.041,00 |
-48,24 |
-392.486,00 |
-50,23 |
-443.976,00 |
-51,47 |
|
a) Material consumed |
-366.042,00 |
-47,71 |
-402.579,00 |
-51,52 |
-441.141,00 |
-51,14 |
|
b) Raw materials consumed |
|
|
-27.088,00 |
-3,47 |
|
|
|
d) Deterioration on merchandises, raw materials and other supplies |
-3.999,00 |
-0,52 |
37.181,00 |
4,76 |
-2.835,00 |
-0,33 |
|
5. Other operating income |
21.828,00 |
2,85 |
20.114,00 |
2,57 |
23.161,00 |
2,68 |
|
a) Other incomes |
21.828,00 |
2,85 |
|
|
23.161,00 |
2,68 |
|
b) Operating grants included in the exercise result |
|
|
20.114,00 |
2,57 |
|
|
|
6. Labour cost |
-117.630,00 |
-15,33 |
-149.758,00 |
-19,17 |
-124.176,00 |
-14,39 |
|
a) Wages and similar expenses |
-83.698,00 |
-10,91 |
-125.208,00 |
-16,02 |
-87.084,00 |
-10,09 |
|
b) Social costs |
-23.497,00 |
-3,06 |
-24.550,00 |
-3,14 |
-37.092,00 |
-4,30 |
|
c) Provisions |
-10.435,00 |
-1,36 |
|
|
|
|
|
7. Other operating costs |
-197.513,00 |
-25,75 |
-196.973,00 |
-25,21 |
-192.413,00 |
-22,30 |
|
a) External services |
-196.025,00 |
-25,55 |
-191.873,00 |
-24,56 |
-191.112,00 |
-22,15 |
|
b) Taxes |
-1.488,00 |
-0,19 |
-5.100,00 |
-0,65 |
-1.301,00 |
-0,15 |
|
8. Amortization of fixed assets |
-60.031,00 |
-7,83 |
-61.971,00 |
-7,93 |
-61.899,00 |
-7,18 |
|
9. Allocation of subventions on non financial investments and other |
|
|
|
|
|
|
|
10. Provisions excess |
|
|
|
|
|
|
|
11. Deterioration and result for fixed assets disposal |
-1.251,00 |
-0,16 |
823,00 |
0,11 |
-12.806,00 |
-1,48 |
|
a) Deteriorations and losses |
|
|
823,00 |
0,11 |
-12.806,00 |
-1,48 |
|
b) Results for disposals and others |
-1.251,00 |
-0,16 |
|
|
|
|
|
12. Negative difference of business combinations |
|
|
|
|
|
|
|
13. Other results |
|
|
|
|
|
|
|
A.1) OPERATING RESULT (1 + 2 + 3 + 4 + 5 + 6 + 7 + 8 + 9 + 10 + 11 +
12 + 13) |
20.681,00 |
2,70 |
-18.988,00 |
-2,43 |
27.380,00 |
3,17 |
|
14. Financial income |
37.045,00 |
4,83 |
29.243,00 |
3,74 |
72.795,00 |
8,44 |
|
a) From net worth instruments participations |
36.199,00 |
4,72 |
28.514,00 |
3,65 |
70.651,00 |
8,19 |
|
a 1) On group and associated companies |
36.199,00 |
4,72 |
28.514,00 |
3,65 |
70.651,00 |
8,19 |
|
b) From negotiable values and other financial instruments |
846,00 |
0,11 |
729,00 |
0,09 |
2.144,00 |
0,25 |
|
b 1) From group and associated companies |
323,00 |
0,04 |
332,00 |
0,04 |
829,00 |
0,10 |
|
b 2) From third parties |
523,00 |
0,07 |
397,00 |
0,05 |
1.315,00 |
0,15 |
|
15. Financial expenses |
-37.832,00 |
-4,93 |
-39.538,00 |
-5,06 |
-46.989,00 |
-5,45 |
|
a) For debts with associated and affiliated companies |
-8.081,00 |
-1,05 |
-11.378,00 |
-1,46 |
-23.864,00 |
-2,77 |
|
b) For debts with third parties |
-29.751,00 |
-3,88 |
-28.160,00 |
-3,60 |
-23.125,00 |
-2,68 |
|
16. Reasonable value variation on financial instruments |
-14.346,00 |
-1,87 |
-10.147,00 |
-1,30 |
-51.366,00 |
-5,95 |
|
a) Negotiation portfolio and others |
-14.346,00 |
-1,87 |
-10.147,00 |
-1,30 |
-51.366,00 |
-5,95 |
|
17. Exchange differences |
1.716,00 |
0,22 |
-657,00 |
-0,08 |
547,00 |
0,06 |
|
18. Deterioration and result for disposal of financial instruments |
|
|
-6.124,00 |
-0,78 |
|
|
|
a) Deteriorations and losses |
|
|
-6.124,00 |
-0,78 |
|
|
|
19. Other financial income and expenses |
|
|
|
|
|
|
|
A.2) FINANCIAL RESULT (14 + 15 + 16 + 17 + 18 + 19) |
-13.417,00 |
-1,75 |
-27.223,00 |
-3,48 |
-25.013,00 |
-2,90 |
|
A.3) RESULT BEFORE TAXES (A.1 + A.2) |
7.264,00 |
0,95 |
-46.211,00 |
-5,91 |
2.367,00 |
0,27 |
|
20. Taxes on profits |
8.888,00 |
1,16 |
18.594,00 |
2,38 |
10.481,00 |
1,21 |
|
A.4) EXERCISE RESULT COMING FROM CONTINUED OPERATIONS (A.3 + 20) |
16.152,00 |
2,11 |
-27.617,00 |
-3,53 |
12.848,00 |
1,49 |
|
B) DISCONTINUED OPERATIONS |
|
|
|
|
|
|
|
21. Net of taxes exercise result coming from discontinued operations |
-143,00 |
-0,02 |
-3.238,00 |
-0,41 |
-14.133,00 |
-1,64 |
|
A.5) EXERCISE RESULT (A.4 + 21) |
16.009,00 |
2,09 |
-30.855,00 |
-3,95 |
-1.285,00 |
-0,15 |
NET WORTH CHANGES STATUS
Status of recognized
income and expenses
Figures given in thousands €
|
NET WORTH CHANGES (1/3) |
28/02/2011 (12) |
28/02/2010 (12) |
28/02/2009 (12) |
|
A) PROFIT AND LOSS ACCOUNT RESULT |
16.009,00 |
-30.855,00 |
-1.285,00 |
|
INCOME AND EXPENSES ALLOCATED DIRECTLY TO NET WORTH |
|
|
|
|
I. For valuation of financial instruments |
1.043,00 |
|
|
|
2. Other income / expenses |
1.043,00 |
|
|
|
II. Cash flow coverage |
|
|
|
|
III. Received legacies, grants and subventions |
|
|
|
|
IV. For actuarial profits and losses and other adjustments |
-1.054,00 |
|
|
|
V. Non-current assets and related liabilities, maintained for sale |
|
|
|
|
VI. Conversion differences |
|
|
-12.541,00 |
|
VII. Tax effect |
|
|
|
|
B) TOTAL INCOME AND EXPENSES ALLOCATED DIRECTLY TO NET WORTH (I + II +
III + IV +V+VI+VII) |
-11,00 |
4.402,00 |
-12.541,00 |
|
PROFIT AND LOSS ACCOUNT TRANSFERS |
|
|
|
|
VIII. For valuation of financial instruments |
|
|
|
|
IX. Cash flow coverage |
|
|
|
|
X. Received legacies, grants and subventions |
|
|
|
|
XI. Non-current assets and related liabilities, maintained for sale |
|
|
|
|
XII. Conversion differences |
|
|
|
|
XIII. Tax effect |
|
|
|
|
C) TOTAL TRANSFERS TO THE PROFIT AND LOSS ACCOUNT (VIII + IX + X + XI+
XII+ XIII) |
|
|
|
|
TOTAL INCOME AND EXPENSES RECOGNIZED (A + B + C) |
15.998,00 |
-26.463,00 |
-13.826,00 |
Total net worth changes status
Figures given in thousands €
|
NET WORTH CHANGES ( 2 /3) |
AUTHORIZED CAPITAL |
ISSUE PREMIUM |
RESERVES |
(NET WORTH OWN SHARES AND PARTICIPATIONS) |
|
FINAL ACCOUNT BALANCE OF EXERCISE (2008) |
131.478,00 |
6.469,00 |
46.038,00 |
|
|
I. Adjustments by change of criteria in the exercise (2008) |
|
-13,00 |
|
|
|
II. Adjustments by errors in the exercise (2008) |
|
|
|
|
|
ADJUSTED ACCOUNT BALANCE, BEGINNING OF EXERCISE (2009) |
131.478,00 |
6.456,00 |
46.038,00 |
|
|
I. Total recognized income and expenses |
|
|
|
|
|
II. Operations with partners or owners |
|
|
|
|
|
III. Other net worth variations |
|
|
49.970,00 |
|
|
FINAL ACCOUNT BALANCE OF EXERCISE (2009) |
131.478,00 |
6.456,00 |
83.927,00 |
|
|
I. Adjustments by change of criteria in the exercise (2009) |
|
|
|
|
|
II. Adjustments by errors in the exercise (2009) |
|
|
|
|
|
ADJUSTED ACCOUNT BALANCE, BEGINNING OF EXERCISE (2010) |
|
|
|
|
|
I. Total recognized income and expenses |
|
|
|
|
|
II. Operations with partners or owners |
121.160,00 |
|
|
|
|
1. Capital Increases |
121.160,00 |
|
|
|
|
7. Other operations with partners or owners |
|
|
|
|
|
III. Other net worth variations |
|
|
-7.593,00 |
|
|
FINAL ACCOUNT BALANCE OF EXERCISE (2010) |
252.638,00 |
6.456,00 |
76.334,00 |
|
|
I. Adjustments by change of criteria in the exercise (2010) |
|
|
|
|
|
II. Adjustments by errors in the exercise (2010) |
|
|
|
|
|
ADJUSTED ACCOUNT BALANCE, BEGINNING OF EXERCISE (2011) |
252.638,00 |
6.456,00 |
76.334,00 |
|
|
I. Total recognized income and expenses |
|
|
|
|
|
II. Operations with partners or owners |
9.936,00 |
|
-1.054,00 |
-5.389,00 |
|
1. Capital Increases |
9.936,00 |
|
|
|
|
2. (-) Capital reductions |
|
|
-1.054,00 |
|
|
4. (-) Dividends distribution |
|
|
|
|
|
7. Other operations with partners or owners |
|
|
|
-5.389,00 |
|
III. Other net worth variations |
|
|
|
|
|
FINAL ACCOUNT BALANCE OF EXERCISE (2011) |
262.574,00 |
6.456,00 |
75.280,00 |
-5.389,00 |
|
NET WORTH CHANGES ( 3 /3) |
RESULTS FROM PREVIOUS YEARS |
EXERCISE RESULT |
VALUE CHANGES ADJUSTMENT |
TOTAL |
|
FINAL ACCOUNT BALANCE OF EXERCISE (2008) |
|
49.970,00 |
|
233.955,00 |
|
I. Adjustments by change of criteria in the exercise (2008) |
|
|
-12.081,00 |
-12.094,00 |
|
II. Adjustments by errors in the exercise (2008) |
|
|
|
|
|
ADJUSTED ACCOUNT BALANCE, BEGINNING OF EXERCISE (2009) |
|
49.970,00 |
-12.081,00 |
221.861,00 |
|
I. Total recognized income and expenses |
|
-1.285,00 |
-12.541,00 |
-13.826,00 |
|
II. Operations with partners or owners |
|
|
|
|
|
III. Other net worth variations |
|
-49.970,00 |
|
|
|
FINAL ACCOUNT BALANCE OF EXERCISE (2009) |
|
-1.285,00 |
-12.541,00 |
208.035,00 |
|
I. Adjustments by change of criteria in the exercise (2009) |
|
|
|
|
|
II. Adjustments by errors in the exercise (2009) |
|
|
|
|
|
ADJUSTED ACCOUNT BALANCE, BEGINNING OF EXERCISE (2010) |
|
|
|
|
|
I. Total recognized income and expenses |
|
-30.855,00 |
|
-30.855,00 |
|
II. Operations with partners or owners |
-1.285,00 |
1.285,00 |
|
121.160,00 |
|
1. Capital Increases |
|
|
|
121.160,00 |
|
7. Other operations with partners or owners |
-1.285,00 |
1.285,00 |
|
|
|
III. Other net worth variations |
|
|
11.995,00 |
4.402,00 |
|
FINAL ACCOUNT BALANCE OF EXERCISE (2010) |
-1.285,00 |
-30.855,00 |
-546,00 |
302.742,00 |
|
I. Adjustments by change of criteria in the exercise (2010) |
|
|
|
|
|
II. Adjustments by errors in the exercise (2010) |
|
|
|
|
|
ADJUSTED ACCOUNT BALANCE, BEGINNING OF EXERCISE (2011) |
-1.285,00 |
-30.855,00 |
-546,00 |
302.742,00 |
|
I. Total recognized income and expenses |
|
16.009,00 |
|
16.009,00 |
|
II. Operations with partners or owners |
-30.855,00 |
30.855,00 |
|
3.493,00 |
|
1. Capital Increases |
|
|
|
9.936,00 |
|
2. (-) Capital reductions |
|
|
|
-1.054,00 |
|
4. (-) Dividends distribution |
-30.855,00 |
|
|
-30.855,00 |
|
7. Other operations with partners or owners |
|
30.855,00 |
|
25.466,00 |
|
III. Other net worth variations |
|
|
1.043,00 |
1.043,00 |
|
FINAL ACCOUNT BALANCE OF EXERCISE (2011) |
-32.140,00 |
16.009,00 |
497,00 |
323.287,00 |
CASH FLOW STATUS
Figures given in thousands €
|
|
28/02/2011 (12) |
28/02/2010 (12) |
28/02/2009 (12) |
|
A) CASH FLOW COMING FROM OPERATING ACTIVITIES |
|
|
|
|
1. exercise result before taxes |
7.121,00 |
-49.449,00 |
2.367,00 |
|
2. Results adjustments |
76.730,00 |
92.274,00 |
109.513,00 |
|
a) Amortization of fixed assets (+) |
60.031,00 |
62.200,00 |
63.319,00 |
|
b) Value correction for deterioration (+/-) |
-953,00 |
-2.522,00 |
20.457,00 |
|
c) Change of Provisions (+/-) |
2.415,00 |
2.091,00 |
|
|
e) Results for decline and disposal of fixed assets (+/-) |
2.204,00 |
3.282,00 |
724,00 |
|
f) Results for decline and disposal of financial instruments (+/-) |
|
6.124,00 |
|
|
g) Financial income (-) |
-37.045,00 |
-29.243,00 |
-72.795,00 |
|
f) Financial expenses (+) |
37.832,00 |
39.538,00 |
46.989,00 |
|
i) Change difference (+/-) |
-1.716,00 |
657,00 |
-547,00 |
|
j) Reasonable value variation on financial instruments (+/-) |
13.962,00 |
10.147,00 |
51.366,00 |
|
3. Changes in current capital |
30.276,00 |
98.762,00 |
-69.400,00 |
|
a) Stocks (+/-) |
-3.643,00 |
18.996,00 |
15.295,00 |
|
b) Debtors and other receivable accounts (+/-) |
22.474,00 |
30.081,00 |
-11.347,00 |
|
c) Other current assets (+/-) |
-223,00 |
360,00 |
618,00 |
|
d) Creditors and other payable accounts (+/-) |
3.094,00 |
49.099,00 |
-72.849,00 |
|
e) Other current liabilities (+/-) |
8.574,00 |
226,00 |
-1.117,00 |
|
4. Other cash flow coming from operating activities |
5.182,00 |
-7.271,00 |
15.519,00 |
|
a) Interests payments (-) |
-31.863,00 |
|
-43.690,00 |
|
b) Dividends collections (+) |
36.199,00 |
28.514,00 |
70.651,00 |
|
c) Interests collections (+) |
846,00 |
729,00 |
2.691,00 |
|
d) Collections (payments) for profit tax (+/-) |
|
|
-14.133,00 |
|
e) Other payments (collections) (-/+) |
|
-36.514,00 |
|
|
5. Cash flow coming from operating activities (1 + 2 + 3 + 4) |
119.309,00 |
134.316,00 |
57.999,00 |
|
B) CASH FLOW COMING FROM INVESTING ACTIVITIES |
|
|
|
|
6. Investment payments (-) |
-72.102,00 |
-138.966,00 |
-73.433,00 |
|
a) Group and associated companies |
-37.325,00 |
-103.319,00 |
-35.585,00 |
|
b) Intangible assets |
-1.047,00 |
-1.485,00 |
-1.084,00 |
|
c) Tangible assets |
-27.069,00 |
-20.217,00 |
-35.815,00 |
|
d) Real state investments |
-4.687,00 |
|
|
|
e) Other financial assets |
-1.974,00 |
-545,00 |
-949,00 |
|
7. Disinvestment collections (+) |
51.211,00 |
31.299,00 |
31.847,00 |
|
a) Group and associated companies |
50.468,00 |
29.099,00 |
30.547,00 |
|
c) Tangible assets |
51,00 |
914,00 |
617,00 |
|
e) Other financial assets |
692,00 |
1.286,00 |
683,00 |
|
8. Cash Flow in investment activities (6 + 7) |
-20.891,00 |
-94.267,00 |
-41.586,00 |
|
C) CASH FLOW COMING FROM FINANCING ACTIVITIES |
|
|
|
|
9. Net worth instruments collections and payments |
3.493,00 |
|
|
|
a) Net worth instruments issue (+) |
8.882,00 |
|
|
|
c) Own net worth instruments acquisition (-) |
-5.389,00 |
|
|
|
10. Financial liabilities instruments collections and payments |
-84.455,00 |
-123.072,00 |
66.572,00 |
|
a) Issue |
|
|
105.225,00 |
|
2. Debts with bank entities (+) |
|
|
105.158,00 |
|
5. Other debts (+) |
|
|
67,00 |
|
b) Return and amortization of |
-84.455,00 |
-123.072,00 |
-38.653,00 |
|
2. Debts with bank entities (-) |
-50.811,00 |
-107.489,00 |
|
|
3. Debts with group and associated companies (-) |
-33.644,00 |
-15.502,00 |
-35.638,00 |
|
5. Other debts (-) |
|
-81,00 |
-3.015,00 |
|
11. Payments for dividends and remunerations of other net worth
instruments |
-1.779,00 |
-4.855,00 |
|
|
a) Dividends (-) |
-1.779,00 |
-4.855,00 |
|
|
12. Cash Flow in financing activities (9 + 10 + 11) |
-82.741,00 |
-127.927,00 |
66.572,00 |
|
D) Exchange rate variations effect |
|
|
|
|
E) NET CASH OR EQUIVALENTS INCREASE / REDUCTION (5 + 8 + 12 + D) |
15.977,00 |
-87.878,00 |
82.985,00 |
|
Cash or equivalents at the beginning of the exercise |
64.195,00 |
152.073,00 |
69.088,00 |
|
Cash or equivalents at the end of the exercise |
79.872,00 |
64.195,00 |
152.073,00 |
RATIOS
|
|
28/02/2011 (12) |
CHANGE % |
28/02/2010 (12) |
CHANGE % |
28/02/2009 (12) |
|
BALANCE RATIOS |
|||||
|
Working Capital (€) |
-9.643,00 |
-158,68 |
16.432,00 |
-85,29 |
111.710,00 |
|
Working capital ratio |
-0,01 |
-200,00 |
0,01 |
-88,89 |
0,09 |
|
Soundness Ratio |
0,36 |
12,50 |
0,32 |
28,00 |
0,25 |
|
Average Collection Period (days) |
25 |
-18,82 |
31 |
-6,59 |
33 |
|
Average Payment Period (days) |
117 |
10,96 |
105 |
-1,68 |
107 |
|
LIQUIDITY RATIOS |
|||||
|
Current Ratio (%) |
95,44 |
-12,26 |
108,77 |
-29,51 |
154,30 |
|
Quick Ratio (%) |
37,77 |
10,18 |
34,28 |
-53,63 |
73,92 |
|
DEBT RATIOS |
|||||
|
Borrowing percentage (%) |
59,45 |
-7,27 |
64,11 |
-14,94 |
75,37 |
|
External Financing Average Cost |
0,06 |
20,00 |
0,05 |
0,00 |
0,05 |
|
Debt Service Coverage |
5,48 |
0,00 |
5,48 |
-66,38 |
16,30 |
|
Interest Coverage |
0,55 |
214,58 |
-0,48 |
-182,76 |
0,58 |
|
GENERAL AND ACTIVITIES RATIOS |
|||||
|
Auto financing generated by sales (%) |
16,01 |
-9,24 |
17,64 |
155,28 |
6,91 |
|
Auto financing generated by Assets (%) |
10,85 |
-7,26 |
11,70 |
153,25 |
4,62 |
|
Breakdown Point |
1,03 |
5,10 |
0,98 |
-4,85 |
1,03 |
|
Average Sales Volume per Employee |
131,38 |
-21,45 |
167,25 |
11,05 |
150,61 |
|
Average Cost per Employee |
20,74 |
-36,96 |
32,90 |
47,67 |
22,28 |
|
Assets Turnover |
0,68 |
3,03 |
0,66 |
-1,49 |
0,67 |
|
Inventory Turnover (days) |
68 |
11,83 |
61 |
-11,98 |
69 |
|
RESULTS RATIOS |
|||||
|
Return on Assets (ROA) (%) |
1,88 |
213,94 |
-1,65 |
-175,69 |
2,18 |
|
Operating Profitability (%) |
7,23 |
89,27 |
3,82 |
-37,38 |
6,10 |
|
Return on Equity (ROE) (%) |
2,25 |
114,76 |
-15,24 |
-1.594,12 |
1,02 |
SECTORIAL ANALYSIS
Balance Sheet and
Financial Balance
Figures expressed in %
|
|
COMPANY (2011) |
SECTOR |
DIFFERENCE |
|
BALANCE SHEET ANALYSIS: % on the total
assets |
|
|
|
|
ASSETS |
|||
|
A) NON CURRENT ASSETS |
81,65 |
74,44 |
7,21 |
|
A) CURRENT ASSETS |
18,35 |
25,56 |
-7,21 |
|
LIABILITIES |
|||
|
A) NET WORTH |
29,40 |
38,86 |
-9,46 |
|
B) NON CURRENT LIABILITIES |
51,37 |
32,05 |
19,32 |
|
C) CURRENT LIABILITIES |
19,23 |
29,09 |
-9,86 |
Results Analytical
Account
Figures given in %
|
|
COMPANY (2011) |
SECTOR |
DIFFERENCE |
|
Net Turnover |
97,15 |
98,74 |
-1,59 |
|
Other operating income |
2,85 |
1,26 |
1,59 |
|
OPERATING INCOME |
100,00 |
100,00 |
0,00 |
|
Supplies |
-48,24 |
-51,19 |
2,95 |
|
Variation in stocks of finished goods and work in progress |
|
-0,09 |
|
|
GROSS MARGIN |
51,76 |
48,73 |
3,03 |
|
Other operating costs |
-25,75 |
-20,28 |
-5,47 |
|
Labour cost |
-15,33 |
-14,50 |
-0,83 |
|
GROSS OPERATING RESULT |
10,68 |
13,95 |
-3,27 |
|
Amortization of fixed assets |
-7,83 |
-4,54 |
-3,29 |
|
Deterioration and result for fixed assets disposal |
-0,16 |
-0,18 |
0,02 |
|
Other expenses / income |
|
0,00 |
|
|
NET OPERATING RESULT |
2,70 |
9,22 |
-6,52 |
|
Financial result |
-1,75 |
-0,25 |
-1,50 |
|
RESULT BEFORE TAX |
0,95 |
8,98 |
-8,03 |
|
Taxes on profits |
1,16 |
-1,92 |
3,08 |
|
RESULT COMING FROM CONTINUED OPERATIONS |
2,11 |
7,06 |
-4,95 |
|
Exercise result coming from discontinued operations net of taxes |
-0,02 |
0,00 |
-0,02 |
|
NET RESULT |
2,09 |
7,06 |
-4,97 |
|
Amortization of fixed assets |
-7,83 |
-4,54 |
-3,29 |
|
Deterioration and provisions variation |
-0,52 |
-0,05 |
-0,47 |
|
|
10,43 |
11,65 |
-1,22 |
Main Ratios
Figures given in thousands €
|
|
COMPANY (2011) |
PTILE25 |
PTILE50 |
PTILE75 |
|
BALANCE RATIOS |
|
|
|
|
|
Working Capital (€) |
-9.643,00 |
-11.675,15 |
-317,56 |
10.325,82 |
|
Working capital ratio |
-0,01 |
-0,11 |
0,00 |
0,19 |
|
Soundness Ratio |
0,36 |
0,38 |
0,62 |
0,97 |
|
Average Collection Period (days) |
25 |
1 |
5 |
26 |
|
Average Payment Period (days) |
117 |
64 |
93 |
131 |
|
LIQUIDITY RATIOS |
|
|
|
|
|
Current Ratio (%) |
95,44 |
73,47 |
97,77 |
184,03 |
|
Quick Ratio (%) |
37,77 |
4,79 |
8,61 |
24,13 |
|
DEBT RATIOS |
|
|
|
|
|
Borrowing percentage (%) |
59,45 |
9,15 |
21,52 |
51,26 |
|
External Financing Average Cost |
0,06 |
0,00 |
0,03 |
0,05 |
|
Debt Service Coverage |
5,48 |
0,19 |
0,79 |
4,20 |
|
Interest Coverage |
0,55 |
-2,13 |
4,50 |
306,65 |
|
GENERAL AND ACTIVITIES RATIOS |
|
|
|
|
|
Auto financing generated by sales (%) |
16,01 |
3,90 |
8,82 |
15,61 |
|
Auto financing generated by Assets (%) |
10,85 |
4,75 |
10,92 |
21,11 |
|
Breakdown Point |
1,03 |
0,99 |
1,04 |
1,17 |
|
Average Sales Volume per Employee |
131,38 |
92,87 |
125,18 |
172,51 |
|
Average Cost per Employee |
20,74 |
18,81 |
21,00 |
24,38 |
|
Assets Turnover |
0,68 |
1,04 |
1,64 |
1,99 |
|
Inventory Turnover (days) |
68 |
43 |
78 |
130 |
|
RESULTS RATIOS |
|
|
|
|
|
Return on Assets (ROA) (%) |
1,88 |
-1,95 |
3,27 |
19,75 |
|
Operating Profitability (%) |
7,23 |
4,46 |
11,50 |
23,98 |
|
Return on Equity (ROE) (%) |
2,25 |
-3,21 |
5,37 |
51,60 |
FOREIGN EXCHANGE RATES
|
Currency |
Unit
|
Indian Rupees |
|
US Dollar |
1 |
Rs.59.35 |
|
UK Pound |
1 |
Rs.92.11 |
|
Euro |
1 |
Rs.78.59 |
INFORMATION DETAILS
|
Report Prepared
by : |
MNL |
RATING EXPLANATIONS
|
RATING |
STATUS |
PROPOSED CREDIT LINE |
|
|
>86 |
Aaa |
Possesses an extremely sound financial base with the strongest capability
for timely payment of interest and principal sums |
Unlimited |
|
71-85 |
Aa |
Possesses adequate working capital. No caution needed for credit
transaction. It has above average (strong) capability for payment of interest
and principal sums |
Large |
|
56-70 |
A |
Financial & operational base are regarded healthy. General
unfavourable factors will not cause fatal effect. Satisfactory capability for
payment of interest and principal sums |
Fairly Large |
|
41-55 |
Ba |
Overall operation is considered normal. Capable to meet normal
commitments. |
Satisfactory |
|
26-40 |
B |
Capability to overcome financial difficulties seems comparatively
below average. |
Small |
|
11-25 |
Ca |
Adverse factors are apparent. Repayment of interest and principal sums
in default or expected to be in default upon maturity |
Limited with
full security |
|
<10 |
C |
Absolute credit risk exists. Caution needed to be exercised |
Credit not
recommended |
|
---- |
NB |
New Business |
---- |
This score serves as a reference to assess SC’s credit risk
and to set the amount of credit to be extended. It is calculated from a
composite of weighted scores obtained from each of the major sections of this report.
The assessed factors and their relative weights (as indicated through %) are as
follows:
Financial
condition (40%) Ownership
background (20%) Payment
record (10%)
Credit history
(10%) Market trend
(10%) Operational
size (10%)
This report is issued at your request without any
risk and responsibility on the part of MIRA INFORM PRIVATE LIMITED (MIPL)
or its officials.