MIRA
INFORM REPORT
|
Report Date : |
23.03.2013 |
IDENTIFICATION DETAILS
|
Name : |
AJINOMOTO
COMPANY [THAILAND] LIMITED |
|
|
|
|
Registered Office : |
5th Floor, Sri Ayudhya Building, 487/1 Sri Ayudhya Road, Thanon Phyathai, Rajthevee, Bangkok 10400 |
|
|
|
|
Country : |
Thailand |
|
|
|
|
Financials (as on) : |
31.03.2012 |
|
|
|
|
Date of Incorporation : |
29.04.1960 |
|
|
|
|
Com. Reg. No.: |
0105503000586 [Former :
87/2503] |
|
|
|
|
Legal Form : |
Private
Limited Company |
|
|
|
|
Line of Business : |
Manufacturer, Exporter &
Distributor of Food
Seasoning |
|
|
|
|
No. of Employees : |
1600 |
RATING & COMMENTS
|
MIRA’s Rating : |
Aa |
|
RATING |
STATUS |
PROPOSED CREDIT LINE |
|
|
71-85 |
Aa |
Possesses adequate working capital. No caution needed for credit
transaction. It has above average (strong) capability for payment of interest
and principal sums |
Large |
|
Status : |
Good |
|
Payment Behaviour : |
Regular |
|
Litigation : |
Clear |
NOTES:
Any query related to this report can be made
on e-mail: infodept@mirainform.com
while quoting report number, name and date.
ECGC Country Risk Classification List – June 30th, 2012
|
Country Name |
Previous Rating (31.03.2012) |
Current Rating (30.06.2012) |
|
Thailand |
B1 |
B1 |
|
Risk Category |
ECGC
Classification |
|
Insignificant |
A1 |
|
Low |
A2 |
|
Moderate |
B1 |
|
High |
B2 |
|
Very High |
C1 |
|
Restricted |
C2 |
|
Off-credit |
D |
thailand - ECONOMIC OVERVIEW
With a well-developed infrastructure, a free-enterprise economy, generally pro-investment policies, and strong export industries, Thailand enjoyed solid growth from 2000 to 2007 - averaging more than 4% per year - as it recovered from the Asian financial crisis of 1997-98. Thai exports - mostly machinery and electronic components, agricultural commodities, and jewelry - continue to drive the economy, accounting for more than half of GDP. The global financial crisis of 2008-09 severely cut Thailand's exports, with most sectors experiencing double-digit drops. In 2009, the economy contracted 2.3%. In 2010, Thailand's economy expanded 7.8%, its fastest pace since 1995, as exports rebounded from their depressed 2009 level. Steady economic growth at just below 4% during the first three quarters of 2011 was interrupted by historic flooding in October and November in the industrial areas north of Bangkok, crippling the manufacturing sector and leading to a revised growth rate of only 0.1% for the year. The industrial sector is poised to recover from the second quarter of 2012 onward, however, and the government anticipates the economy will probably grow between 5.5 and 6.5% for 2012, while private sector forecasts range between 3.8% and 5.7%.
|
Source : CIA |
Company name
AJINOMOTO COMPANY [THAILAND] LIMITED
SUMMARY
BUSINESS
ADDRESS : 5th FLOOR,
SRI AYUDHYA BUILDING,
487/1 SRI
AYUDHYA ROAD, THANON
PHYATHAI,
RAJTHEVEE, BANGKOK
10400, THAILAND
TELEPHONE : [66] 2245-1614,
2247-7000
FAX :
[66] 2246-3887,
2247-7016, 2248-7997
E-MAIL
ADDRESS : info@bkk.ajinomoto.com
REGISTRATION
ADDRESS : SAME
AS BUSINESS ADDRESS
ESTABLISHED
: 1960
REGISTRATION
NO. : 0105503000586 [Former : 87/2503]
TAX
ID NO. : 3101065893
CAPITAL REGISTERED : BHT. 796,362,800
CAPITAL PAID-UP : BHT.
796,362,800
SHAREHOLDER’S PROPORTION : THAI :
25.73%
FOREIGN :
74.27%
FISCAL YEAR CLOSING DATE : MARCH
31
LEGAL
STATUS : PRIVATE LIMITED
COMPANY
EXECUTIVE : MR.
YOICHIRO TOGASHI, JAPANESE
PRESIDENT
NO.
OF STAFF : 1,600
LINES
OF BUSINESS : FOOD
SEASONING
MANUFACTURER, EXPORTER
& DISTRIBUTOR
CORPORATE PROFILE
OPERATING
TREND : STABLE
PRESENT
SITUATION : OPERATING NORMALLY
REPUTATION : GOOD WITH
NORMAL BUSINESS ENGAGEMENT
MANAGEMENT
STANDARD : MANAGEMENT WITH
GOOD PERFORMANCE
HISTORY
The
subject was established
on April 29,
1960 as a
private limited company
under the name
style AJINOMOTO COMPANY [THAILAND]
LIMITED led by
Ajinomoto Ltd., Japan and
Thai investors, in order
to manufacture food seasoning
and animal nutrition
products for local
market. The “AJINOMOTO”
animal nutrition network
has 6 factories
producing “L-Lysine HCI” around
the world. They
are in France, U.S.A.,
China, Brazil, Italy
and Thailand.
The subject
was granted an investment privilege
promotional from the Board
of Investment [BOI],
under the certificate
No. 1641/2539 and 1020 (1)/2545, on
September 30, 1996
and January 9,
2002 respectively, for
its production. It
currently employs approximate 1,600
staff.
The
subject’s registered address
is 5th Flr., Sri Ayudhya
Bldg., 487/1 Sri Ayudhya
Rd., Thanon Phyathai,
Rajthevee, Bangkok 10400,
and this is
the subject’s current
operation address.
THE BOARD
OF DIRECTORS
|
Name |
|
Nationality |
Age |
|
|
|
|
|
|
Wing Com. Tinnakorn Bhankravi |
Chairman [x] |
Thai |
93 |
|
Mr. Yoichiro Togashi |
[x] |
Japanese |
59 |
|
Mr. Eiji Majima |
[x] |
Japanese |
54 |
|
Mr. Motoaki Nishii |
|
Japanese |
52 |
|
Mr. Apirat Rattanaparadorn |
|
Thai |
63 |
|
Mr. Vichai Chaipinchana |
|
Thai |
63 |
|
Mr. Tetsuya Nakano |
|
Japanese |
50 |
|
Mr. Suchart Narksawek |
|
Thai |
56 |
|
Mr. Suradech Thiapairat |
|
Thai |
57 |
|
Mr. Keichi Yokoyama |
|
Japanese |
63 |
AUTHORIZED PERSON
Any of the
mentioned directors [x]
can sign on
behalf of the
subject with company’s
affixed.
MANAGEMENT
Mr. Yoichiro Togashi
is the President.
He is Japanese
nationality with the
age of 59 years old.
Mr. Eiji Majima is
the Vice President.
He is Thai
nationality with the
age of 54
years old.
Mr. Motoaki Nishii is
the Director of
Consumer Food Business.
He is Japanese
nationality with the
age of 52
years old.
Mr. Varong Kraiyoonpong is
the Accounting &
Finance Manager.
He is Thai
nationality.
Mr. Thongdee Pasai
is the Factory
Manager [Pathumthani].
He is Thai
nationality.
Mr. Suradej Thiempairat
is the Factory
Manager [Kampaengpetch].
He is Thai
nationality.
Mr. Sorachai Kusanchai
is the Factory
Manager [Prapadaeng].
He is Thai
nationality.
Mr. Hideki Okamura
is the Factory
Manager [Saraburi].
He is Japanese
nationality.
Ms. Anita Klaisuban is
the Beverage Business
Department Manager.
She is Thai
nationality.
BUSINESS OPERATIONS
The subject is
engaged in manufacturing
of food ingredient,
food seasoning and
related products as
follows:
Products Brand
Food ingredient & enzyme products “AJINOMOTO”, “I PLUS G”,
“TECHNO”
“AJITIDE I
+G”, “ACTIVA TG”,
“CHOICE”
“ROSDEE COOK
CHOICE”, “MENTSUYA”,
“HON-DASHI”, “AJINOMOTO
DRESSING”
Seasoning products “AJINOMOTO”, “ROSDEE”, “SOUP DEE”,
“LITE SUGAR”, “ROSDEE KRUA
KROB
ROS”,
“TAKUMI-AJI”
Instant noodle products “YUM YUM”
Beverage products “CALPIS LACTO”,
“BIRDY”, “SKINFIT”,
“BRANE FIT”
Processed food products “BIRDY
3 IN 1”,
“VONO”,
“BIRDY CANDY”
Animal nutrition products “AJINOMOTO”
Frozen food products “AJINOMOTO”
In Thailand, AJINOMOTO
food ingredients are
made from molasses
derived from sugarcane
and tapioca starch
from cassava roots
through the Fermentation
Process.
PURCHASE
80%
of its natural
raw materials such
as tapioca starch,
sugarcane molasses and
etc., are purchased from local
suppliers and planters,
and the remaining
20% especially chemical
is imported from
Japan, Singapore, Republic of
China, United States
of America, U.K.,
Australia, Taiwan and
Germany.
MAJOR
SUPPLIERS
Ajinomoto Ltd. :
Japan
Ajinomoto Calpis Beverage
[Thailand] Co., Ltd. : Thailand
Ajinomoto Frozen Foods
[Thailand] Co., Ltd. :
Thailand
AQY Sauce Co.,
Ltd. :
Thailand
SALES
[LOCAL]
90%
of the products
is sold locally
to food manufacturers, wholesalers
and end-users, the
remaining 10% is
exported to Japan.
MAJOR
CUSTOMER
Ajinomoto
Sales [Thailand] Co.,
Ltd.
PARENT
COMPANY
Ajinomoto Ltd.
Address : 15-1 Kyobashi 1-Chome, Chuo-Ku,
Tokyo, Japan
SUBSIDIARY COMPANIES
Myanmar Ajinomoto Ltd.
Business Type : Manufacturer
of food seasoning
products
Investment : The
subject holds 99.80%
of the company’s shares.
Myanmar Ajinomoto Industry
Co., Ltd.
Business Type : Manufacturer
of food seasoning
products
Investment : The
subject holds 100%
of the company’s
shares.
ASSOCIATED COMPANIES
Wan Thai Foods
Industry Co., Ltd.
Business Type: Manufacturer of
noodle products
Ajinomoto Sales [Thailand]
Co., Ltd.
Business Type: Manufacturer & distributing of
beverage products
Si Ayuthaya Real
Estate Co., Ltd.
Business Type : Real estate
business
Erawan Industrial Development
Co., Ltd.
Business Type :
Distributor of food
products
Ajitrade [Thailand] Co., Ltd.
Business Type :
Importer and distributor
of industrial machines
and equipments
Bangkok Animal Research
Center Co., Ltd.
Business Type :
Animal production technology
research & development
ACE Pack [Thailand]
Co., Ltd..
Business Type :
Distributor of packaging
products
Ajinomoto Engineering 2001
[Thailand] Co., Ltd.
Business Type :
Construction and engineering
service
AB Logistics [Thailand]
Co., Ltd.
Business Type :
Transportation &
logistics service
F D Green [Thailand]
Co., Ltd.
Business Type :
Manufacturer & distributor
Ajinomoto Betagro Specialty
Foods Co., Ltd.
Business Type :
Manufacturer of food
products
Ajinomoto Calpis Beverage
[Thailand] Co., Ltd.
Business Type :
Manufacturer & distributor
of beverage products
Itoham Betagro Foods
Co., Ltd.
Business Type :
Manufacturer of beverage
products
Fuji Ace Co.,
Ltd.
Business Type :
Manufacturer of plastic
film and packaging
service provider
AET Manufacturing Co.,
Ltd.
Business Type :
Manufacturer of rubber
lining products
Ajinomoto Frozen Foods
[Thailand] Co., Ltd.
Business Type :
Manufacturer of frozen
foods
A Q Y Sauce Co., Ltd.
Business Type :
Manufacturer of soy
sauce products
LITIGATION
Bankruptcy and
Receivership
There are no
litigation on bankruptcy
and receivership cases
filed against the
subject found at
Legal Execution Department
for the past
five years.
Others
There are no
legal suits filed
against the subject
for the past
two years.
CREDIT
Sales
are on the
credits term of 30-60 days.
Local
bills are paid
by cash or
on the credits
term of 30-60-90
days.
Imports
are by L/C
at sight or
T/T.
Exports
are against T/T.
BANKING
Kasikornbank
Public Co., Ltd.
[Head Office : 1 Kasikorn Lane,
Rajburana Rd., Rajburana, Bangkok 10140]
Bank
of Tokyo-Mitsubishi Corporation
[Bangkok Branch : 54 North
Sathorn Rd., Silom,
Bangrak, Bangkok 10500]
Krung
Thai Bank Public
Co., Ltd.
[Head Office : 35 Sukhumvit Rd.,
Klongtoeynua, Wattana, Bangkok
10110]
Thanachart
Bank Public Co., Ltd.
[Head Office : 1101 New
Petchburi Rd., Rajthevee,
Bangkok 10400]
EMPLOYMENT
The
subject employs approximately
1,600 staff [office
staff and factory
workers].
LOCATION
DETAILS
The
premise is rented
for administrative office
at the heading
address. Premise is
located in commercial area.
Factories
:
Factory
I : 6 Moo 2, Suksawad
Rd., Bangkru, Phrapradaeng,
Samutprakarn 10270
Factory
II : 99 Moo 1,
Bangkradeesainai Rd., Bangkradee,
Muang, Pathumthani 12000
Factory
III : 369 Moo 3,
Saikampaengphet-Thamakua
Rd., Kontee, Muang,
Kampaengphet
62000
Factory
IV : 58/1 Moo 1,
Pathumthanee-Ladlumkaew Rd., Ladlumkaew,
Pathumthanee
12000
Factory
V : 45 Moo 14,
Phaholyothin Rd., Kokyae,
Nongkae, Saraburi 18140
Factory
VI : 55/5 Moo 2,
Bangrakam, Nakornluang, Ayuthaya
13260
COMMENT
Ajinomoto
Co., (Thailand) Ltd. was
formed in 1960,
as the first overseas
production base of
Ajinomoto Co., Inc., Japan. As of
now, the company
has gone through
immense diversification, with the
establishment of 18
group companies employing
over 5,000 staff
in the manufacture of
a variety products. With its
advanced technology, only
high quality products
have been produced
that meet all
of consumers’ needs.
Its various products
have long been
trusted by consumers
both household and
commercial.
Growth
from strong domestic
consumption remains upbeat.
FINANCIAL INFORMATION
The
capital was initially
registered at Bht.
25,000,000 divided into
25,000 shares of Bht. 1,000
each.
The
capital was increased
later as follows:
Bht. 384,048,500
on May 16,
1988
Bht. 460,858,200
on May 18,
1989
Bht. 663,635,700
on June 24,
1991
Bht. 796,362,800
on July 1,
1992
The
latest registered capital was
increased to Bht. 796,362,800
divided into 7,963,628 shares
of Bht. 100 each
with fully paid.
THE
SHAREHOLDERS LISTED WERE
: [as at
June 1, 2012]
|
NAME |
HOLDING |
% |
|
|
|
|
|
Ajinomoto Ltd. Nationality: Japanese Address : 15-1
Kyobashi 1-Chome, Chuo-Ku, Tokyo Japan |
5,913,920 |
74.26 |
|
Thanachart Bank Public
Co., Ltd. Nationality: Thai Address : 1101
New Petchburi Rd.,
Rajthevee,
Bangkok 10400 |
477,816 |
6.00 |
|
Kasikornbank Public Co.,
Ltd. Nationality: Thai Address : 1
Rajburana Rd., Rajburana,
Bangkok 10140 |
398,183 |
5.00 |
|
Ajinomoto Foundation Nationality: Thai Address : 487/1
Sri Ayudhya Rd.,
Rajthevee,
Bangkok 10400 |
289,586 |
3.64 |
|
Si Ayuthaya Real
Estate Co., Ltd. Nationality: Thai Address : 487/1
Sri Ayudhya Rd.,
Rajthevee,
Bangkok 10400 |
195,334 |
2.45 |
|
Ajinomoto Sales [Thailand]
Co., Ltd. Nationality: Thai Address : 487/1
Sri Ayudhya Rd.,
Rajthevee,
Bangkok 10400 |
159,784 |
2.01 |
|
Others |
529,005 |
6.64 |
Total Shareholders : 243
Share Structure [as
at June 1,
2012]
|
Nationality |
Shareholders |
No. of Share |
% Shares |
|
|
|
|
|
|
Thai |
242 |
2,049,348 |
25.73 |
|
Foreign - Japanese |
1 |
5,913,920 |
74.27 |
|
Total |
243 |
7,963,628 |
100.00 |
NAME OF AUDITOR
& CERTIFIED PUBLIC
ACCOUNTANT NO. :
Mrs. Nisakorn Songmanee No.
5035
BALANCE SHEET [BAHT]
The latest financial figures published for March 31, 2012, 2011 & 2010 were:
ASSETS
|
Current
Assets |
2012 |
2011 |
2010 |
|
|
|
|
|
|
Cash and Cash Equivalents |
6,732,237,451 |
10,741,592,590 |
7,994,038,799 |
|
Cash at Bank Pledged as
a Collateral |
- |
- |
129,232,800 |
|
Trade Account & Other
Receivable |
|
|
|
|
Trade Account Receivable |
1,869,510,198 |
2,008,992,338 |
1,949,513,584 |
|
Forward Contract Receivable |
268,978,933 |
18,868,160 |
178,299,301 |
|
Current Portion
of Long-term Lending to Director & Employees |
8,038,902 |
7,062,172 |
5,296,295 |
|
Deferred Interest |
36,783,710 |
71,038,515 |
74,154,532 |
|
Prepaid payment Expenses |
24,523,831 |
19,943,086 |
- |
|
Advance Payment |
13,969,554 |
26,301,277 |
- |
|
Short Term Lending
to Related Company |
6,100,818,042 |
4,009,627,232 |
4,068,539,308 |
|
Inventories |
3,894,288,069 |
3,227,691,392 |
3,363,728,392 |
|
Refundable Value Added Tax |
238,809,680 |
157,499,471 |
774,363,873 |
|
Other Current Assets
|
114,148,194 |
81,575,643 |
102,740,809 |
|
Total Current Assets
|
19,302,106,564 |
20,370,191,876 |
18,639,907,693 |
|
Non-current Assets |
|
|
|
|
Investment in
Associated |
489,171,543 |
492,592,586 |
583,467,254 |
|
Investment in
Subsidiaries |
168,556,589 |
69,131,132 |
- |
|
Other Long
Term Investment |
265,368,850 |
266,621,350 |
267,591,350 |
|
Long Term
Lending to Related Company |
2,642,538 |
2,596,068 |
2,774,021 |
|
Long-term Lending to Director & Employees |
16,577,708 |
10,618,011 |
5,442,652 |
|
Fixed Assets |
12,883,255,479 |
8,926,737,346 |
7,784,296,955 |
|
Intangible Assets |
68,050,498 |
69,541,959 |
75,849,157 |
|
Deferred Income Tax |
- |
11,219,692 |
- |
|
Total Non-current
Assets |
13,893,623,205 |
9,849,058,144 |
8,719,421,389 |
|
Total Assets |
33,195,729,769 |
30,219,250,020 |
27,359,329,082 |
LIABILITIES &
SHAREHOLDERS' EQUITY [BAHT]
|
Current Liabilities |
2012 |
2011 |
2010 |
|
|
|
|
|
|
Trade Accounts & Other
Payable |
1,155,839,933 |
1,012,308,605 |
1,006,185,098 |
|
Payable Construction |
1,410,860,521 |
623,101,384 |
210,450,945 |
|
Accrued Copy Right |
235,043,072 |
213,213,828 |
206,822,857 |
|
Accrued Expenses |
398,777,596 |
318,911,010 |
331,208,238 |
|
Accrued Income Tax |
916,743,086 |
801,821,668 |
377,117,485 |
|
Other Current Liabilities |
17,444,312 |
17,613,715 |
11,987,623 |
|
Total Current Liabilities |
4,134,708,520 |
2,986,970,210 |
2,143,772,246 |
|
Employee Benefits Obligation |
128,651,914 |
112,693,277 |
97,069,745 |
|
Deferred Income Tax
Liabilities |
44,910,499 |
- |
42,286,137 |
|
Total Liabilities |
4,308,270,933 |
3,099,663,487 |
2,283,128,128 |
|
|
|
|
|
|
Shareholders' Equity |
|
|
|
|
|
|
|
|
|
Share capital : Baht 100
par value authorized, issued
and fully paid share
capital 7,963,628 shares |
796,362,800 |
796,362,800 |
796,362,800 |
|
Capital Paid |
796,362,800 |
796,362,800 |
796,362,800 |
|
Statutory Reserve |
79,636,280 |
79,636,280 |
79,636,280 |
|
General Reserve |
20,500,000,000 |
19,000,000,000 |
17,500,000,000 |
|
Retained Earning -
Unappropriated |
7,511,789,756 |
7,245,034,953 |
6,701,649,374 |
|
Other Components of
Shareholder’s Equity |
[330,000] |
[1,447,500] |
[1,447,500] |
|
Total Shareholders' Equity |
28,887,458,836 |
27,119,586,533 |
25,076,200,954 |
|
Total Liabilities &
Shareholders' Equity |
33,195,729,769 |
30,219,250,020 |
27,359,329,082 |
PROFIT &
LOSS ACCOUNT
|
Revenue |
2012 |
2011 |
2010 |
|
|
|
|
|
|
Sales |
22,919,639,460 |
22,148,035,827 |
20,452,908,673 |
|
Interest Income |
321,529,289 |
265,186,508 |
165,705,260 |
|
Dividend Income |
39,308,757 |
19,611,329 |
14,664,180 |
|
Gain on Exchange Rate |
186,526,564 |
- |
- |
|
Other Income |
330,730,289 |
300,480,421 |
269,831,960 |
|
Total Revenues |
23,797,734,359 |
22,733,314,085 |
20,903,110,073 |
|
Expenses |
|
|
|
|
|
|
|
|
|
Cost of Goods
Sold |
16,094,348,500 |
15,190,624,725 |
13,327,018,660 |
|
Selling Expenses |
1,144,069,421 |
1,166,991,568 |
1,071,820,663 |
|
Administrative Expenses |
926,638,808 |
778,584,836 |
736,349,847 |
|
Loss on Exchange Rate |
- |
5,459,882 |
34,366,335 |
|
Loss on Flood |
62,654,120 |
- |
- |
|
Total Expenses |
18,227,710,849 |
17,141,661,011 |
15,169,555,505 |
|
Profit / [Loss] from Income Tax |
5,570,023,510 |
5,591,653,074 |
5,733,554,568 |
|
Income Tax |
[1,573,452,867] |
[1,127,324,583] |
[878,485,831] |
|
Net Profit / [Loss] |
3,996,570,643 |
4,464,328,491 |
4,855,068,737 |
FINANCIAL ANALYSIS
|
ITEM |
UNIT |
2012 |
2011 |
2010 |
|
|
|
|
|
|
|
LIQUIDITY RATIO |
|
|
|
|
|
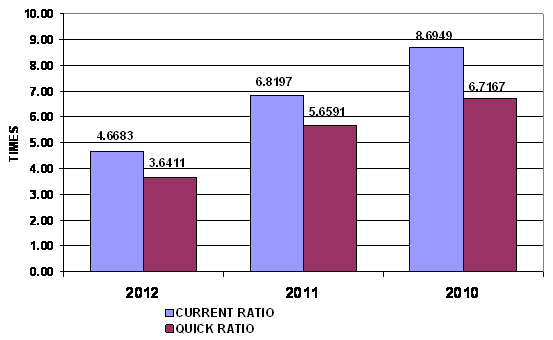
CURRENT RATIO |
TIMES |
4.67 |
6.82 |
8.69 |
|
QUICK RATIO |
TIMES |
3.64 |
5.66 |
6.72 |
|
|
|
|
|
|
|
ACTIVITY RATIO |
|
|
|
|
|
FIXED ASSETS TURNOVER |
TIMES |
1.78 |
2.48 |
2.63 |
|
TOTAL ASSETS TURNOVER |
TIMES |
0.69 |
0.73 |
0.75 |
|
INVENTORY CONVERSION PERIOD |
DAYS |
88.32 |
77.55 |
92.13 |
|
INVENTORY TURNOVER |
TIMES |
4.13 |
4.71 |
3.96 |
|
RECEIVABLES CONVERSION PERIOD |
DAYS |
29.77 |
33.11 |
34.79 |
|
RECEIVABLES TURNOVER |
TIMES |
12.26 |
11.02 |
10.49 |
|
PAYABLES CONVERSION PERIOD |
DAYS |
26.21 |
24.32 |
27.56 |
|
CASH CONVERSION CYCLE |
DAYS |
91.88 |
86.34 |
99.36 |
|
|
|
|
|
|
|
PROFITABILITY
RATIO |
|
|
|
|
|
COST OF GOODS SOLD |
% |
70.22 |
68.59 |
65.16 |
|
SELLING & ADMINISTRATION |
% |
9.03 |
8.78 |
8.84 |
|
INTEREST |
% |
- |
- |
- |
|
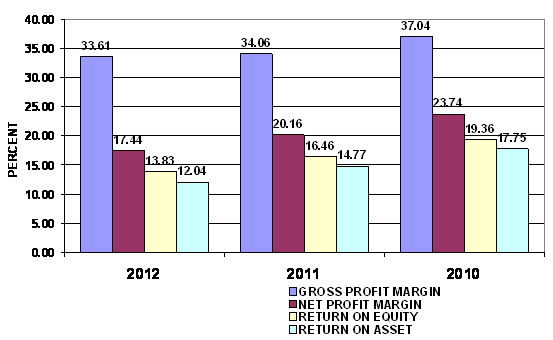
GROSS PROFIT MARGIN |
% |
33.61 |
34.06 |
37.04 |
|
NET PROFIT MARGIN BEFORE EX. ITEM |
% |
24.30 |
25.25 |
28.03 |
|
NET PROFIT MARGIN |
% |
17.44 |
20.16 |
23.74 |
|
RETURN ON EQUITY |
% |
13.83 |
16.46 |
19.36 |
|
RETURN ON ASSET |
% |
12.04 |
14.77 |
17.75 |
|
EARNING PER SHARE |
BAHT |
501.85 |
560.59 |
609.66 |
|
|
|
|
|
|
|
LEVERAGE RATIO |
|
|
|
|
|
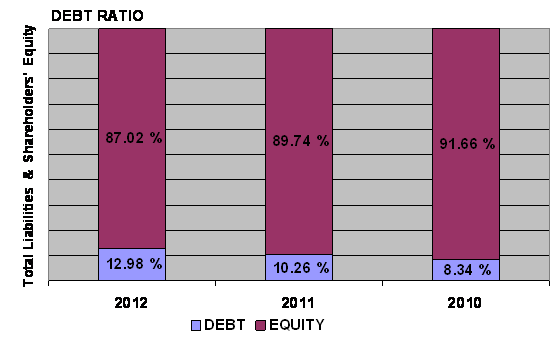
DEBT RATIO |
TIMES |
0.13 |
0.10 |
0.08 |
|
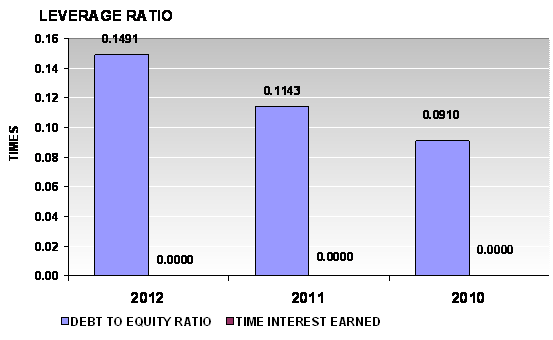
DEBT TO EQUITY RATIO |
TIMES |
0.15 |
0.11 |
0.09 |
|
TIME INTEREST EARNED |
TIMES |
- |
- |
- |
|
|
|
|
|
|
|
ANNUAL GROWTH |
|
|
|
|
|
SALES GROWTH |
% |
3.48 |
8.29 |
|
|
OPERATING PROFIT |
% |
(0.39) |
(2.47) |
|
|
NET PROFIT |
% |
(10.48) |
(8.05) |
|
|
FIXED ASSETS |
% |
44.32 |
14.68 |
|
|
TOTAL ASSETS |
% |
9.85 |
10.45 |
|
ANNUAL GROWTH :
SATISFACTORY
An annual sales growth is 3.48%. Turnover has increased from THB
22,148,035,827.00 in 2011 to THB 22,919,639,460.00 in 2012. While net profit
has decreased from THB 4,464,328,491.00 in 2011 to THB 3,996,570,643.00 in
2012. And total assets has increased from THB 30,219,250,020.00 in 2011 to THB
33,195,729,769.00 in 2012.
PROFITABILITY :
IMPRESSIVE
PROFITABILITY
RATIO
|
Gross Profit Margin |
33.61 |
Impressive |
Industrial Average |
19.26 |
|
Net Profit Margin |
17.44 |
Impressive |
Industrial Average |
6.66 |
|
Return on Assets |
12.04 |
Impressive |
Industrial Average |
11.74 |
|
Return on Equity |
13.83 |
Acceptable |
Industrial Average |
20.65 |
Gross Profit Margin used to assess a firm's financial health by revealing
the proportion of money left over from revenues after accounting for the cost
of goods sold. Gross profit margin serves as the source for paying additional
expenses and future savings. The
company’s figure is 33.61%. When compared with the industry
average, the ratio of the company was higher, indicated that company was more
profitable than the same industry.
Net Profit Margin is the indicator of the company's efficiency in that
net profit takes into consideration all expenses of the company. A low profit
margin indicates a low margin of safety, higher risk that a decline in sales
will erase profits and result in a net loss. The company’s figure is 17.44%, higher figure when compared with
those of its average competitors in the same industry, indicated that business
was an efficient operator in a dominant
position within its industry.
Return on Assets measures how efficiently profits are being generated
from the assets employed in the business when compared with the ratios of firms
in a similar business. A low ratio in comparison with industry averages
indicates an inefficient use of business assets. Return on Assets ratio is
12.04%, higher figure when compared with those of its average competitors in
the same industry, indicated that business was an efficient profits in a
dominant position within its industry.
Return on Equity indicates how profitable a company is by comparing its
net income to its average shareholders' equity, ROE measures how much the
shareholders earned for their investment in the company. When compared with the
industry average, it was lower, the company's figure is 13.83%.
Trend of the
average competitors in the same industry for last 5 years
Return on Assets Uptrend
Return on Equity Uptrend
LIQUIDITY :
SATISFACTORY
LIQUIDITY RATIO
|
Current Ratio |
4.67 |
Impressive |
Industrial Average |
2.09 |
|
Quick Ratio |
3.64 |
|
|
|
|
Cash Conversion Cycle |
91.88 |
|
|
|
The Current Ratio is to ascertain whether a company's short-term assets
are readily available to pay off its short-term liabilities. The company's
figure is 4.67 times in 2012, decreased from 6.82 times, then it is generally
considered to have good short-term financial strength. When compared with the
industry average, the ratio of the company was higher, indicated that company
was an efficient operator in a dominant position within its industry.
The Quick Ratio is a liquidity indicator that further refines the
current ratio by measuring the amount of the most liquid current assets there
are to cover current liabilities. The company's figure is 3.64 times in 2012,
decreased from 5.66 times, although excluding inventory so the company still
have good short-term financial strength.
The Cash Conversion Cycle measures the number of days a company's cash
is tied up in the production and sales process of its operations and the
benefit from payment terms from its creditors. It meant the company could
survive when no cash inflow was received from sale for 92 days.
Trend of the
average competitors in the same industry for last 5 years
Current Ratio Uptrend
LEVERAGE :
EXCELLENT
LEVERAGE RATIO
|
Debt Ratio |
0.13 |
Impressive |
Industrial Average |
0.41 |
|
Debt to Equity Ratio |
0.15 |
Impressive |
Industrial Average |
0.78 |
|
Times Interest Earned |
- |
|
Industrial Average |
12.75 |
Debt to Equity Ratio a measurement of how much suppliers, lenders,
creditors and obligors have committed to the company versus what the
shareholders have committed. A lower the percentage means that the company is
using less leverage and has a stronger equity position.
Debt Ratio shows the proportion of a company's assets which are financed
through debt. The company's figure is 0.13 less than 0.5, most of the company's
assets are financed through equity.
Trend of the
average competitors in the same industry for last 5 years
Debt Ratio Uptrend
Times Interest Earned Uptrend
ACTIVITY :
ACCEPTABLE

ACTIVITY RATIO
|
Fixed Assets Turnover |
1.78 |
Acceptable |
Industrial Average |
3.35 |
|
Total Assets Turnover |
0.69 |
Deteriorated |
Industrial Average |
1.91 |
|
Inventory Conversion Period |
88.32 |
|
|
|
|
Inventory Turnover |
4.13 |
Deteriorated |
Industrial Average |
8.55 |
|
Receivables Conversion Period |
29.77 |
|
|
|
|
Receivables Turnover |
12.26 |
Impressive |
Industrial Average |
6.34 |
|
Payables Conversion Period |
26.21 |
|
|
|
The company's Account Receivable Ratio is calculated as 12.26 and 11.02
in 2012 and 2011 respectively. This ratio measures the efficiency of the
company in managing its trade debtors to generate revenue. A lower ratio may
indicate over extension and collection problems. Conversely, a higher ratio may
indicate an overtly stringent policy. In this case, the company's A/R ratio in
2012 increased from 2011. This would suggest the company had good performance
in the management of its debt collections.
Inventory Turnover in Days Ratio indicates the liquidity of inventory.
It estimates the number of days that it will take to sell the current
inventory. Inventory is particularly sensitive to change in business
activities. The inventory turnover in days has increased from 78 days at the
end of 2011 to 88 days at the end of 2012. This represents a negative trend.
And Inventory turnover has decreased from 4.71 times in year 2011 to 4.13 times
in year 2012.
The company's Total Asset Turnover is calculated as 0.69 times and 0.73
times in 2012 and 2011 respectively. This ratio is determined by dividing total
assets into total sales turnover. The ratio measures the activity of the assets
and the ability of the firm to generate sales through the use of the assets.
Trend of the
average competitors in the same industry for last 5 years
Fixed Assets Turnover Uptrend
Total Assets Turnover Uptrend
Inventory Turnover Uptrend
Receivables Turnover Uptrend
|
Currency |
Unit
|
Indian Rupees |
|
US Dollar |
1 |
Rs.54.34 |
|
UK Pound |
1 |
Rs.82.56 |
|
Euro |
1 |
Rs.70.10 |
INFORMATION DETAILS
|
Report Prepared
by : |
MNL |
RATING EXPLANATIONS
|
RATING |
STATUS |
PROPOSED CREDIT LINE |
|
|
>86 |
Aaa |
Possesses an extremely sound financial base with
the strongest capability for timely payment of interest and principal sums |
Unlimited |
|
71-85 |
Aa |
Possesses adequate working capital. No caution
needed for credit transaction. It has above average (strong) capability for
payment of interest and principal sums |
Large |
|
56-70 |
A |
Financial & operational base are regarded
healthy. General unfavourable factors will not cause fatal effect.
Satisfactory capability for payment of interest and principal sums |
Fairly Large |
|
41-55 |
Ba |
Overall operation is considered normal. Capable
to meet normal commitments. |
Satisfactory |
|
26-40 |
B |
Capability to overcome financial difficulties
seems comparatively below average. |
Small |
|
11-25 |
Ca |
Adverse factors are apparent. Repayment of
interest and principal sums in default or expected to be in default upon
maturity |
Limited with
full security |
|
<10 |
C |
Absolute credit risk exists. Caution needed to be
exercised |
Credit not
recommended |
|
---- |
NB |
New Business |
---- |
This
score serves as a reference to assess SC’s credit risk and to set the amount of
credit to be extended. It is calculated from a composite of weighted scores
obtained from each of the major sections of this report. The assessed factors
and their relative weights (as indicated through %) are as follows:
Financial condition (40%) Ownership background (20%) Payment record (10%)
Credit history (10%) Market trend (10%) Operational size (10%)
This report is issued at your request without any
risk and responsibility on the part of MIRA INFORM PRIVATE LIMITED (MIPL)
or its officials.