MIRA INFORM REPORT
|
Report Date : |
25.03.2013 |
IDENTIFICATION DETAILS
|
Name : |
STE DE
PRODUCTION ET D'IMPORTATION DES PROQUITS MANUFACTURES |
|
|
|
|
Registered Office : |
Rue G Route Secondaire 110 ‑ Ain Sebaa,
Casablanca |
|
|
|
|
Country : |
Morocco |
|
|
|
|
Financials (as on) : |
31.12.2011 |
|
|
|
|
Date of Incorporation : |
01.08.1957 |
|
|
|
|
Com. Reg. No.: |
25673 |
|
|
|
|
Legal Form : |
Societe A Responsibilite Limitee |
|
|
|
|
Line of Business : |
Manufacture of made‑up textile articles,
except apparel |
|
|
|
|
No. of Employees : |
120 |
RATING & COMMENTS
|
MIRA’s Rating : |
Ba |
|
RATING |
STATUS |
PROPOSED CREDIT LINE |
|
|
41-55 |
Ba |
Overall operation is considered normal. Capable to meet normal
commitments. |
Satisfactory |
|
Status : |
Satisfactory |
|
Payment Behaviour : |
No Complaints |
|
Litigation : |
Clear |
NOTES :
Any query related to this report can be made
on e-mail: infodept@mirainform.com
while quoting report number, name and date.
ECGC Country Risk Classification List – June 30th, 2012
|
Country Name |
Previous Rating (31.03.2011) |
Current Rating (30.06.2012) |
|
Morocco |
A2 |
A2 |
|
Risk Category |
ECGC
Classification |
|
Insignificant |
A1 |
|
Low |
A2 |
|
Moderate |
B1 |
|
High |
B2 |
|
Very High |
C1 |
|
Restricted |
C2 |
|
Off-credit |
D |
MOROCCO - ECONOMIC OVERVIEW
Morocco has capitalized on its proximity to Europe and relatively low labor costs to build a diverse, open, market-oriented economy. In the 1980s Morocco pursued austerity measures and pro-market reforms, overseen by the IMF. Since taking the throne in 1999, King MOHAMMED VI has presided over a stable economy marked by steady growth, low inflation, and generally declining government debt. Industrial development strategies and infrastructure improvements - most visibly illustrated by a new port and free trade zone near Tangier - are improving Morocco's competitiveness. Key sectors of the economy include agriculture, tourism, phosphates, textiles, apparel, and subcomponents. In 2006 Morocco entered into a bilateral Free Trade Agreement with the United States; it remains the only African country to have one. In 2008 Morocco entered into an Advanced Status agreement with the European Union. Despite Morocco's economic progress, the country suffers from high unemployment and poverty. In 2011, high food and fuel prices strained the government's budget and widened the country's current account deficit. Key economic challenges for Morocco include fighting corruption, reducing government spending, reforming the education system and judiciary, addressing socioeconomic disparities, and building more diverse, higher value-added industries.
Source
: CIA
Company name
STE DE PRODUCTION ET D'IMPORTATION DES PROQUITS MANUFACTURES
Registration Briefing
Registration Number: 25673
Registration Date: 01/08/1957
Legal Form: SOCIETE
A RESPONSIBILITE LIMITEE
Latest Financials: December 31,
2011
Financial Briefing
Nominal Capital: 30,000,000
Moroccan Dirham
Issued Capital: N/A
Turnover: 69,000,000
Moroccan Dirham
Net Profit: N/A
Net Worth: 36,556,719
Moroccan Dirham
Company Details
Company Name: STE DE PRODUCTION ET
D'IMPORTATION DES
PROQUITS
MANUFACTURES
Also trades as: SOPIDAM
Headquarter Address: Rue Fatima Bent Akah
(Ex G),
Q.I
Ain Sebaa,
Casablanca
20250,
Morocco
Telephone: +212522
351848
+212522
355568
Fax: +212522
354304
E‑Mail: sopidam@wanadoo.net.ma
Company was originally started on
01/08/1957
Registration & Legal
Details
Current Legal Form: SOCIETE A RESPONSIBILITE LIMITEE
Registration Address: Rue G Route Secondaire
110 ‑ Ain Sebaa,
Casablanca
Registration Number: 25673
Registration Date: 01/08/1957
Year/Date Company Established: 01/08/1957
Registration Town: Casablanca
Tax Registration Number: 01900295
Capital
Currency: Moroccan
Dirham
Authorized Capital: 30,000,000
Paid Up Capital: 30,000,000
Authorized Capital
Breakdown
Number of Shares: 300,000 Type of Shares: None Selected
Issued Shares: 300,000 Value per share: MDH
100.00 Value of this type:
30,000,000.00
Shareholders / Owners
Shareholders:
Name/Other Information Shares
Held % of Voting/Non‑Voting
capital
Mr. Abdellatif Lahbabi
& Family, 300,000 100.00%
(VOTING)
Casablanca,
Morocco
Principals
Name: Mr
Abdellatif Lahbabi
Position within the
company: President and
managing director
Date of Birth: 14/04/1942
Country of Birth: Morocco
Nationality: Moroccan
Can fluently speak: Arabic & French
Name: Mr
Redouane Essaidi
Position within the
company: Financial Manager
Country of Birth: Morocco
Nationality: Moroccan
Can fluently speak: Arabic & French
Company Activities
NACE Codes: 1392 Manufacture
of made‑up textile articles, except apparel
The company SOPIDAM is specialized in manufacture and wholesale of non‑weaved
fabrics, synthetic foam, bed lining and pillows.
Local Reporters consider the
investigated company to be MEDIUM in their field of concern.
Operations
Employees Company
Employs: 120
HQ Premises Operates
from: Owned Office , Factory, Warehouse
Premises
Size: 7200 square meters
14700
square meters site
Location: Industrial Area
Branches 5
Boulevard Aba Chouaib Doukali,
Casablanca,
Morocco
Branch
is: Rented
Description
of branch: Warehouse
Imports
Import
% and type of product: 60% Raw Materials
Imports
From: Pakistan,
Korea (South), India
Importing
Terms: Letters of
credit
Exports
Export
% and type of product: Subject does not
export
Trading & Selling
Territory: 100%
Nationally
Type
of Customer: Wholesalers
Vehicles: Total
number of vehicles:
8
trucks
Related Companies
Subsidiaries
Affiliates
Information on
Related Companies is not available/applicable
Bankers
Société Générale,
Branch: Abdelmoumen
55 Boulevard Abdelmoumen,
Casablanca,
Morocco
Attijariwafa Bank,
Branch: Mandarouna
Lotissement Attaoufik,
Angle Rue 1 & Boulevard 63 ‑
Sidi Maarouf,
Casablanca,
Morocco
Financial Information
Source: Mr.
Redouane Essaidi Financial Manager
Figures are: Estimates
Currency: Moroccan
Dirham
Months Sales Figures Sales Gross
Profit/Loss Net Profit/Loss
12 31/12/2012 69,000,000
12 31/12/2011 62,244,004 1,322,402 906,700
12 31/12/2010 69,432,201 1,649,670 1,182,461
Balance Sheet & Profit
& Loss
BALANCE SHEET
As
at: 31‑Dec‑2011 As at: 31‑Dec‑2010
Fixed Assets
Land & Buildings 1,209,937 1,353,061
Plant & Machinery 2,642,788 3,661,980
Furniture & Equipment 235,614 249,617
Motor Vehicles 23,624 23,583
Misc. Fixed Assets 1,988,750 1,070,496
Total Fixed
Assets 6,100,713 6,358,737
Financial Assets
Shares in Related Companies 20,000 20,000
Loans to related companies
Investments
Deposits
Misc. Financial Assets 130,652 130,652
Total
Financial Assets 150,652 150,652
Intangibles
Goodwill
Organisational Expenses 1,272,421 1,090,832
Patents 110,458 160,767
Misc. Intangible Assets 20,500 20,500
Total
Intangible Assets 1,403,379 1,272,099
Current Assets
Stock 31,242,649 27,913,420
Stock & Work in Progress
Trade Debtors & receivables 32,473,262 24,094,179
Provision for bad debs
Other receivables 126,659 85,818
Due from related companies
Owed by shareholders
Prepaid expenses 79,527 47,283
Cash 816,562 1,174,271
Tax recoverable 4,620,227 4,050,617
Marketable Securities
Misc. Current Assets 189,087 394,567
Total
Current Assets 69,547,973 57,760,155
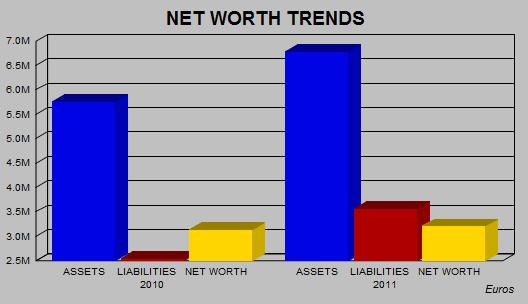
Total Assets 77,202,717 65,541,643
Owner's Equity & Liabilities
Issued and paid up capital 30,000,000 30,000,000
Share premium account
Retained earnings 5,199,971 4,076,634
Net profit/Loss for the year 906,700 1,182,461
Revaluation reserves
Legal Reserves 450,048 390,925
Other reserves
Net Worth 36,556,719 35,650,020
Deffered Taxation
Provisions/allowances 1,441,002 2,071,070
Mortgages/Loans
Hire purchase
Due to group of companies
Minority interest
Misc. deferred liabilities
Total Long
Term Liabilities 1,441,002 2,071,070
Current Liabilities
Creditors 20,329,531 14,736,330
Other creditors 24,244 21,101
Accruals
Bank overdrafts/Loans 12,677,003 8,140,886
Misc. Loans
Directors accounts
Owing to shareholders 1,965,757 455,832
Owing to related companies
Proposed dividend
Long Term‑due 1 year
Hire Purchase‑under 1 year
Taxation 3,685,422 4,015,742
Advance receipts
Misc. Current Liabilities 523,039 450,662
Total
Current Liabilities 39,204,996 27,820,553
Owner's
Equity & Liabilities 77,202,717 65,541,643
PROFIT & LOSS
Figures
are: Figures
are:
Fiscal
Year Fiscal
Year
01/01/2011
to 31/12/2011 01/01/2010 to
31/12/2010
Total Income/Turnover 62,244,004 69,432,201
Cost of sales 137,944
Gross Profit/(Loss) 62,244,004 69,294,257
Admin/selling expenses 40,591,869 45,862,863
Services 9,229,652 12,337,237
Salaries 6,120,105 6,793,397
Auditors Fee 349,260 459,766
Stock Depreciation 2,651,318 ‑413,377
Depreciation 1,962,822 1,991,777
Misc. Operating Expenses 11,735
Misc. Operating Income 11,250
Net
Operating Profit/(Loss) 1,338,493 2,262,594
Interest Receivable/Finance Income
Group related income
Misc. Financial Income 1,133,625 3,137,234
Total Financial Income 1,133,625 3,137,234
Interest Payable/Finance costs 1,034,876 1,333,776
Misc. financial expenses 114,840 2,416,382
Total Financial Expenses 1,149,716 3,750,158
Profit/(Loss) before taxes 1,322,402 1,649,670
Income Tax 415,702 467,209
Other Tax
Profit/(Loss) after taxes 906,700 1,182,461
Extraordinary items
Exceptional items
Misc. Items
Net Profit/(Loss) 906,700 1,182,461
Previous years retained earnings
Current years net income 906,700 1,182,461
Misc. additions in current year
Current years net loss
Dividends in current year
Withdrawals in current year
Misc. deductions in current year
Retained
earnings at end of 906,700 1,182,461
financial period
Average employees
Directors fee
Earnings per share
Earnings per share‑previous year
Auditors Comments
Accounts obtained from: Companies registry
Auditors
Opinion: The
audited financial statement gives a true and fair view of the state of affairs
of the subject
Financial
Statements have been prepared on an on‑going basis.
Assuming
support of: shareholders
FINANCIAL RATIOS /
COMPARATIVE DATA
Actual
Company Industrial Averages Actual Company Industrial Averages
Results
(2011) (2011) Results (2010) (2010)
Liquidity Ratios
Current Ratio 1.77 1.70 2.08 1.53
Acid Test Ratio 0.98 1.11 1.07 1.00
Accounts 0.33 0.41 0.21 0.65
Payable/Sales Ratio
Current
Liabilities/Net 1.07 2.12 0.78 ‑0.40
Worth
Total
Liabilities/Net 1.11 2.28 0.84 ‑0.19
Worth
Fixed
Assets/Net 16.69 86.89 17.84 ‑149.81
Worth (%)
Profitability Ratios
Gross Profit
Ratio (%) 100.00 92.10 99.80 93.93
Return on
Capital 3.48 7.67 4.37 8.00
Employed (ROCE)(%)
Net
Profit/Sales (%) 2.12 ‑4.99 2.38 ‑7.80
Return on
Assets (%) 1.71 4.40 2.52 3.80
Efficiency Ratios
Sales/Working Capital 2.05 167.11 2.32 13.88
Assets/Sales(%) 124.03 181.91 94.40 224.94
Shareholders 3.62 11.78 4.63 7.16
Return(%)
Average
Collection 165.86 100.54 118.77
Period
Leverage Ratios
Capital
Employed 1.77 4.09 2.02 4.18
Capital
Structure (%) 3.79 35.65 5.49 25.80
Number of 342 342
Companies within the
industry (NACE C)
Statistics based on Manufacturing Manufacturing
NACE(C)
INDUSTRY SECTOR
COMPARATIVE DATA
Elements
Taken Result for specific RANKING Total Companies Used
company
DATE OF
REGISTRATION 01/08/1957 232 828
TOTAL EMPLOYEES 120 382 811
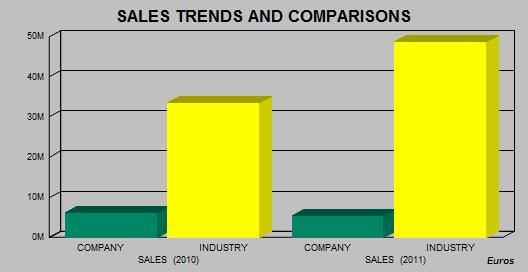
SALES (2011) 5,472,493 113 211
SALES (2010) 6,104,479 154 328
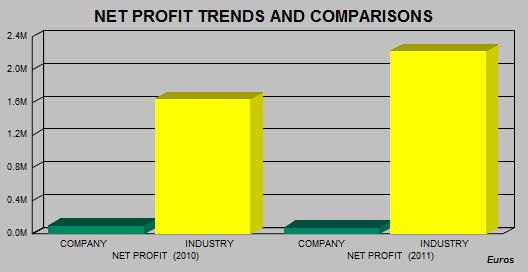
NET PROFIT
(2011) 79,717 102 193
NET PROFIT
(2010) 103,962 154 331
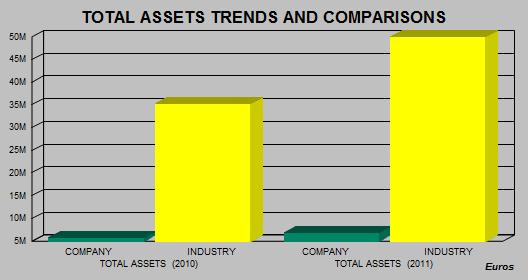
TOTAL ASSETS
(2011) 6,787,663 92 192
TOTAL ASSETS (2010) 5,762,421 158 336
Currency:
EUROS
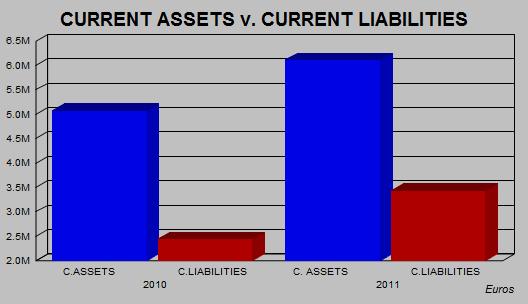
Charts of Financial Trends
and Industry Comparisons
PLEASE NOTE THAT CHARTS
ARE SHOWN IN EUROS FOR TREND AND COMPARISON PURPOSES
The statistical Industrial Average results
are calculated against companies within the database for the
specific country.
Payments
Subject's payments reported
to be: UNDETERMINED
Representation
Other Comments
Other Comments: Patent : 31505020
Interview & Reporter
Comments
Name/Title: Mr. Redouane Essaidi Financial Manager
Comment: Subject has confirmed the general details shown in the
report.
Reporter Comment: All legal
forms in Morocco are obliged by law to be registered with the Registry Office
(OMPIC : Office Marocain De La
Propriete Industrielle Et Commerciale) which is publicly available.
Subject was found registered and
Information obtained from above official source is as follows :
Registered name / registration number / date of
registration / registered address / legal
form /
capital / main principals –
administrators / shareholders / financial information.
According to the Morocco Commercial
Law, all legal forms except for proprietorship entities are
obliged to file their financial
accounts to the OMPIC.
Any other data stated in the report
was obtained directly from the subject company and/or other
publicly available information.
Therefore it should be used as a point of reference as it is not
possible to verify such data with
official sources.
Conclusions
Local Reputation: The
company being investigated is considered by local reporters to be a Fair /
Normal Trade Risk.
General Conclusion: Local informants consider granting of
credit to be a fair trade risk.
Owner/Shareholders Comments: Some
of the owners / shareholders have an active participation in the running of the
business.
Financial Results Trend: Financial Information indicates that the
business activities of the company are
declining in strength.
Age of Business: The company is a long established
family run business.
FOREIGN EXCHANGE RATES
|
Currency |
Unit
|
Indian Rupees |
|
US Dollar |
1 |
Rs.54.33 |
|
|
1 |
Rs.82.56 |
|
Euro |
1 |
Rs.70.10 |
INFORMATION DETAILS
|
Report
Prepared by : |
PRL |
RATING EXPLANATIONS
|
RATING |
STATUS |
PROPOSED CREDIT LINE |
|
|
>86 |
Aaa |
Possesses an extremely sound financial base with the strongest
capability for timely payment of interest and principal sums |
Unlimited |
|
71-85 |
Aa |
Possesses adequate working capital. No caution needed for credit
transaction. It has above average (strong) capability for payment of interest
and principal sums |
Large |
|
56-70 |
A |
Financial & operational base are regarded healthy. General unfavourable
factors will not cause fatal effect. Satisfactory capability for payment of
interest and principal sums |
Fairly Large |
|
41-55 |
Ba |
Overall operation is considered normal. Capable to meet normal
commitments. |
Satisfactory |
|
26-40 |
B |
Capability to overcome financial difficulties seems comparatively
below average. |
Small |
|
11-25 |
Ca |
Adverse factors are apparent. Repayment of interest and principal sums
in default or expected to be in default upon maturity |
Limited with
full security |
|
<10 |
C |
Absolute credit risk exists. Caution needed to be exercised |
Credit not
recommended |
|
-- |
NB |
New Business |
-- |
This score serves as a reference to assess
SC’s credit risk and to set the amount of credit to be extended. It is
calculated from a composite of weighted scores obtained from each of the major
sections of this report. The assessed factors and their relative weights (as
indicated through %) are as follows:
Financial
condition (40%) Ownership
background (20%) Payment
record (10%)
Credit history
(10%) Market trend (10%) Operational size
(10%)
MIRA INFORM REPORT
|
Report Date : |
25.03.2013 |
IDENTIFICATION DETAILS
|
Name : |
STE DE PRODUCTION
ET D'IMPORTATION DES PROQUITS MANUFACTURES |
|
|
|
|
Registered Office : |
Rue G Route Secondaire 110 ‑ Ain Sebaa,
Casablanca |
|
|
|
|
Country : |
Morocco |
|
|
|
|
Financials (as on) : |
31.12.2011 |
|
|
|
|
Date of Incorporation : |
01.08.1957 |
|
|
|
|
Com. Reg. No.: |
25673 |
|
|
|
|
Legal Form : |
Societe A Responsibilite Limitee |
|
|
|
|
Line of Business : |
Manufacture of made‑up textile
articles, except apparel |
|
|
|
|
No. of Employees : |
120 |
RATING & COMMENTS
|
MIRA’s Rating : |
Ba |
|
RATING |
STATUS |
PROPOSED CREDIT LINE |
|
|
41-55 |
Ba |
Overall operation is considered normal. Capable to meet normal
commitments. |
Satisfactory |
|
Status : |
Satisfactory |
|
Payment Behaviour : |
No Complaints |
|
Litigation : |
Clear |
NOTES :
Any query related to this report can be made
on e-mail: infodept@mirainform.com
while quoting report number, name and date.
ECGC Country Risk Classification List – June 30th, 2012
|
Country Name |
Previous Rating (31.03.2011) |
Current Rating (30.06.2012) |
|
Morocco |
A2 |
A2 |
|
Risk Category |
ECGC
Classification |
|
Insignificant |
A1 |
|
Low |
A2 |
|
Moderate |
B1 |
|
High |
B2 |
|
Very High |
C1 |
|
Restricted |
C2 |
|
Off-credit |
D |
MOROCCO - ECONOMIC OVERVIEW
Morocco has capitalized on its proximity to Europe and relatively low labor costs to build a diverse, open, market-oriented economy. In the 1980s Morocco pursued austerity measures and pro-market reforms, overseen by the IMF. Since taking the throne in 1999, King MOHAMMED VI has presided over a stable economy marked by steady growth, low inflation, and generally declining government debt. Industrial development strategies and infrastructure improvements - most visibly illustrated by a new port and free trade zone near Tangier - are improving Morocco's competitiveness. Key sectors of the economy include agriculture, tourism, phosphates, textiles, apparel, and subcomponents. In 2006 Morocco entered into a bilateral Free Trade Agreement with the United States; it remains the only African country to have one. In 2008 Morocco entered into an Advanced Status agreement with the European Union. Despite Morocco's economic progress, the country suffers from high unemployment and poverty. In 2011, high food and fuel prices strained the government's budget and widened the country's current account deficit. Key economic challenges for Morocco include fighting corruption, reducing government spending, reforming the education system and judiciary, addressing socioeconomic disparities, and building more diverse, higher value-added industries.
Source
: CIA
Company name
STE DE PRODUCTION ET D'IMPORTATION DES PROQUITS MANUFACTURES
Registration Briefing
Registration Number: 25673
Registration Date: 01/08/1957
Legal Form: SOCIETE
A RESPONSIBILITE LIMITEE
Latest Financials: December 31,
2011
Financial Briefing
Nominal Capital: 30,000,000
Moroccan Dirham
Issued Capital: N/A
Turnover: 69,000,000
Moroccan Dirham
Net Profit: N/A
Net Worth: 36,556,719
Moroccan Dirham
Company Details
Company Name: STE DE PRODUCTION ET
D'IMPORTATION DES
PROQUITS
MANUFACTURES
Also trades as: SOPIDAM
Headquarter Address: Rue Fatima Bent Akah
(Ex G),
Q.I
Ain Sebaa,
Casablanca
20250,
Morocco
Telephone: +212522
351848
+212522
355568
Fax: +212522
354304
E‑Mail: sopidam@wanadoo.net.ma
Company was originally started on
01/08/1957
Registration & Legal
Details
Current Legal Form: SOCIETE A RESPONSIBILITE LIMITEE
Registration Address: Rue G Route Secondaire
110 ‑ Ain Sebaa,
Casablanca
Registration Number: 25673
Registration Date: 01/08/1957
Year/Date Company Established: 01/08/1957
Registration Town: Casablanca
Tax Registration Number: 01900295
Capital
Currency: Moroccan
Dirham
Authorized Capital: 30,000,000
Paid Up Capital: 30,000,000
Authorized Capital
Breakdown
Number of Shares: 300,000 Type of Shares: None Selected
Issued Shares: 300,000 Value per share: MDH
100.00 Value of this type:
30,000,000.00
Shareholders / Owners
Shareholders:
Name/Other Information Shares
Held % of Voting/Non‑Voting
capital
Mr. Abdellatif Lahbabi
& Family, 300,000 100.00%
(VOTING)
Casablanca,
Morocco
Principals
Name: Mr
Abdellatif Lahbabi
Position within the
company: President and
managing director
Date of Birth: 14/04/1942
Country of Birth: Morocco
Nationality: Moroccan
Can fluently speak: Arabic & French
Name: Mr
Redouane Essaidi
Position within the
company: Financial Manager
Country of Birth: Morocco
Nationality: Moroccan
Can fluently speak: Arabic & French
Company Activities
NACE Codes: 1392 Manufacture
of made‑up textile articles, except apparel
The company SOPIDAM is specialized in manufacture and wholesale of non‑weaved
fabrics, synthetic foam, bed lining and pillows.
Local Reporters consider the
investigated company to be MEDIUM in their field of concern.
Operations
Employees Company
Employs: 120
HQ Premises Operates
from: Owned Office , Factory, Warehouse
Premises
Size: 7200 square meters
14700
square meters site
Location: Industrial Area
Branches 5
Boulevard Aba Chouaib Doukali,
Casablanca,
Morocco
Branch
is: Rented
Description
of branch: Warehouse
Imports
Import
% and type of product: 60% Raw Materials
Imports
From: Pakistan,
Korea (South), India
Importing
Terms: Letters of
credit
Exports
Export
% and type of product: Subject does not
export
Trading & Selling
Territory: 100%
Nationally
Type
of Customer: Wholesalers
Vehicles: Total
number of vehicles:
8
trucks
Related Companies
Subsidiaries
Affiliates
Information on
Related Companies is not available/applicable
Bankers
Société Générale,
Branch: Abdelmoumen
55 Boulevard Abdelmoumen,
Casablanca,
Morocco
Attijariwafa Bank,
Branch: Mandarouna
Lotissement Attaoufik,
Angle Rue 1 & Boulevard 63 ‑
Sidi Maarouf,
Casablanca,
Morocco
Financial Information
Source: Mr.
Redouane Essaidi Financial Manager
Figures are: Estimates
Currency: Moroccan
Dirham
Months Sales Figures Sales Gross
Profit/Loss Net Profit/Loss
12 31/12/2012 69,000,000
12 31/12/2011 62,244,004 1,322,402 906,700
12 31/12/2010 69,432,201 1,649,670 1,182,461
Balance Sheet & Profit
& Loss
BALANCE SHEET
As
at: 31‑Dec‑2011 As at: 31‑Dec‑2010
Fixed Assets
Land & Buildings 1,209,937 1,353,061
Plant & Machinery 2,642,788 3,661,980
Furniture & Equipment 235,614 249,617
Motor Vehicles 23,624 23,583
Misc. Fixed Assets 1,988,750 1,070,496
Total Fixed
Assets 6,100,713 6,358,737
Financial Assets
Shares in Related Companies 20,000 20,000
Loans to related companies
Investments
Deposits
Misc. Financial Assets 130,652 130,652
Total Financial
Assets 150,652 150,652
Intangibles
Goodwill
Organisational Expenses 1,272,421 1,090,832
Patents 110,458 160,767
Misc. Intangible Assets 20,500 20,500
Total
Intangible Assets 1,403,379 1,272,099
Current Assets
Stock 31,242,649 27,913,420
Stock & Work in Progress
Trade Debtors & receivables 32,473,262 24,094,179
Provision for bad debs
Other receivables 126,659 85,818
Due from related companies
Owed by shareholders
Prepaid expenses 79,527 47,283
Cash 816,562 1,174,271
Tax recoverable 4,620,227 4,050,617
Marketable Securities
Misc. Current Assets 189,087 394,567
Total
Current Assets 69,547,973 57,760,155
Total Assets 77,202,717 65,541,643
Owner's Equity & Liabilities
Issued and paid up capital 30,000,000 30,000,000
Share premium account
Retained earnings 5,199,971 4,076,634
Net profit/Loss for the year 906,700 1,182,461
Revaluation reserves
Legal Reserves 450,048 390,925
Other reserves
Net Worth 36,556,719 35,650,020
Deffered Taxation
Provisions/allowances 1,441,002 2,071,070
Mortgages/Loans
Hire purchase
Due to group of companies
Minority interest
Misc. deferred liabilities
Total Long
Term Liabilities 1,441,002 2,071,070
Current Liabilities
Creditors 20,329,531 14,736,330
Other creditors 24,244 21,101
Accruals
Bank overdrafts/Loans 12,677,003 8,140,886
Misc. Loans
Directors accounts
Owing to shareholders 1,965,757 455,832
Owing to related companies
Proposed dividend
Long Term‑due 1 year
Hire Purchase‑under 1 year
Taxation 3,685,422 4,015,742
Advance receipts
Misc. Current Liabilities 523,039 450,662
Total
Current Liabilities 39,204,996 27,820,553
Owner's
Equity & Liabilities 77,202,717 65,541,643
PROFIT & LOSS
Figures
are: Figures
are:
Fiscal
Year Fiscal Year
01/01/2011
to 31/12/2011 01/01/2010 to
31/12/2010
Total Income/Turnover 62,244,004 69,432,201
Cost of sales 137,944
Gross Profit/(Loss) 62,244,004 69,294,257
Admin/selling expenses 40,591,869 45,862,863
Services 9,229,652 12,337,237
Salaries 6,120,105 6,793,397
Auditors Fee 349,260 459,766
Stock Depreciation 2,651,318 ‑413,377
Depreciation 1,962,822 1,991,777
Misc. Operating Expenses 11,735
Misc. Operating Income 11,250
Net
Operating Profit/(Loss) 1,338,493 2,262,594
Interest Receivable/Finance Income
Group related income
Misc. Financial Income 1,133,625 3,137,234
Total Financial Income 1,133,625 3,137,234
Interest Payable/Finance costs 1,034,876 1,333,776
Misc. financial expenses 114,840 2,416,382
Total Financial Expenses 1,149,716 3,750,158
Profit/(Loss) before taxes 1,322,402 1,649,670
Income Tax 415,702 467,209
Other Tax
Profit/(Loss) after taxes 906,700 1,182,461
Extraordinary items
Exceptional items
Misc. Items
Net Profit/(Loss) 906,700 1,182,461
Previous years retained earnings
Current years net income 906,700 1,182,461
Misc. additions in current year
Current years net loss
Dividends in current year
Withdrawals in current year
Misc. deductions in current year
Retained
earnings at end of 906,700 1,182,461
financial period
Average employees
Directors fee
Earnings per share
Earnings per share‑previous year
Auditors Comments
Accounts obtained from: Companies registry
Auditors
Opinion: The
audited financial statement gives a true and fair view of the state of affairs
of the subject
Financial
Statements have been prepared on an on‑going basis.
Assuming
support of: shareholders
FINANCIAL RATIOS /
COMPARATIVE DATA
Actual
Company Industrial Averages Actual Company Industrial Averages
Results
(2011) (2011) Results (2010) (2010)
Liquidity Ratios
Current Ratio 1.77 1.70 2.08 1.53
Acid Test Ratio 0.98 1.11 1.07 1.00
Accounts 0.33 0.41 0.21 0.65
Payable/Sales Ratio
Current Liabilities/Net
1.07 2.12 0.78 ‑0.40
Worth
Total
Liabilities/Net 1.11 2.28 0.84 ‑0.19
Worth
Fixed
Assets/Net 16.69 86.89 17.84 ‑149.81
Worth (%)
Profitability Ratios
Gross Profit
Ratio (%) 100.00 92.10 99.80 93.93
Return on
Capital 3.48 7.67 4.37 8.00
Employed (ROCE)(%)
Net
Profit/Sales (%) 2.12 ‑4.99 2.38 ‑7.80
Return on
Assets (%) 1.71 4.40 2.52 3.80
Efficiency Ratios
Sales/Working
Capital 2.05 167.11 2.32 13.88
Assets/Sales(%) 124.03 181.91 94.40 224.94
Shareholders 3.62 11.78 4.63 7.16
Return(%)
Average
Collection 165.86 100.54 118.77
Period
Leverage Ratios
Capital
Employed 1.77 4.09 2.02 4.18
Capital
Structure (%) 3.79 35.65 5.49 25.80
Number of 342 342
Companies within the
industry (NACE C)
Statistics based on Manufacturing Manufacturing
NACE(C)
INDUSTRY SECTOR
COMPARATIVE DATA
Elements
Taken Result for specific RANKING Total Companies Used
company
DATE OF
REGISTRATION 01/08/1957 232 828
TOTAL EMPLOYEES 120 382 811
SALES (2011) 5,472,493 113 211
SALES (2010) 6,104,479 154 328
NET PROFIT
(2011) 79,717 102 193
NET PROFIT
(2010) 103,962 154 331
TOTAL ASSETS
(2011) 6,787,663 92 192
TOTAL ASSETS
(2010) 5,762,421 158 336
Currency:
EUROS
Charts of Financial Trends
and Industry Comparisons
PLEASE NOTE THAT CHARTS
ARE SHOWN IN EUROS FOR TREND AND COMPARISON PURPOSES
The statistical Industrial Average
results are calculated against companies within the database for the
specific country.
Payments
Subject's payments reported
to be: UNDETERMINED
Representation
Other Comments
Other Comments: Patent : 31505020
Interview & Reporter
Comments
Name/Title: Mr. Redouane Essaidi Financial Manager
Comment: Subject has confirmed the general details shown in the
report.
Reporter Comment: All legal
forms in Morocco are obliged by law to be registered with the Registry Office
(OMPIC : Office Marocain De La
Propriete Industrielle Et Commerciale) which is publicly available.
Subject was found registered and
Information obtained from above official source is as follows :
Registered name / registration number / date of
registration / registered address /
legal form /
capital / main principals –
administrators / shareholders / financial information.
According to the Morocco Commercial
Law, all legal forms except for proprietorship entities are
obliged to file their financial
accounts to the OMPIC.
Any other data stated in the report
was obtained directly from the subject company and/or other
publicly available information.
Therefore it should be used as a point of reference as it is not
possible to verify such data with
official sources.
Conclusions
Local Reputation: The
company being investigated is considered by local reporters to be a Fair /
Normal Trade Risk.
General Conclusion: Local informants consider granting of
credit to be a fair trade risk.
Owner/Shareholders Comments: Some
of the owners / shareholders have an active participation in the running of the
business.
Financial Results Trend: Financial Information indicates that the
business activities of the company are
declining in strength.
Age of Business: The company is a long established
family run business.
FOREIGN EXCHANGE RATES
|
Currency |
Unit
|
Indian Rupees |
|
US Dollar |
1 |
Rs.54.33 |
|
|
1 |
Rs.82.56 |
|
Euro |
1 |
Rs.70.10 |
INFORMATION DETAILS
|
Report
Prepared by : |
PRL |
RATING EXPLANATIONS
|
RATING |
STATUS |
PROPOSED CREDIT LINE |
|
|
>86 |
Aaa |
Possesses an extremely sound financial base with the strongest
capability for timely payment of interest and principal sums |
Unlimited |
|
71-85 |
Aa |
Possesses adequate working capital. No caution needed for credit transaction.
It has above average (strong) capability for payment of interest and
principal sums |
Large |
|
56-70 |
A |
Financial & operational base are regarded healthy. General
unfavourable factors will not cause fatal effect. Satisfactory capability for
payment of interest and principal sums |
Fairly Large |
|
41-55 |
Ba |
Overall operation is considered normal. Capable to meet normal
commitments. |
Satisfactory |
|
26-40 |
B |
Capability to overcome financial difficulties seems comparatively below
average. |
Small |
|
11-25 |
Ca |
Adverse factors are apparent. Repayment of interest and principal sums
in default or expected to be in default upon maturity |
Limited with
full security |
|
<10 |
C |
Absolute credit risk exists. Caution needed to be exercised |
Credit not
recommended |
|
-- |
NB |
New Business |
-- |
This score serves as a reference to assess
SC’s credit risk and to set the amount of credit to be extended. It is
calculated from a composite of weighted scores obtained from each of the major
sections of this report. The assessed factors and their relative weights (as
indicated through %) are as follows:
Financial
condition (40%) Ownership
background (20%) Payment
record (10%)
Credit history
(10%) Market trend (10%) Operational size
(10%)