MIRA INFORM REPORT
|
Report Date : |
30.03.2013 |
IDENTIFICATION DETAILS
|
Name : |
THAI AIRWAYS INTERNATIONAL PUBLIC COMPANY LIMITED |
|
|
|
|
Registered Office : |
89 Vibhavadi Rangsit Road, Jompol, Jatujak, Bangkok 10900, |
|
|
|
|
Country : |
Thailand |
|
|
|
|
Financials (as on) : |
31.12.2012 |
|
|
|
|
Date of Incorporation : |
29.03.1960 |
|
|
|
|
Com. Reg. No.: |
0107537001757 |
|
|
|
|
Legal Form : |
Public Limited Company |
|
|
|
|
Line of Business : |
Aviation and Transportation |
|
|
|
|
No. of Employees : |
25,856 |
RATING & COMMENTS
|
MIRA’s Rating : |
Ba |
|
RATING |
STATUS |
PROPOSED CREDIT LINE |
|
|
41-55 |
Ba |
Overall operation is considered normal. Capable to meet normal
commitments. |
Satisfactory |
|
Status : |
Satisfactory |
|
Payment Behaviour : |
Usually Correct |
|
Litigation : |
Clear |
NOTES :
Any query related to this report can be made
on e-mail: infodept@mirainform.com
while quoting report number, name and date.
ECGC Country Risk Classification List – June 30th, 2012
|
Country Name |
Previous Rating (31.03.2011) |
Current Rating (30.06.2012) |
|
Thailand |
B1 |
B1 |
|
Risk Category |
ECGC
Classification |
|
Insignificant |
A1 |
|
Low |
A2 |
|
Moderate |
B1 |
|
High |
B2 |
|
Very High |
C1 |
|
Restricted |
C2 |
|
Off-credit |
D |
THAILAND - ECONOMIC OVERVIEW
With a well-developed infrastructure, a free-enterprise economy, generally pro-investment policies, and strong export industries, Thailand enjoyed solid growth from 2000 to 2007 - averaging more than 4% per year - as it recovered from the Asian financial crisis of 1997-98. Thai exports - mostly machinery and electronic components, agricultural commodities, and jewelry - continue to drive the economy, accounting for more than half of GDP. The global financial crisis of 2008-09 severely cut Thailand's exports, with most sectors experiencing double-digit drops. In 2009, the economy contracted 2.3%. In 2010, Thailand's economy expanded 7.8%, its fastest pace since 1995, as exports rebounded from their depressed 2009 level. Steady economic growth at just below 4% during the first three quarters of 2011 was interrupted by historic flooding in October and November in the industrial areas north of Bangkok, crippling the manufacturing sector and leading to a revised growth rate of only 0.1% for the year. The industrial sector is poised to recover from the second quarter of 2012 onward, however, and the government anticipates the economy will probably grow between 5.5 and 6.5% for 2012, while private sector forecasts range between 3.8% and 5.7%.
Source
: CIA
Company name
THAI
AIRWAYS INTERNATIONAL PUBLIC
COMPANY LIMITED
SUMMARY
BUSINESS
ADDRESS : 89
VIBHAVADI RANGSIT ROAD, JOMPOL,
JATUJAK, BANGKOK
10900, THAILAND
TELEPHONE : [66]
2545-1000, 2595-1000
FAX :
[66] 2513-0203,
2512-2182, 2512-2262
E-MAIL
ADDRESS : irtg@thaiairways.com
WEBSITE : www.thaiairways.com
REGISTRATION
ADDRESS : SAME
AS BUSINESS ADDRESS
ESTABLISHED : 1960
REGISTRATION
NO. : 0107537001757 [Former : BOR MOR JOR. 422]
TAX
ID NO. : 3101000634
CAPITAL
REGISTERED : BHT.
26,989,009,500
CAPITAL
PAID-UP : BHT.
21,827,719,170
FISCAL
YEAR CLOSING DATE : DECEMBER 31
LEGAL
STATUS : PUBLIC LIMITED
COMPANY
EXECUTIVE : MR.
SORAJAK KASEMSUVAN, THAI
PRESIDENT
NO.
OF STAFF : 25,856
LINES
OF BUSINESS : AVIATION
AND TRANSPORTATION
CORPORATE PROFILE
OPERATING
TREND : STABLE
PRESENT
SITUATION : OPERATING
NORMALLY
REPUTATION : GOOD
FOR NORMAL BUSINESS
ENGAGEMENT
MANAGEMENT
STANDARD : MANAGEMENT
WITH FAIR PERFORMANCE
HISTORY
The subject was
originally established on
March 29, 1960
as a private
limited company by
a joint venture
among Thailand’s domestic
carrier, Thai Airways
Company [TAC] and Scandinavian Airlines
System [SAS] with the
Scandinavian carrier initially
providing a 30%
share capital of
two million baht.
On April 1st,
1977 after a
17 years capital
participation partnership with SAS, the
Thai Government bought
SAS’s remaining 15%
holding and Thai became
fully owned by
the Thai people.
On April 1st,
1988 as a
result of its
merger with Thai
Airways Company [TAC] the
domestic airline, which
raised the company’s
share capital from
Bht. 1,400 million to Bht. 2,230 million. Under the cabinet
policy, as authorised
by General Prem Tinsulanonda,
Prime Minister at the time, Thai International would
be responsible for
commercial aviation, both
international and domestic.
The subject actually
is the state
enterprise.
The subject
was listed on The Stock
Exchange of Thailand
on July 19,
1991 and was
officially traded on
July 23, 1992.
Its status was
converted into public
company limited on May 20,
1994.
A significant
development in 1997
concerned a joining
the Star Alliance,
a strategic grouping
with four other
leading airlines to
provide customers with
seamless travelling services
comprising Lufthansa, United
Airlines, SAS, Air
Canada and THAI.
THAI’s 1997 operating
results were ranked
as one of
the world’s top
ten airlines according
to a market
survey conducted by
Business Traveller Magazine.
On September 28,
2006, the Bangkok
International Airport has
moved to the
new international airport, “Suvarnabhumi International
Airport”, located in Bangplee
district, Samutprakarn province. It
currently employs 25,856
staff.
The subject’s registered
address is 89
Vibhavadi Rangsit Rd.,
Jompol, Jatujak, Bangkok
10900, and this
is the subject’s
current operation address.
THE BOARD OF DIRECTORS
|
Name |
|
Nationality |
Age |
|
|
|
|
|
|
Mr. Ampon Kittiampon
: Chairman |
[x] |
Thai |
58 |
|
Mr. Areepong Bhoocha-oom
: Vice Chairman |
|
Thai |
56 |
|
ACM Satipong Sukvimol |
|
Thai |
64 |
|
Mr. Chulasingh
Vasantasingh : Vice Chairman |
|
Thai |
63 |
|
Mr. Kanit Sangsubhan |
[+] |
Thai |
55 |
|
Mr. Weerawong Chittmittrapap |
|
Thai |
55 |
|
Mr. Apiporn Pasawat |
[+] |
Thai |
65 |
|
Mr. Dheerasak Suwannayos |
|
Thai |
61 |
|
Air Chief Marshal
Supreecha Kamalas |
|
Thai |
61 |
|
Pol. Gen. Wichean Potephosree |
|
Thai |
60 |
|
Mr. Sorajak Kasemsuwan |
[+] |
Thai |
58 |
|
Mr. Chutinant Bhirombhakdi |
|
Thai |
56 |
|
Mr. Silpachai Jarukasemratana |
|
Thai |
61 |
|
Pol. Gen. Adul Saengsingkaew |
|
Thai |
59 |
|
Mr. Suthgam Siritipsakorn |
|
Thai |
57 |
AUTHORIZED PERSON
The mentioned director
[x] can jointly
sign with one
of the directors
[+] or three
of the mentioned
directors [+] can jointly
sign on behalf of
the subject with
the company’s affixed.
SENIOR MANAGEMENT
Mr. Sorajak Kasemsuvan is
the President.
He is Thai
nationality. He is
in the position
on October 9,
2012.
Mr. Chokchai Panyayong is
the Senior Executive
Vice President, Strategy
and Business Development.
He is Thai
nationality.
Mr. Pandit Chanapai is
the Managing Director,
Ground Services Business
Unit.
He is Thai
nationality.
Sqn. Ldr. Asdavut Watanangura is
the Executive Vice
President, Products and Customer
Services
He is Thai
nationality.
Flt. Lt. Montree Jumrieng is
the Executive Vice
President, Technical Department.
He is Thai
nationality.
Mr. Teerapol Chotichanapibal is
the Executive Vice
President, Product &
Customer Services.
He is Thai
nationality.
Mr. Danuj Bunnag is
the Executive Vice
President, Commercial.
Mr. Niruj Maneepan is the Executive Vice President,
Human Resources and
Compliance. He is
Thai nationality.
Mrs. Wasukarn Visansawatdi is the Executive Vice President, Financial
& Accounting Department.
She is Thai
nationality.
Lt. Athisak Padchuenjai is
the Executive Vice
President, Operations.
He is Thai
nationality
BUSINESS OPERATIONS
The subject is engaged in
the national carrier serving the
Kingdom of Thailand. It
operates domestic, regional
and intercontinental flights
radiating from its
home base in
Bangkok to key destinations around the
world and within
Thailand. Currently the
subject operates flights
to 34 countries, to 71
international and domestic cities,
with over 800
flights per week.
The subject also provides services related to air
transportation such as airport services, restaurant &
catering business, limousine
service, warehouse &
storage services and
etc.
Presently, the subject has
adjusted its organization structure
by dividing the
operations into 3
major business as follows:
1.
Airline
Business
2.
Business
Related to Airline
Business
-
Ground Customer Services
-
Ground Equipment Services [passengers & crew transport & luggage service,
aircraft service and
maintenance service]
-
Cargo & Mail
Commercial Services
-
Catering Services
-
Technical Services
3. Transport Support
Activities
- Dispatch Services
- Sales on
Board
- THAI’s Souvenir
Shop
Aircraft Fleet Type [as
of March 2013]
|
Aircraft Type |
No. of Aircraft [Seat] |
|
|
|
|
Airbus 380-800 |
4 [507] |
|
Boeing 747-400 : 747 |
6 [389] |
|
Boeing 747-400 : 744 |
4 [375] |
|
Boeing 747-400 : 74R |
6 [375] |
|
Boeing 777-200 |
8 [309] |
|
Boeing 777-200ER |
6 [292] |
|
Boeing 777-300 |
6 [364] |
|
Boeing 777-300ER |
5 [312] |
|
Boeing 737-400 |
5 [149] |
|
Airbus 300-600 : AB6 |
6 [247] |
|
Airbus 300-600 : AB7 |
5 [260] |
|
Airbus 330-300 : 333 |
12 [305] |
|
Airbus 330-300 : 330 |
8 [299] |
|
Airbus 330-300 : 33H |
3 [299] |
|
Airbus A340-500 |
4 [215] |
|
Airbus A340-600 |
6 [267] |
|
Total |
94 |
During 2012-2013, the
subject’s Board of
Directors approved the
plan for aircraft
decommissioning and sales
as part of
the 2012-2022 long
term plan for
aircraft fleet development,
including the aircraft
currently on lease
to Nok Air
Airline. In 2012
the subject was
decommission the following
11 aircrafts:
-
Airbus A300-600 [2
aircrafts]
-
Airbus
A340-500 [4 aircrafts]
-
Boeing
747-400 [2 aircrafts]
-
ATR72
[2 aircrafts, 1 lease
to Nok Air]
During 2012-2013, the
subject will receive
the delivery of
25 new aircraft
into the fleet.
The Revenue Structure of
the Company
The details of the
company’s total revenues
are as follows:
1.
Revenue from passengers and excess baggage in each
route of the company including charter flights.
2.
Revenue from freight according to weight, category,
size and destination.
3.
Revenue from mail.
4.
Revenue from business units and supporting
activities.
5.
Revenue from subsidiaries.
6.
Other income
REVENUE STRUCTURE [The company
and its subsidiaries]
|
|
2011 |
2010 |
Increase/Decrease |
|
|
Unit :
Million Baht |
MTHB |
MTHB |
MTHB |
% |
|
|
|
|
|
|
|
Passenger and Excess Baggage
Revenue |
|
|
|
|
|
Regional |
58,298 |
52,953 |
5,345 |
10.1 |
|
Intercontinental |
56,013 |
52,954 |
3,059 |
5.8 |
|
Domestic |
13,808 |
12,399 |
1,409 |
11.4 |
|
Non-schedule Flight |
699 |
539 |
160 |
29.7 |
|
Passenger Insurance
Surcharge |
1,670 |
1,925 |
[255] |
[13.2] |
|
Passenger Fuel
Surcharge |
24,158 |
24,092 |
66 |
0.3 |
|
|
|
|
|
|
|
Total Passenger and Excess
Baggage Revenue |
154,646 |
144,862 |
9,784 |
6.8 |
|
Freight and Mail
Revenue |
28,092 |
28,230 |
[138] |
[0.5] |
|
|
|
|
|
|
|
Total Revenue from Transportation
Activities |
182,738 |
173,092 |
9,646 |
5.6 |
|
Revenue from Other
Activities |
8,259 |
7,496 |
763 |
10.2 |
|
|
|
|
|
|
|
Total Operating Income |
190,997 |
180,588 |
10.409 |
5.8 |
|
Interest Income |
711 |
185 |
526 |
284.3 |
|
Other Income |
2,634 |
3,497 |
[863] |
[24.7] |
|
Total revenues |
194,342 |
184,270 |
10,072 |
5.5 |
IMPORT [COUNTRIES]
Aircraft together
with spare parts,
supplies and equipment
related to repairing
and maintenance are
imported from overseas suppliers in United
States of America, Germany,
Japan, United Kingdom,
Taiwan, Sweden, France,
Australia and etc.
SALES
The services are
sold to end-users
both local and
international passengers as
well as Thai
Government.
SUBSIDIARIES AND ASSOCIATED
COMPANIES
The subject is
found to have
subsidiaries and associated
companies as follows:
Thai-Amadeus Southeast
Asia Co., Ltd.
Address :
The Offices at
Central World, 999/9 Unit
3406-3412, 34th Floor,
Rama 1 Rd.,
Pathumwan, Bangkok 10330
Business Type: On-line ticketing
Services and other traveling
services to agents
The subject holds
55.0% of company’s
shares.
Royal Orchid
Hotel [Thailand] Public
Co., Ltd.
Address
: 2 Captain
Bush Lane, Charoen Krung Rd., Bangrak,
Bangkok 10500
Business Type: Hotel
and Restaurant
The
subject holds 24.0%
of company’s shares.
Don Muang International
Airport Hotel Co.,
Ltd.
Address
:
333 Moo 10, Chert Wudthakas Road, Don Muang, Bangkok 10210
Business Type: Hotel
and restaurant
The
subject holds 40.00% of
company’s shares.
Bangkok Aviation
Fuel Services Public
Co., Ltd.
Address
:
171/2 Vibhavadi Rangsit Road, Don
Muang Bangkok 10210, Thailand
Business Type: Aviation
fuel services
The
subject holds 22.59% of
company’s shares.
Phuket Air
Catering Co., Ltd.
Address : 10/3 Moo 6 Sanambin Rd., Mai Khoa, Thalang, Phuket 83000, Thailand
Business Type: Air catering
The
subject holds 30.0%
of company’s shares.
Suvarnabhumi Airport
Hotel Co., Ltd.
Address
: 999 Suvarnabhumi
Airport Hotel Bldg., Moo 1,
Nongprue, Bang Phli,
Samutprakarn 10540
Business Type: Hotel
and restaurant
The
subject holds 30.0%
of company’s shares.
Nok Airlines
Co., Ltd.
Address
: 17th Floor,
Rajanakarn Bldg., 183
South Sathorn Rd.,
Yannawa,
Sathorn, Bangkok
10120
Business Type: Aviation
transportation services
The
subject holds 49.0%
of company’s shares.
Wing Span
Services Co., Ltd.
Address
: 89 Vibhavadi
Rangsit Rd., Jompol,
Jatujak, Bangkok 10900
Business Type: Human
resources aanagment Services
The subject
holds 49.0% of
company’s shares.
Thai Flight
Training Company Limited
Address
: 89 Vibhavadi
Rangsit Rd., Jompol,
Jatujak, Bangkok 10900
Business Type: Aviation
Training Services
The subject
holds 49.0% of
company’s shares.
Tour Eurng
Luang Co., Ltd.
Address
: 89 Vibhavadi
Rangsit Rd., Jompol,
Jatujak, Bangkok 10900
Business Type: Tourism
services and related-tourism activities
The subject
holds 49.0% of
company’s shares.
Thai Smile Airway Co.,
Ltd.
Address
: 89 Vibhavadi
Rangsit Rd., Jompol,
Jatujak, Bangkok 10900
Business Type: Light
premium airline
The subject
holds 100.0% of
company’s shares.
LITIGATION
Bankruptcy and Receivership
There are no
litigation on bankruptcy
and receivership cases
filed against the
subject found at
Legal Execution Department
for the past
five years.
Others
There are no
legal suits filed
against the subject
for the past
two years.
CREDIT
Sales are by
cash or on
the credit term
of 30 days.
Local bills are
paid by cash
or on the
credits term of
30-120 days.
Imports are by
L/C at sight and T/T.
BANKING
Bangkok Bank Public
Co., Ltd.
[Head Office
: 333 Silom
Road, Bangrak, Bangkok 10500]
Kasikornbank Public Co.,
Ltd.
[Head Office
: 1 Kasikorn
Lane, Rajburana Rd.,
Rajburana, Bangkok 10140].
TMB Bank Public
Co., Ltd.
[Head Office
: 3000 Phaholyothin
Rd., Ladyao, Jatujak,
Bangkok 10900].
Krung Thai Bank
Public Co., Ltd.
[Head Office
: 35 Sukhumvit
Rd., Klongtunnua, Wattana,
Bangkok 10110].
The
Siam Commercial Bank
Public Co., Ltd.
[Head Office :
9 Ratchadapisek Rd.,
Ladyao, Jatujak, Bangkok
10900]
Bank
of Ayudhya Public
Co., Ltd.
[Head Office
: 1222 Rama
3 Rd., Bangpongpang, Yannawa, Bangkok 10120]
EMPLOYMENT
The subject employs
approximately 25,856 staff.
LOCATION DETAILS
The
head office is owned
in a 22-storey
building at the
heading address. Premise
is located in
a neat and
new building in commercial
area at 89
Vibhavadi Rangsit Rd.,
Jompol, Jatujak, Bangkok
10900, Thailand.
Information, Passenger &
Cargo Sales: 485
Silom Road, Bangkok
10500 Tel: [66]
2234-3100-9, [66] 2234-3110-9
Airport office: Suvarnabhumi
International Airport, Bangna-Trad
Rd., Rajathewa, Bangplee,
Samutprakarn province.
Thai On-line Offices are
in 51 countries
around the world,
6 offices in
Bangkok and 9 offices
in big city
nationwide.
COMMENT
The company
has earned numerous
honors and commendations from leading organizations
both within and outside Thailand
and continues to
receive global recognition for its
unique service incorporating the
Thai identity and graceful
hospitality that is
found nowhere else in
the world.
In 2012, the
airline made a
net profit of
6.23 billion Baht, recovering
from a loss of
10.2 billion in
2011. With its
cabin factor the
percentage of seats sold,
rising to a five
year high of
76.6%.
Furthermore
the forecast for
2013-15 earning compounded
annual growth rate of
3.2 percent, driven by capacity
expansion and yield
improvement, should bring on
more stock price
appreciation.
FINANCIAL
INFORMATION
The capital was
initially registered at
Bht. 2,000,000.
The capital was
increased later as
followings:
Bht.
950,000,000 on September
16, 1980
Bht.
1,100,000,000 on September
18, 1981
Bht.
1,400,000,000 on September
24, 1982
Bht.
13,000,000,000 on March
3, 1992
Bht.
14,000,000,000 on June
1, 1992
Bht.
16,850,000,000 in 2003
The current registered capital
is Bht. 26,989,009,500
divided into 2,698,900,950
ordinary shares of
Bht. 10 each.
MAIN SHAREHOLDERS :
[as at March 18,
2013] at Bht.
21,827,719,170 of capitalization.
|
NAME |
HOLDING |
% |
|
|
|
|
|
Ministry of Finance |
1,113,931,061 |
51.03 |
|
Vayuphak I Mutual
Fund by Krung Thai Bank Plc. |
167,757,720 |
7.69 |
|
Vayuphak I Mutual
Fund by MFC
Plc. |
167,757,720 |
7.69 |
|
Thai NVDR Co.,
Ltd. |
51,339,498 |
2.35 |
|
The Government Saving
Fund |
46,409,885 |
2.13 |
|
HSBC [Singapore] Nominees
Pte. Ltd. |
25,424,876 |
1.16 |
|
State Street Bank
Europe Limited |
17,591,103 |
0.81 |
|
Mr. Eiam Archavakulthep |
17,190,000 |
0.79 |
|
East Fourteen Limited-Dimensional Emer
Mkts value |
14,595,611 |
0.67 |
|
Mr. Vichai Kanathanavanich |
13,000,000 |
0.60 |
|
TFB for MFC-Thai
Fund Investment Plan |
11,223,018 |
0.51 |
|
Others |
536,551,425 |
24.57 |
Total Shareholders :
112,139 [including the
above shareholders]
NAME OF AUDITOR AND CERTIFIED PUBLIC ACCOUNTANT NO.:
Mr. Bhisit Leelavachiropas
Auditor General
Ms. Puangchomnart Jariyachinda
Director of Auditor
Office
BALANCE SHEET [BAHT]
The
latest financial figures
published for December
31, 2012, 2011
& 2010 were:
ASSETS
|
Current Assets |
2012 |
2011 [Restated] |
2010 [Restated] |
|
|
|
|
|
|
Cash and cash Equivalents |
19,741,670,550 |
16,629,940,922 |
37,601,476,433 |
|
Trade Accounts Receivable |
15,679,356,299 |
16,135,407,891 |
16,509,658,800 |
|
Prepaid Expenses &
Deposit |
9,012,036,532 |
10,482,589,799 |
9,080,884,481 |
|
Inventories & Supplies |
7,780,199,730 |
7,710,007,103 |
6,967,672,684 |
|
Other Current Assets
|
9,713,193,240 |
7,090,660,788 |
6,963,643,648 |
|
Non-current Assets
Classified as Held for Sale |
7,430,210,409 |
261,631,778 |
274,996,800 |
|
|
|
|
|
|
Total Current Assets
|
69,356,666,760 |
58,310,238,281 |
77,398,332,846 |
|
Investment in Associates
|
723,520,500 |
1,083,520,500 |
918,520,500 |
|
Investment in Subsidiaries |
370,209,900 |
10,209,900 |
9,229,930 |
|
Other Long-term Investments |
74,585,128 |
79,889,058 |
78,868,075 |
|
Property, Plant and Equipment |
218,477,941,563 |
204,987,311,294 |
206,106,106,106 |
|
Intangible Assets |
772,954,356 |
617,255,122 |
547,622,540 |
|
Deferred Tax Assets |
4,939,492,971 |
5,398,556,488 |
7,555,783,585 |
|
Other Non-current Assets |
4,640,196,663 |
2,312,892,713 |
2,260,652,011 |
|
Total Assets |
299,355,567,841 |
272,799,873,356 |
294,875,115,593 |
LIABILITIES &
SHAREHOLDERS' EQUITY [BAHT]
|
Current
Liabilities |
2012 |
2011 [Restated] |
2010 [Restated] |
|
|
|
|
|
|
Trade Accounts Payable |
4,287,281,811 |
7,354,684,963 |
6,429,968,646 |
|
Accrued Expenses |
18,497,737,175 |
13,940,060,094 |
18,869,584,115 |
|
Long-term Loans
from Related Parties |
3,297,264,000 |
2,072,000,000 |
2,072,000,000 |
|
Long-term Loans from
Others |
8,151,368,421 |
2,028,000,000 |
- |
|
Liabilities under
Finance Leases |
9,938,493,819 |
10,102,499,455 |
9,595,026,378 |
|
Debentures |
2,556,790,000 |
4,670,000,000 |
11,487,920,000 |
|
Accrued Dividends |
51,692,971 |
51,960,945 |
72,007,719 |
|
Unearned Transportation Revenues |
23,380,604,242 |
24,760,701,984 |
25,804,443,193 |
|
Deferred Income |
- |
- |
509,417,156 |
|
Others |
11,470,031,663 |
5,629,595,110 |
5,819,769,875 |
|
|
|
|
|
|
Total Current Liabilities |
81,631,264,102 |
70,609,502,551 |
80,660,137,082 |
|
Long-term Liabilities |
|
|
|
|
Long-term Loans
from Related Parties |
1,890,000,000 |
5,235,276,000 |
7,245,852,000 |
|
Long-term Loans
from Others |
39,120,631,579 |
47,272,000,000 |
43,300,000,000 |
|
Liabilities under
Finance Leases |
61,610,827,672 |
47,793,179,638 |
54,732,093,240 |
|
Debentures |
32,120,000,000 |
23,176,790,000 |
17,846,790,000 |
|
Deferred tax Liabilities
|
83,351,796 |
55,761,979 |
- |
|
Staff Pension Fund |
4,670,104,407 |
4,561,205,013 |
4,371,134,750 |
|
Employee Benefits Obligation |
10,970,895,026 |
10,627,153,071 |
9,322,510,535 |
|
Long-term Provisions |
829,190,752 |
1,524,216,756 |
2,555,351,979 |
|
Other Non-current Liabilities |
185,856,512 |
130,996,430 |
61,310,000 |
|
Total Liabilities |
233,112,121,846 |
210,986,081,438 |
220,095,179,586 |
LIABILITIES &
SHAREHOLDERS' EQUITY [BAHT]
|
Current
Liabilities |
2012 |
2011 [Restated] |
2010 [Restated] |
|
|
|
|
|
|
Shareholders' Equity |
|
|
|
|
|
|
|
|
|
Share capital : Baht 10
par value Authorized &
issued share capital 2,698.90 million
shares |
26,989,009,500 |
26,989,009,500 |
26,989,009,500 |
|
|
|
|
|
|
Capital Paid |
21,827,719,170 |
21,827,719,170 |
21,827,719,170 |
|
Premium on Ordinary Shares |
25,548,223,951 |
25,548,223,951 |
25,548,223,951 |
|
Retained Earning Appropriated Legal Reserve |
2,691,275,568 |
2,469,792,865 |
2,469,792,865 |
|
Unappropriated |
16,176,227,306 |
11,968,055,932 |
24,934,200,021 |
|
Total Shareholders' Equity |
66,243,445,995 |
61,813,791,918 |
74,779,936,007 |
|
Total Liabilities & Shareholders' Equity |
299,355,567,841 |
272,799,873,356 |
294,875,115,593 |
PROFIT &
LOSS ACCOUNT
|
Revenue |
2012 |
2011 |
2010 [Restated] |
|
|
|
|
|
|
Revenues from Sale or Revenues from Service Passenger &
Excess Baggage |
165,485,878,390 |
154,646,038,064 |
144,862,179,813 |
|
Freight |
25,838,723,744 |
27,245,224,586 |
27,391,294,840 |
|
Mail |
906,912,641 |
846,773,123 |
838,688,162 |
|
Other Activities |
8,826,571,593 |
7,953,888,559 |
7,181,174,045 |
|
Total Revenues from
Sale or Revenues from Service |
201,058,086,368 |
190,691,924,332 |
180,273,336,860 |
|
Other Income Interest Income |
442,687,520 |
696,064,855 |
175,552,112 |
|
Others |
2,753,902,024 |
2,825,207,874 |
3,666,122,646 |
|
Total Other Income |
3,196,589,544 |
3,521,272,729 |
3,841,674,758 |
|
Total Revenues |
204,254,675,912 |
194,213,197,061 |
184,115,011,618 |
|
Expenses |
|
|
|
|
Fuel & Oil |
77,480,576,480 |
76,388,558,174 |
56,518,905,218 |
|
Employee benefits Expenses |
31,543,539,495 |
30,964,018,415 |
34,484,049,321 |
|
Flight Service Expenses |
20,693,196,467 |
20,427,965,628 |
19,064,241,405 |
|
Crew Expenses |
5,546,598,602 |
5,485,141,957 |
5,092,478,171 |
|
Aircraft Maintenance & Overhaul Costs |
11,288,227,430 |
11,698,186,020 |
9,674,696,586 |
|
Depreciation & Amortization
Expenses |
20,424,026,088 |
19,977,881,694 |
20,224,771,922 |
|
Lease of Aircraft
& Spare Parts |
3,683,317,045 |
5,429,503,645 |
4,330,692,346 |
|
Inventories & Supplies |
9,415,467,950 |
9,042,071,447 |
9,045,666,940 |
|
Selling & Advertising Expenses |
6,466,595,641 |
5,816,205,759 |
6,060,948,019 |
|
Insurance Expenses |
760,285,940 |
732,966,634 |
675,150,146 |
|
Impairment Losses of
Assets |
589,772,919 |
939,895,341 |
123,265,061 |
|
Impairment loss of
Aircraft |
181,143,438 |
180,909,303 |
170,914,911 |
|
Other Expenses |
8,593,446,506 |
7,079,838,343 |
5,990,978,336 |
|
Losses [gains] on
Foreign Currency Exchange |
[3,207,273,109] |
2,430,282,274 |
[9,114,515,204] |
|
Finance Costs |
5,838,536,325 |
5,657,410,445 |
5,165,714,842 |
|
Total Expenses |
199,297,457,217 |
202,250,835,079 |
167,507,958,020 |
|
Profit / [Loss] before Income Tax |
4,957,218,695 |
[8,037,638,018] |
16,607,053,598 |
|
Income Tax Expense |
[527,564,618] |
[2,200,830,323] |
[1,816,968,739] |
|
|
|
|
|
|
Net Profit / [Loss] for
the Year |
4,429,654,077 |
[10,238,468,341] |
14,790,084,859 |
FINANCIAL ANALYSIS
|
ITEM |
UNIT |
2012 |
2011 |
2010 |
|
|
|
|
|
|
|
LIQUIDITY RATIO |
|
|
|
|
|
CURRENT RATIO |
TIMES |
0.85 |
0.83 |
0.96 |
|
QUICK RATIO |
TIMES |
0.54 |
0.61 |
0.78 |
|
|
|
|
|
|
|
ACTIVITY RATIO |
|
|
|
|
|
FIXED ASSETS TURNOVER |
TIMES |
0.88 |
0.89 |
0.84 |
|
TOTAL ASSETS TURNOVER |
TIMES |
0.64 |
0.67 |
0.59 |
|
INVENTORY CONVERSION PERIOD |
DAYS |
21.89 |
22.02 |
23.11 |
|
INVENTORY TURNOVER |
TIMES |
16.67 |
16.57 |
15.80 |
|
RECEIVABLES CONVERSION PERIOD |
DAYS |
29.77 |
32.23 |
34.81 |
|
RECEIVABLES TURNOVER |
TIMES |
12.26 |
11.33 |
10.48 |
|
PAYABLES CONVERSION PERIOD |
DAYS |
12.06 |
21.01 |
21.32 |
|
CASH CONVERSION CYCLE |
DAYS |
39.60 |
33.24 |
36.60 |
|
|
|
|
|
|
|
PROFITABILITY
RATIO |
|
|
|
|
|
COST OF GOODS SOLD |
% |
67.48 |
69.93 |
63.59 |
|
SELLING & ADMINISTRATION |
% |
33.16 |
37.66 |
30.20 |
|
INTEREST |
% |
3.04 |
3.10 |
2.98 |
|
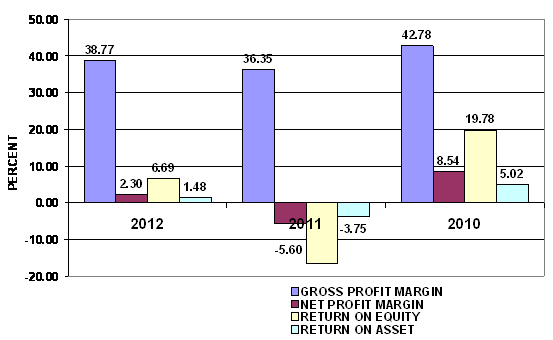
GROSS PROFIT MARGIN |
% |
38.77 |
36.35 |
42.78 |
|
NET PROFIT MARGIN BEFORE EX. ITEM |
% |
2.58 |
(4.40) |
9.59 |
|
NET PROFIT MARGIN |
% |
2.30 |
(5.60) |
8.54 |
|
RETURN ON EQUITY |
% |
6.69 |
(16.56) |
19.78 |
|
RETURN ON ASSET |
% |
1.48 |
(3.75) |
5.02 |
|
EARNING PER SHARE |
BAHT |
2.03 |
(4.69) |
6.78 |
|
|
|
|
|
|
|
LEVERAGE RATIO |
|
|
|
|
|
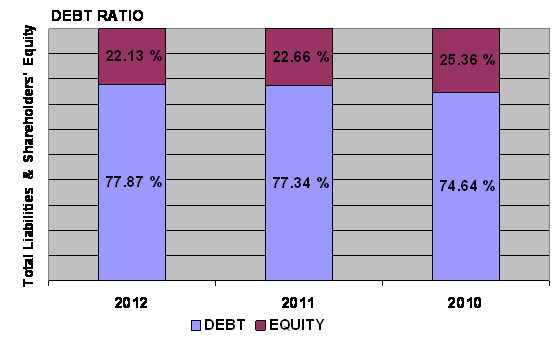
DEBT RATIO |
TIMES |
0.78 |
0.77 |
0.75 |
|
DEBT TO EQUITY RATIO |
TIMES |
3.52 |
3.41 |
2.94 |
|
TIME INTEREST EARNED |
TIMES |
0.85 |
(1.42) |
3.21 |
|
|
|
|
|
|
|
ANNUAL GROWTH |
|
|
|
|
|
SALES GROWTH |
% |
5.20 |
5.57 |
|
|
OPERATING PROFIT |
% |
(161.68) |
(148.40) |
|
|
NET PROFIT |
% |
143.26 |
(169.23) |
|
|
FIXED ASSETS |
% |
6.58 |
(0.54) |
|
|
TOTAL ASSETS |
% |
9.73 |
(7.49) |
|
ANNUAL GROWTH :
IMPRESSIVE
An annual sales growth is 5.2%. Turnover has increased from THB
182,738,035,773.00 in 2011 to THB 192,231,514,775.00 in 2012. While net profit
has increased from THB -10,238,468,341.00 in 2011 to THB
PROFITABILITY :
EXCELLENT
PROFITABILITY
RATIO
|
Gross Profit Margin |
38.77 |
Impressive |
Industrial
Average |
19.79 |
|
Net Profit Margin |
2.30 |
Impressive |
Industrial
Average |
0.74 |
|
Return on Assets |
1.48 |
Impressive |
Industrial
Average |
1.47 |
|
Return on Equity |
6.69 |
Impressive |
Industrial
Average |
3.09 |
Gross Profit Margin used to assess a firm's financial health by revealing
the proportion of money left over from revenues after accounting for the cost
of goods sold. Gross profit margin serves as the source for paying additional
expenses and future savings. The
company’s figure is in 38.77%. When compared with the industry average, the
ratio of the company was higher, indicated that company was more profitable
than the same industry.
Net Profit Margin is the indicator of the company's efficiency in that
net profit takes into consideration all expenses of the company. A low profit
margin indicates a low margin of safety, higher risk that a decline in sales
will erase profits and result in a net loss. The company’s figure is 2.3%, higher figure when compared with those
of its average competitors in the same industry, indicated that business was an
efficient operator in a dominant
position within its industry.
Return on Assets measures how efficiently profits are being generated
from the assets employed in the business when compared with the ratios of firms
in a similar business. A low ratio in comparison with industry averages
indicates an inefficient use of business assets. Return on Assets ratio is
1.48%, higher figure when compared with those of its average competitors in the
same industry, indicated that business was an efficient profit in a dominant position within its industry.
Return on Equity indicates how profitable a company is by comparing its
net income to its average shareholders' equity, ROE measures how much the
shareholders earned for their investment in the company. Return on Equity ratio
is 6.69%, higher figure when compared with those of its average competitors in
the same industry, indicated that business was an efficient profit in a dominant position within its industry.
Trend of the
average competitors in the same industry for last 5 years
Return on Assets Downtrend
Return on Equity Downtrend
LIQUIDITY : RISKY
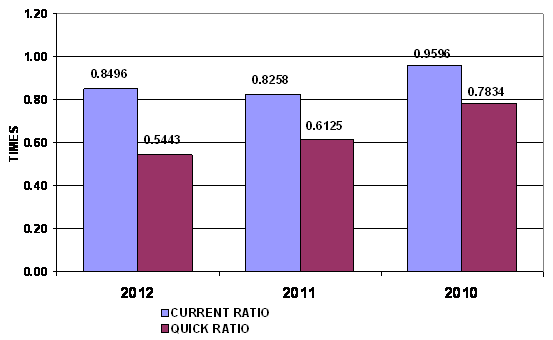
LIQUIDITY RATIO
|
Current Ratio |
0.85 |
Risky |
Industrial
Average |
0.93 |
|
Quick Ratio |
0.54 |
|
|
|
|
Cash Conversion Cycle |
39.60 |
|
|
|
The Current Ratio is to ascertain whether a company's short-term assets
are readily available to pay off its short-term liabilities. The company's figure
is 0.85 times in 2012, increased from 0.83 times, then the company may have
problems meeting its short-term obligations. When compared with the industry
average, the ratio of the company was lower.
The Quick Ratio is a liquidity indicator that further refines the
current ratio by measuring the amount of the most liquid current assets there
are to cover current liabilities. The company's figure is 0.54 times in 2012,
decreased from 0.61 times, then the company has not enough current assets that
presumably can be quickly converted to cash for pay financial obligations.
The Cash Conversion Cycle measures the number of days a company's cash
is tied up in the production and sales process of its operations and the
benefit from payment terms from its creditors. It meant the company could
survive when no cash inflow was received from sale for 40 days.
Trend of the
average competitors in the same industry for last 5 years
Current Ratio Downtrend
LEVERAGE : RISKY

LEVERAGE RATIO
|
Debt Ratio |
0.78 |
Acceptable |
Industrial
Average |
0.52 |
|
Debt to Equity Ratio |
3.52 |
Risky |
Industrial
Average |
1.01 |
|
Times Interest Earned |
0.85 |
Risky |
Industrial
Average |
(1.29) |
Debt to Equity Ratio a measurement of how much suppliers, lenders,
creditors and obligors have committed to the company versus what the shareholders
have committed. A lower the percentage means that the company is using less
leverage and has a stronger equity position.
Times Interest Earned measuring a company's ability to meet its debt
obligations. Ratio is 0.85 lower than 1, so the company is not generating
enough cash from EBIT to meet its
interest obligations.
Debt Ratio shows the proportion of a company's assets which are financed
through debt. The company's figure is 0.78 greater than 0.5, most of the
company's assets are financed through debt.
Trend of the
average competitors in the same industry for last 5 years
Debt Ratio Downtrend
Times Interest Earned Downtrend
ACTIVITY :
ACCEPTABLE

ACTIVITY RATIO
|
Fixed Assets Turnover |
0.88 |
Acceptable |
Industrial
Average |
1.68 |
|
Total Assets Turnover |
0.64 |
Deteriorated |
Industrial
Average |
1.43 |
|
Inventory Conversion Period |
21.89 |
|
|
|
|
Inventory Turnover |
16.67 |
Deteriorated |
Industrial
Average |
41.52 |
|
Receivables Conversion Period |
29.77 |
|
|
|
|
Receivables Turnover |
12.26 |
Impressive |
Industrial
Average |
(0.49) |
|
Payables Conversion Period |
12.06 |
|
|
|
The company's Account Receivable Ratio is calculated as 12.26 and
Inventory Turnover in Days Ratio indicates the liquidity of inventory.
It estimates the number of days that it will take to sell the current
inventory. Inventory is particularly sensitive to change in business
activities. The inventory turnover in days
is 22 days at the end of
2011, same figure
as in 2012.
And Inventory turnover has increased from 16.57 times in year 2011 to
16.67 times in year 2012.
The company's Total Asset Turnover is calculated as 0.64 times and 0.67
times in 2012 and 2011 respectively. This ratio is determined by dividing total
assets into total sales turnover. The ratio measures the activity of the assets
and the ability of the firm to generate sales through the use of the assets.
Trend of the
average competitors in the same industry for last 5 years
Fixed Assets Turnover Uptrend
Total Assets Turnover Uptrend
Inventory Turnover Uptrend
Receivables Turnover Downtrend
FOREIGN EXCHANGE RATES
|
Currency |
Unit
|
Indian Rupees |
|
US Dollar |
1 |
Rs.54.39 |
|
|
1 |
Rs.82.32 |
|
Euro |
1 |
Rs.69.54 |
INFORMATION DETAILS
|
Report
Prepared by : |
PRL |
RATING EXPLANATIONS
|
RATING |
STATUS |
PROPOSED CREDIT LINE |
|
|
>86 |
Aaa |
Possesses an extremely sound financial base with the strongest capability
for timely payment of interest and principal sums |
Unlimited |
|
71-85 |
Aa |
Possesses adequate working capital. No caution needed for credit
transaction. It has above average (strong) capability for payment of interest
and principal sums |
Large |
|
56-70 |
A |
Financial & operational base are regarded healthy. General
unfavourable factors will not cause fatal effect. Satisfactory capability for
payment of interest and principal sums |
Fairly Large |
|
41-55 |
Ba |
Overall operation is considered normal. Capable to meet normal
commitments. |
Satisfactory |
|
26-40 |
B |
Capability to overcome financial difficulties seems comparatively
below average. |
Small |
|
11-25 |
Ca |
Adverse factors are apparent. Repayment of interest and principal sums
in default or expected to be in default upon maturity |
Limited with
full security |
|
<10 |
C |
Absolute credit risk exists. Caution needed to be exercised |
Credit not
recommended |
|
-- |
NB |
New Business |
-- |
This score serves as a reference to assess
SC’s credit risk and to set the amount of credit to be extended. It is
calculated from a composite of weighted scores obtained from each of the major
sections of this report. The assessed factors and their relative weights (as
indicated through %) are as follows:
Financial
condition (40%) Ownership
background (20%) Payment
record (10%)
Credit history
(10%) Market trend (10%) Operational size
(10%)
This report is issued at your request without any
risk and responsibility on the part of MIRA INFORM PRIVATE LIMITED (MIPL)
or its officials.