MIRA INFORM REPORT


Report Date :

02.05.2013


IDENTIFICATION DETAILS


Name :

OCP SA


Registered Office :

2 Rue Al Abtal, Hay Erraha, Casablanca


Country :

Morocco


Financials (as on) :

31.12.2011


Date of Incorporation :

07.08.1920


Com. Reg. No.:

40327


Legal Form :

Societe Anonyme


Line of Business :

Mining of chemical and fertiliser minerals


No. of Employees :

19000 employees


RATING & COMMENTS


MIRA’s Rating :

A


RATING

STATUS

PROPOSED CREDIT LINE

56-70

A

Financial & operational base are regarded healthy. General unfavourable factors will not cause fatal effect. Satisfactory capability for payment of interest and principal sums

Fairly Large


Status :

Good


Payment Behaviour :

Regular


Litigation :

Clear


NOTES:

Any query related to this report can be made on e-mail: infodept@mirainform.com while quoting report number, name and date.


ECGC Country Risk Classification List – March 31st, 2013


Country Name

Previous Rating

(31.12.2012)

Current Rating

(31.03.2013)

Morocco

A2

A2


Risk Category

ECGC Classification

Insignificant


A1

Low


A2

Moderate


B1

High


B2

Very High


C1

Restricted


C2

Off-credit


D


Morocco - ECONOMIC OVERVIEW


Morocco has capitalized on its proximity to Europe and relatively low labor costs to build a diverse, open, market-oriented economy. In the 1980s Morocco pursued austerity measures and pro-market reforms, overseen by the IMF. Since taking the throne in 1999, King MOHAMMED VI has presided over a stable economy marked by steady growth, low inflation, and generally declining government debt. Industrial development strategies and infrastructure improvements - most visibly illustrated by a new port and free trade zone near Tangier - are improving Morocco's competitiveness. Key sectors of the economy include agriculture, tourism, phosphates, textiles, apparel, and subcomponents. In 2006 Morocco entered into a bilateral Free Trade Agreement with the United States; it remains the only African country to have one. In 2008 Morocco entered into an Advanced Status agreement with the European Union. Despite Morocco's economic progress, the country suffers from high unemployment and poverty. In 2011, high food and fuel prices strained the government's budget and widened the country's current account deficit. Key economic challenges for Morocco include fighting corruption, reducing government spending, reforming the education system and judiciary, addressing socioeconomic disparities, and building more diverse, higher value-added industries.


Source : CIA


Company name


OCP SA


Rating Briefing


Payment Record:                                    REGULAR

                                                              This rating is based on available data. In the event of additional

                                                              information a possibility for a different rating applies.


Registration Briefing


Registration Number:                             40327

Registration Date:                                   07/08/1920

Legal Form:                                            SOCIETE ANONYME

Latest Financials:                                   December 31, 2011


Financial Briefing


Nominal Capital:                                     8,287,500,000 Moroccan Dirham

Issued Capital:                                       N/A

Turnover:                                               28,219,706,858 Moroccan Dirham

Net Profit:                                               14,621,757,338 Moroccan Dirham

Net Worth:                                              40,352,017,237 Moroccan Dirham


Original Investigation Details


Investigation Number:                                  170156

Company Name:                                         OCP SA

Country:                                                      MO

Street Name:

City Code:                                                  2‑5 RUE AL ABTAL HAY ERRAH


Company Details


Company Name:                                         OCP SA

Headquarter Address:                                  2‑4 Rue Al Abtal,

                                                                  Hay Erraha,

                                                                  Casablanca 20200,

                                                                  Morocco


Postal Address:                                          P.O.Box 5196,

                                                                  Casablanca


Telephone:                                                  +212522 223024

                                                                  +212522 230025

                                                                  +212522 231025

                                                                  +212522 232025


Fax:                                                            +212522 230624

                                                                  +212522 991263

                                                                  +212522 998382


Web Site:                                                    www.ocpgroup.ma


Company has been in it's present legal form since: 26/02/2008

Company was originally started as a STATE OWNED CONCERN on 07/08/1920


Registration & Legal Details


Current Legal Form:                                   SOCIETE ANONYME

Registration Address:                                2 Rue Al Abtal, Hay Erraha,

Casablanca

Registration Number:                                 40327

Registration Date:                                     07/08/1920

Year/Date Company Established:               07/08/1920

Registration Town:                                     Casablanca

Tax Registration Number:                           02220794


Capital


Currency:                                                                Moroccan Dirham

Authorized Capital:                                                        8,287,500,000

Paid Up Capital:                                                            8,287,500,000


Authorized Capital Breakdown


Number of Shares: 82,875,000                   Type of Shares:  None Selected

Issued Shares: 82,875,000                         Value per share: MDH 100.00               Value of this type:

                                                                                                                          8,287,500,000.00


Shareholders / Owners


Parent Company:                                     MOROCCAN STATE,

                                                                Morocco

                                                                % Shares Held:   94.11%


Shareholders:


Name/Other Information                                                   Shares Held                              % of

                                                                                                                                      Voting/Non‑Voting

                                                                                                                                      capital

Banque Centrale Populaire,                                            4,874,999                                  5.88% (VOTING)

101, Boulevard Mohamed Zerktouni,

Casablanca,

Morocco

Other Shareholders,                                                       10

Morocco


Principals


Name:                                                       Mr Mostafa Terrab

Position within the company:                     President and managing director

Date of Birth:                                            19/10/1955

Country of Birth:                                        Morocco

Nationality:                                                Moroccan

Can fluently speak:                                    Arabic, French & English

Education:                                                Technical University

Schools Attended:                                    Massachusetts Institute of Technology, Cambridge, USA

Other qualifications include:                       Master degree in Engineering Institut in Paris


Name:                                                       Mr Mohamed El Kadiri

Position within the company:                     General Secretary

Country of Birth:                                        Morocco

Nationality:                                                Moroccan

Can fluently speak:                                    Arabic & French


Name:                                                       Mr Amar Drissi

Position within the company:                     Industrial relations Director

Country of Birth:                                        Morocco

Nationality:                                                Moroccan

Can fluently speak:                                    Arabic, French & English


Name:                                                       Mr Mohamed El Hajjouji


Position within the company:                     Finance Director

Country of Birth:                                        Morocco

Nationality:                                                Moroccan

Can fluently speak:                                    Arabic, French & English


Name:                                                       Mr M'hamed Ibnabdeljalil

Position within the company:                     Commercial Director

Country of Birth:                                        Morocco

Nationality:                                                Moroccan

Can fluently speak:                                    Arabic, French & English


Company Activities


NACE Codes:         0891           Mining of chemical and fertiliser minerals


OCP Group, together with its subsidiaries, engages in mining, processing, exporting, and marketing phosphates in Morocco.


The company produces phosphate rock; and phosphate derivatives, such as basic and purified phosphoric acid, and phosphate fertilizers. Its phosphate rock is primarily used in the manufacture of fertilizers; and phosphoric acid is used in lemonades, yeasts, cheese, meat and fish preservation, drinkable water treatment, detergents, animal feed, foliar fertilizers, metal treatment, textiles and cement.


Local Reporters consider the investigated company to be LARGE in their field of concern.


Operations


  Employees                                             Company Employs: 19000


  HQ Premises                                          Operates from:    Owned Offices

                                                                Premises Size:    20000 square meters

                                                                Location:            Central Business Area


  Branches                                                Maroc Chimie,

                                                                Route Jorf El Youdi,

                                                                Safi,

                                                                Morocco

                                                                Branch is: Owned

                                                                Description of branch: Factory

                                                                These premises operate as: Production of phosphoric acid with

                                                                400.000 Tons P205.


                                                                Maroc Chimie,

                                                                Route Jorf El Youdi,

                                                                Safi,

                                                                Morocco

                                                                Branch is: Owned

                                                                Description of branch: Factory

                                                                These premises operate as: Production of phosphoric acid, within

                                                                400.000 Tons P205.


                                                                Maroc Chimie,

                                                                Route Jorf El Youdi,

                                                                Safi,

                                                                Morocco

                                                                Branch is: Owned

                                                                Description of branch: Factory

These premises operate as: Production of phosphoric acid, within 400.000 Tons P205.


                                                                Maroc Phosphore III‑ IV,

                                                                100 Km de Marrakech,

                                                                Khouribga,

                                                                Morocco

                                                                Branch is: Owned

                                                                Description of branch: Factory

                                                                These premises operate as: Production of phosphoric acid, within the

                                                                capacity of 1.4 Million /Tons of P205


                                                                Gantour,

                                                                100 Km de Marrakech,

                                                                Youssoufia,

                                                                Morocco

                                                                Branch is: Owned

                                                                Description of branch: Factory

                                                                Branch premises size: 2,500.00 sq.mtrs.


                                                                77 Km de Youssoufia,

                                                                Benguerir,

                                                                Morocco

                                                                Branch is: Owned

                                                                Description of branch: Factory


                                                                Boucraa‑Layoune,

                                                                Laayoune,

                                                                Morocco

                                                                Branch is: Owned

                                                                Description of branch: Factory


Imports

                                                                                                              Imports Raw Materials, Imports

                                                                                                              Finished Goods

                                                              Imports From:                           USA, Canada, Russia, Ukraine,

                                                                                                              European

                                                                                                              Community

                                                              Importing Terms:                       Special agreements


Exports


                                                              Export % and type of product:   95%

                                                              Exports To:                               France, USA, Brazil, United Kingdom,

                                                                                                               Italy, Spain,

                                                                                                               India, China, Poland, Indonesia,

                                                                                                               Norway

Exporting Terms:           special agreements


Trading & Selling

Territory:                                                  5% Nationally, 95% International


Related Companies


Subsidiaries

                                  Centre d'Etudes et de Recherches

                                  des Phosphates Mineraux

                                  (Cerphos)

                                  Casablanca,                                    Owned 100% by subject

                                  Morocco

                                                                                        Start date: 1975

                                 Operates as: Research center for the technics and mineral processing


                                  Maroc Phosphore

                                  Morocco                                         Owned 100% by subject

                                 Operates as: production of phosphoric acid and fertilizers


                                  Societe de Transports Regionaux

                                  (Sotreg)

                                  Casablanca,                                    Owned 100% by subject

                                  Morocco

                                 Operates as: tranporting OCP Group's employees


                                  Ste Marocaine d'Etudes Speciales

                                  et Industrielles (Smesi)

                                  Casablanca,                                    Owned 100% by subject

                                  Morocco

                                                                                        Start date: 1959

                                 Operates as: company of engineering of studies and industrial achievements


                                  Phosphates de Boucraa

                                  Casablanca,                                    Owned 100% by subject

                                  Morocco

                                                                                        Start date: 1962

                                 Operates as: phosphate working.


                                  COMARAM

                                  Morocco                                         Owned 100% by subject

                                 Operates as: Sea transport


                                  GPFCE

                                  Morocco                                         Owned 100% by subject

                                 Operates as: Finance


                                  Pakistan Maroc Phosphore

                                  Casablanca,                                    Owned 50% by subject

                                  Morocco

                                 Operates as: Phosphates processing


                                  Bunge Maroc Phosphore

                                  Morocco                                         Owned 50% by subject

                                 Operates as: Phosphates processing


  Affiliates

                                  EMAPHOS

                                  Casablanca,                                   Owned 33% by subject

                                  Morocco

                                  Operates as: manufacturing of phosphoric acid


                                  IMACID

                                  Casablanca,                                   Owned 33% by subject

                                  Morocco

                                  Operates as: manufacturing of phosphoric acid


Bankers


Attijariwafa Bank,

Branch: Head Office

163 Avenue Hassan II,

Casablanca,

Morocco

Account Number:                                        12010129744


Banque Centrale Populaire,

Branch: Head Office

101 Boulevard Mohamed Zerktouni,

Casablanca,

Morocco

Account Number:                                        212119950010005


Société Générale,

Branch: Head Office

55 Boulevard Abdelmoumen,

Casablanca,

Morocco


Citibank Maghreb,

Branch: Head Office

Zenith Millenium Immeuble 1, lot Attaoufik,

Casablanca,

Morocco


Financial Information


Source:                                                     Companies Registry

Figures are:                                               Official Figures

Currency:                                                  Moroccan Dirham


Months   Sales Figures                             Sales                                    Gross Profit/Loss           Net

                                                                                                                                                  Profit/Loss

               12                31/12/2011              28,219,706,858                     18,623,680,496                14,621,757,338

               12                31/12/2010              19,870,322,276                     10,469,158,436                8,302,420,062

               12                31/12/2009              11,867,877,186                     4,775,328,815                  3,745,599,671

               12                31/12/2008              27,580,014,129                     24,388,147,411                22,067,285,965

               12                31/12/2007              5,303,915,726                       3,436,634,144                  2,829,272,286


Balance Sheet & Profit & Loss


BALANCE SHEET

                                                                   As at: 31‑Dec‑2011                   As at: 31‑Dec‑2010  As at: 31‑Dec‑2009

  Fixed Assets

  Land & Buildings                                            1,531,973,005                           1,197,776,130                           1,194,172,057

  Plant & Machinery                                          5,112,710,101                           1,154,358,580                           1,154,435,644

  Furniture & Equipment                                         65,653,523                               51,577,756                               51,472,277

  Motor Vehicles                                                   22,413,830                               12,206,301                                 8,808,405

  Misc. Fixed Assets                                         4,358,453,875                           3,974,424,914                           2,138,994,872

  Total Fixed Assets                                       11,091,204,334                           6,390,343,681                           4,547,883,255


  Financial Assets

  Shares in Related Companies                       10,068,080,175                           8,775,147,998                           8,605,253,794

  Loans to related companies

  Investments                                                          8,903,292                                 9,264,965                               10,584,986

  Deposits

  Misc. Financial Assets                                        55,805,077                               55,507,746                               62,947,763

  Total Financial Assets                                 10,132,788,544                           8,839,920,709                           8,678,786,543


  Intangibles

  Goodwill

  Organisational Expenses                                    89,990,117                               89,047,669                              339,360,679

  Patents                                                                9,700,711                               13,257,335                               29,424,849

  Misc. Intangible Assets                                       91,121,954                               61,375,260                               42,859,626

  Total Intangible Assets                                    190,812,782                              163,680,264                              411,645,154


  Current Assets

  Stock                                                            1,075,896,866                              915,432,719                              984,353,897

  Stock & Work in Progress                                  639,729,482                              580,497,448                              560,286,641

  Trade Debtors & receivables                         14,574,124,436                           5,670,017,297                           6,497,887,878

  Provision for bad debs

  Other receivables                                           3,477,055,926                           4,193,461,801                           4,696,467,747

  Due from related companies

  Owed by shareholders

  Prepaid expenses                                          1,459,868,297                              563,267,398                              533,775,630

  Cash                                                             1,616,010,296                              689,194,987                              501,156,199

  Tax recoverable                                             2,161,028,906                           1,538,537,783                           2,251,726,475

  Marketable Securities                                    22,617,399,843                         24,106,498,067                         16,390,899,285

  Misc. Current Assets                                      3,378,813,228                           4,661,111,877                           1,957,460,897

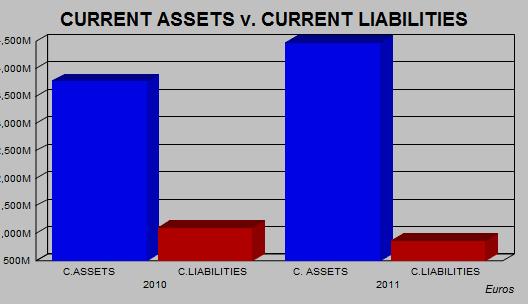
  Total Current Assets                                    50,999,927,280                         42,918,019,377                         34,374,014,649

  Total Assets                                                72,414,732,940                         58,311,964,031                         48,012,329,601

  Owner's Equity & Liabilities

  Issued and paid up capital                              8,287,500,000                           8,287,500,000                           8,287,500,000

  Share premium account                                  4,512,500,000                           4,512,500,000                           4,512,500,000

  Retained earnings                                          4,611,109,899                                 7,228,385                               70,577,448

  Net profit/Loss for the year                           14,621,757,338                           8,302,420,062                           3,745,599,671

  Revaluation reserves

  Legal Reserves                                                 828,750,000                              671,878,119                              483,898,135

  Other reserves                                               7,490,400,000                           7,490,400,000                           5,050,400,000

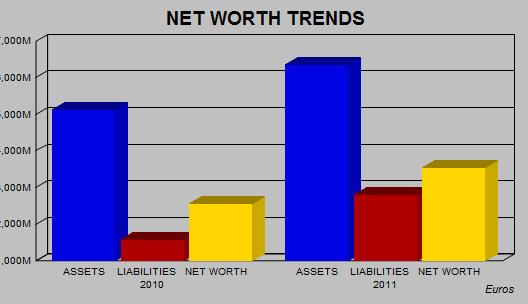
  Net Worth                                                    40,352,017,237                         29,271,926,566                         22,150,475,254


  Deffered Taxation

  Provisions/allowances                                  12,648,804,673                           8,576,663,661                         11,591,603,988

  Mortgages/Loans                                           9,416,778,890                           7,725,832,878                           9,072,087,606

  Hire purchase

  Due to group of companies

  Minority interest

  Misc. deferred liabilities                                      86,256,276                               90,373,162                               93,228,264

  Total Long Term Liabilities                         22,151,839,839                         16,392,869,701                         20,756,919,858


  Current Liabilities

  Creditors                                                       1,985,530,923                           1,715,560,435                           1,597,854,442

  Other creditors                                               3,796,438,226                           1,312,681,035                              472,306,271

  Accruals                                                             95,083,737                               64,546,234                               64,377,224

  Bank overdrafts/Loans                                      105,002,587                           7,401,235,651                               80,633,625

  Misc. Loans

  Directors accounts

  Owing to shareholders

  Owing to related companies

  Proposed dividend

  Long Term‑due 1 year

  Hire Purchase‑under 1 year

  Taxation                                                        2,103,736,632                           1,283,820,798                              163,110,533

  Advance receipts                                           1,042,307,096                              155,879,103                           1,850,440,719

  Misc. Current Liabilities                                     782,776,663                              713,444,508                              876,211,675

  Total Current Liabilities                                9,910,875,864                         12,647,167,764                           5,104,934,489

  Owner's Equity & Liabilities                        72,414,732,940                         58,311,964,031                         48,012,329,601


PROFIT & LOSS


                                                                        Figures are:       Figures are:                                    Figures are:

                                                                        Fiscal Year        Fiscal Year                                        Fiscal Year


                                                            01/01/2011 to 31/12/2011           01/01/2010 to 31/12/2010           01/01/2009

                                                                                                                                                      to 31/12/2009

  Total Income/Turnover                                  28,219,706,858                         19,870,322,276                         11,867,877,186

  Cost of sales                                                    318,397,784                               16,096,254


  Gross Profit/(Loss)                                       27,901,309,074                         19,854,226,022                         11,867,877,186


  Admin/selling expenses                                  2,802,572,758                           2,472,811,160                           1,999,038,830

  Services                                                        2,808,621,321                           2,490,013,333                           1,937,825,709

  Salaries                                                         3,682,881,076                           3,035,012,297                           2,789,258,152

  Auditors Fee                                                     124,313,305                              121,697,982                               68,868,802

  Stock Depreciation                                            ‑46,248,915                               47,915,041                             ‑143,990,612

  Depreciation                                                  1,631,626,141                           1,531,877,149                           1,561,263,469

  Misc. Operating Expenses                                  18,207,389                               50,220,947                                 2,931,051

  Misc. Operating Income                                  1,112,488,612                           1,209,780,876                           1,580,893,891

  Net Operating Profit/(Loss)                          17,991,824,611                         11,314,458,989                           5,233,575,676


  Interest Receivable/Finance Income                   896,067,667                           1,229,500,215                              745,059,948

  Group related income                                        129,894,811                               65,584,808                              156,937,316

  Misc. Financial Income                                   1,779,083,054                           7,379,422,679                              544,793,138

  Total Financial Income                                 2,805,045,532                           8,674,507,702                           1,446,790,402


  Interest Payable/Finance costs                          401,218,209                              436,658,113                              472,575,798

  Misc. financial expenses                                1,771,971,438                           9,083,150,142                           1,432,461,465

  Total Financial Expenses                              2,173,189,647                           9,519,808,255                           1,905,037,263


  Profit/(Loss) before taxes                            18,623,680,496                         10,469,158,436                           4,775,328,815


  Income Tax                                                    4,001,923,158                           2,166,738,374                           1,029,729,144

  Other Tax

  Profit/(Loss) after taxes                               14,621,757,338                           8,302,420,062                           3,745,599,671


  Extraordinary items

  Exceptional items

  Misc. Items


  Net Profit/(Loss)                                          14,621,757,338                           8,302,420,062                           3,745,599,671


  Previous years retained earnings

  Current years net income                              14,621,757,338                           8,302,420,062                           3,745,599,671

  Misc. additions in current year

  Current years net loss

  Dividends in current year

  Withdrawals in current year

  Misc. deductions in current year


  Retained earnings at end of                         14,621,757,338                           8,302,420,062                           3,745,599,671

  financial period


  Average employees


  Directors fee

  Earnings per share

  Earnings per share‑previous year


Auditors Comments


Date accounts obtained:                           05/11/2012

Accounts obtained from:                          Companies registry


Auditors Opinion:                                    The audited financial statement gives a true and fair view of the state of

                                                                affairs of the             subject


Financial Statements have been prepared on an on‑going basis. Assuming support of: shareholders


FINANCIAL RATIOS / COMPARATIVE DATA


                                      Actual Company      Industrial Averages      Actual Company      Industrial Averages

                                        Results (2011)                   (2011)                  Results (2010)                   (2010)

  Liquidity Ratios

  Current Ratio                                      5.15                            8.50                           3.39                            4.29

  Acid Test Ratio                                   4.97                            8.18                           3.28                            4.00

  Accounts                                           0.07                            0.06                           0.09                            0.15

  Payable/Sales Ratio

  Current Liabilities/Net                          0.25                            0.18                           0.43                            8.11

  Worth

  Current                                               5.78                            5.78                           8.45                            5.95

  Liabilities/Inventory

  Total Liabilities/Net                             0.79                            0.68                           0.99                          10.80

  Worth

  Fixed Assets/Net                              27.49                          23.55                          21.83                        456.75

  Worth (%)


  Profitability Ratios

  Gross Profit Ratio (%)                       98.87                          99.44                          99.92                          99.78

  Return on Capital                              29.80                          36.05                          22.93                            8.93

  Employed (ROCE)(%)

  Net Profit/Sales (%)                          66.00                          67.64                          52.69                          33.14

  Return on Assets (%)                        25.72                          32.55                          17.95                          13.11


  Efficiency Ratios

  Sales/Working Capital                         0.69                            0.73                           0.66                            4.51

  Assets/Sales(%)                             256.61                        216.25                        293.46                        375.88

  Shareholders                                    46.15                          53.84                          35.77                       ‑180.57

  Return(%)

  Average Inventory                        1,141.40                     1,141.40                   21,539.86                    12,956.89

  Period

  Average Collection                          130.92                          79.08                        111.76                        114.79

  Period

  Sales/Inventory                                 16.45                          16.45                          13.28                          12.09


  Leverage Ratios

  Capital Employed                               0.70                            0.80                           0.68                           ‑0.99

  Capital Structure (%)                         35.44                          33.34                          35.90                          39.76


  Number of                                                                              10                                                                10

  Companies within the

  industry (NACE B)

  Statistics based on                                       Mining & quarrying                                        Mining & quarrying

  NACE(B)


The statistical Industrial Average results are calculated against companies within the database for the specific country.


INDUSTRY SECTOR COMPARATIVE DATA


        Elements Taken              Result for specific                    RANKING                Total Companies Used

                                                      company

DATE OF REGISTRATION                        07/08/1920                                       1                                     21

TOTAL EMPLOYEES                                     19,000                                       1                                     15

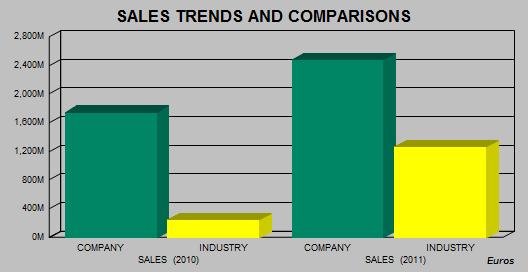
SALES (2011)                                     2,481,076,627                                       1                                       2

SALES (2010)                                     1,746,998,735                                       1                                       9

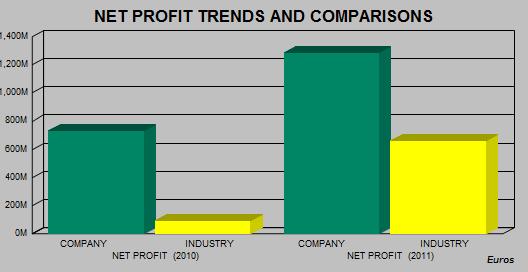
NET PROFIT (2011)                             1,285,544,905                                       1                                       2

NET PROFIT (2010)                                729,948,772                                       1                                       9

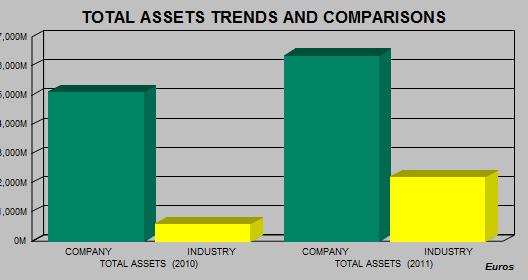
TOTAL ASSETS (2011)                        6,366,703,320                                       1                                       3

TOTAL ASSETS (2010)                        5,126,787,878                                       1                                     10


                                                                                                                                          Currency: EURO

Rankings:

The results given below are calculated against companies with the Database for the specific country.


Scale: 1 is the highest result found in our database.


Example: Ranking 5: Total Companies used to generate the Ranking : 20


This means that this company is the 5th largest company out of 20 found in our database in the specific industry


Charts of Financial Trends and Industry Comparisons


PLEASE NOTE THAT CHARTS ARE SHOWN IN EUROS FOR TREND AND COMPARISON PURPOSES


The statistical Industrial Average results are calculated against companies within the  database for the  specific country.


Payments


Subject's payments reported to be:      REGULAR

No record has been found of protested bills against the subject.


Representation


Other Comments

Other Comments:                                      Patent N° : 36000670


Interview & Reporter Comments


Comment:                                 Subject has confirmed the general details shown in the report.


Reporter Comment:                   All legal forms in Morocco are obliged by law to be registered with the Registry

Office (OMPIC: Office Marocain de la Propriete Industrielle et Commerciale) which is publicly available.


Subject was found registered and Information obtained from above official source is as follows :


Registered name / registration number / date of registration / registered address / legal form / capital / main principals – administrators / shareholders / shareholders % / related companies / financial information.


According to the Morocco Commercial Law, all legal forms except for proprietorship entities are obliged to file their financial accounts to the OMPIC.


Any other data stated in the report was obtained directly from the subject company and/or other publicly available information. Therefore it should be used as a point of reference as it is not possible to verify such data with official sources.


Conclusions


Local Reputation:          The company being investigated is well known and trusted in the local market and is

considered to be a sound trading partner with low trade risk associated.


General Conclusion:      As a State‑owned concern adequate resources should be made available.


Financial Results Trend: Financial Information indicates that the business activities of the company are

showing an upward turn.


Age of Business:          The company is long established in the local market.


FOREIGN EXCHANGE RATES


Currency

Unit

Indian Rupees

US Dollar

1

Rs.54.22

UK Pound

1

Rs.84.00

Euro

1

Rs.70.98


INFORMATION DETAILS


Report Prepared by :

NIT


RATING EXPLANATIONS


RATING

STATUS


PROPOSED CREDIT LINE

>86

Aaa

Possesses an extremely sound financial base with the strongest capability for timely payment of interest and principal sums


Unlimited

71-85

Aa

Possesses adequate working capital. No caution needed for credit transaction. It has above average (strong) capability for payment of interest and principal sums


Large

56-70

A

Financial & operational base are regarded healthy. General unfavourable factors will not cause fatal effect. Satisfactory capability for payment of interest and principal sums


Fairly Large

41-55

Ba

Overall operation is considered normal. Capable to meet normal commitments.


Satisfactory

26-40

B

Capability to overcome financial difficulties seems comparatively below average.


Small

11-25

Ca

Adverse factors are apparent. Repayment of interest and principal sums in default or expected to be in default upon maturity


Limited with full security

<10

C

Absolute credit risk exists. Caution needed to be exercised


Credit not recommended

--

NB

New Business


--


This score serves as a reference to assess SC’s credit risk and to set the amount of credit to be extended. It is calculated from a composite of weighted scores obtained from each of the major sections of this report. The assessed factors and their relative weights (as indicated through %) are as follows:


Financial condition (40%)            Ownership background (20%)                  Payment record (10%)

Credit history (10%)                   Market trend (10%)                                Operational size (10%)

PRIVATE & CONFIDENTIAL : This information is provided to you at your request, you having employed MIPL for such purpose. You will use the information as aid only in determining the propriety of giving credit and generally as an aid to your business and for no other purpose. You will hold the information in strict confidence, and shall not reveal it or make it known to the subject persons, firms or corporations or to any other. MIPL does not warrant the correctness of the information as you hold it free of any liability whatsoever. You will be liable to and indemnify MIPL for any loss, damage or expense, occasioned by your breach or non observance of any one, or more of these conditions

This report is issued at your request without any risk and responsibility on the part of MIRA INFORM PRIVATE LIMITED (MIPL) or its officials.