MIRA INFORM REPORT
|
Report Date : |
07.05.2013 |
IDENTIFICATION DETAILS
|
Name : |
COMARNE |
|
|
|
|
Registered Office : |
81 Rue Al Bachir Al Ibrahimi Angle Rue Blaye, Casablanca |
|
|
|
|
Country : |
Morocco |
|
|
|
|
Financials (as on) : |
31.12.2012 |
|
|
|
|
Date of Incorporation : |
13.11.1995 |
|
|
|
|
Com. Reg. No.: |
80843 |
|
|
|
|
Legal Form : |
Societe A Responsibilite Limitee |
|
|
|
|
Line of Business : |
Subject is engaged in import and wholesale of dried fruits. |
|
|
|
|
No. of Employees : |
15 |
RATING & COMMENTS
|
MIRA’s Rating : |
Ba |
|
RATING |
STATUS |
PROPOSED CREDIT LINE |
|
|
41-55 |
Ba |
Overall operation is considered normal. Capable to meet normal
commitments. |
Satisfactory |
|
Status : |
Satisfactory |
|
Payment Behaviour : |
No Complaints |
|
Litigation : |
Clear |
NOTES:
Any query related to this report can be made on
e-mail: infodept@mirainform.com
while quoting report number, name and date.
ECGC Country Risk Classification List – March, 31st, 2013
|
Country Name |
Previous Rating (31.12.2012) |
Current Rating (31.03.2013) |
|
Morocco |
A2 |
A2 |
|
Risk Category |
ECGC
Classification |
|
Insignificant |
A1 |
|
Low |
A2 |
|
Moderate |
B1 |
|
High |
B2 |
|
Very High |
C1 |
|
Restricted |
C2 |
|
Off-credit |
D |
Morocco - ECONOMIC OVERVIEW
Morocco has capitalized on its proximity to Europe and relatively low labor costs to build a diverse, open, market-oriented economy. In the 1980s Morocco pursued austerity measures and pro-market reforms, overseen by the IMF. Since taking the throne in 1999, King MOHAMMED VI has presided over a stable economy marked by steady growth, low inflation, and generally declining government debt. Industrial development strategies and infrastructure improvements - most visibly illustrated by a new port and free trade zone near Tangier - are improving Morocco's competitiveness. Key sectors of the economy include agriculture, tourism, phosphates, textiles, apparel, and subcomponents. In 2006 Morocco entered into a bilateral Free Trade Agreement with the United States; it remains the only African country to have one. In 2008 Morocco entered into an Advanced Status agreement with the European Union. Despite Morocco's economic progress, the country suffers from high unemployment and poverty. In 2011, high food and fuel prices strained the government's budget and widened the country's current account deficit. Key economic challenges for Morocco include fighting corruption, reducing government spending, reforming the education system and judiciary, addressing socioeconomic disparities, and building more diverse, higher value-added industries.
|
Source : CIA |
Company name and details
COMARNE
Registration Briefing
Registration Number: 80843
Registration Date: 13/11/1995
Legal Form: SOCIETE A
RESPONSIBILITE LIMITEE
Latest Financials: December 31, 2012
Financial Briefing
Nominal Capital: 1,000,000 Moroccan
Dirham
Issued Capital: N/A
Turnover: 13,925,842
Moroccan Dirham
Net Profit: 30,833 Moroccan
Dirham
Net Worth: 1,778,541 Moroccan
Dirham
Original Investigation Details
Company Name: COMARNE
Country: MO
Street Name: SARL
AU CAPITAL DE 1.OOO.000DHS
City Code:
Post Code: RUE AL
BACHI
Phone Number: 212522838651/52/53
Fax Number: 212522852238
Comments: PATENTE:
32602629
MAX CR
INCLUDE FULL LINE
OF B/S ALONGWITH NAMES OF
PRODUCTS
MANUFACTURED, TRADED BY SUBJECT AS
THIS IS REQUIRED
BY CLIENT SPECIFICALLY
LATEST FINS
Company Details
Company Name: COMARNE
Headquarter Address: 81 Rue Al
Bachir Al Ibrahimi Angle Rue Blaye,
Casablanca,
Morocco
Telephone: +212522 838651
+212522 838652
+212522 838653
Fax: +212522 852238
E‑Mail: info@mixfood.org
Company was originally started on 13/11/1995
Registration & Legal Details
Current Legal Form: SOCIETE
A RESPONSIBILITE LIMITEE
Registration Address: 81
Rue Al Bachir Al Ibrahimi Angle Rue Blaye,
Casablanca
Registration Number: 80843
Registration Date: 13/11/1995
Year/Date Company Established: 13/11/1995
Registration Town: Casablanca
Tax Registration Number: 01003091
Capital
Currency: Moroccan
Dirham
Authorized Capital: 1,000,000
Paid Up Capital: 1,000,000
Previous Capital amount:
500,000
Capital to increase to:
500,000
Capital increase on 06/05/2009 to 500,000
Authorized Capital Breakdown
Number of Shares: 10,000 Type
of Shares: None Selected
Issued Shares: 10,000 Value
per share: MDH 100.00 Value
of this type: 1,000,000.00
Shareholders / Owners
Shareholders:
Name/Other Information Shares
Held % of Voting/Non‑Voting
capital
Mr. Fayçal Chaoui, 10,000 100.00% (VOTING)
Rue de Lierre,
Casablanca,
Morocco
Principals
Name: Mr
Fayçal Chaoui
Position within the company: Managing
director
Country of Birth: Morocco
Nationality: Moroccan
Can fluently speak: Arabic,
French & English
Association as Director: MIX
FOOD
Name: Mr
Abderrahim Rizaoui
Position within the company: Accountant
Country of Birth: Morocco
Nationality: Moroccan
Can fluently speak: Arabic
& French
Company Activities
NACE Codes: 4639 Non‑specialised wholesale of food,
beverages and tobacco
COMARNE is engaged in import and wholesale of dried fruits.
Subject imports 100% of products from China, Tunisia, UAE, India, Turkey
& Egypt.
Subject distributes then on a wholesale basis to the local market.
This company does not export.
Local Reporters consider the investigated company to be MEDIUM in their
field of concern.
Operations
Employees Company Employs:
15
HQ Premises Operates from: Rented Office
Location: Central Business
Area
Branches 81 Zone
Industrielle Sud Ouest,
Mohammedia,
Morocco
Description
of branch: Warehouse
Imports
Import % and type of product: 100%
Finished Goods
Imports From: China, Tunisia,
United Arab Emirates, India, Turkey,
Egypt
Importing Terms: 90 days
credit, bank transfer
Additional Information: cash
against documents
Exports
Export % and type of product: Subject
does not export
Trading & Selling
Territory: 100%
Nationally
Type of Customer: Wholesalers
& Resellers
Number of accounts: 100
Vehicles: Total
number of vehicles:
2 trucks
Related Companies
Subsidiaries
Affiliates
Information on Related Companies is not available/applicable
Bankers
Société Générale,
Branch: Forces Armées Royales
2 Avenue de l' Armée Royale,
Casablanca,
Morocco
Financial Information
Financial Interview Date: 30/04/2013
Source: Mr.
Abderrahim Rizaoui Accountant
Figures are: Official
Figures
Currency: Moroccan
Dirham
Months Sales Figures Sales Gross
Profit/Loss Net Profit/Loss
12 31/12/2012
13,925,842 100,566 30,833
12 31/12/2011 13,576,637 274,822 188,599
12 31/12/2008
14,845,405 399,552 278,725
12 31/12/2007
26,344,547 291,035 158,078
Balance Sheet & Profit & Loss
BALANCE
SHEET
As at: 31‑Dec‑2012 As at: 31‑Dec‑2011 As at: 31‑Dec‑2008
Fixed
Assets
Land & Buildings
Plant & Machinery 64,467 111,633 270,525
Furniture & Equipment 2,458 22,688 55,284
Motor Vehicles 946
Misc. Fixed Assets 12,706
Total
Fixed Assets 79,631 134,321 326,755
Financial
Assets
Shares in Related Companies
Loans to related companies
Investments
Deposits
Misc. Financial Assets 11,305 11,305 11,305
Total
Financial Assets 11,305 11,305 11,305
Intangibles
Goodwill
Organisational Expenses
Patents
Misc. Intangible Assets
Total Intangible
Assets 0 0 0
Current
Assets
Stock 30,201,934 21,695,034 11,608,973
Stock & Work in Progress
Trade Debtors & receivables 1,049,823 998,823 690,186
Provision for bad debs
Other receivables 2,069,071 1,936,558 33,555
Due from related companies
Owed by shareholders
Prepaid expenses 72,987
Cash 3,361 294,041 343,224
Tax recoverable 896,054 1,409,927 2,548,517
Marketable Securities
Misc. Current Assets 5,066 1,552
Total
Current Assets 34,225,309 26,407,370 15,226,007
Total
Assets 34,316,245 26,552,996 15,564,067
Owner's
Equity & Liabilities
Issued and paid up capital 1,000,000 1,000,000 500,000
Share premium account
Retained earnings 670,893 491,724 ‑122,668
Net profit/Loss for the year 30,833 188,599 278,725
Revaluation reserves
Legal Reserves 76,815 67,385 35,049
Other reserves
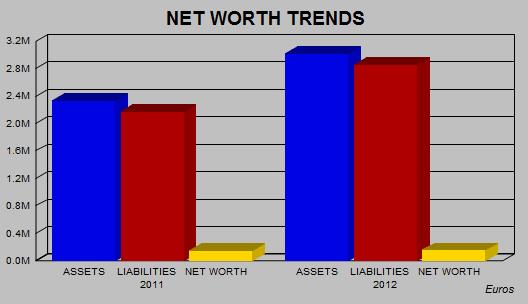
Net
Worth 1,778,541 1,747,708 691,106
Deffered Taxation
Provisions/allowances
Mortgages/Loans
Hire purchase
Due to group of companies
Minority interest
Misc. deferred liabilities
Total
Long Term Liabilities 0 0 0
Current
Liabilities
Creditors 29,948,559 22,162,780 10,808,405
Other creditors 572,408 488,365
Accruals
Bank overdrafts/Loans 1,601,752 1,094,513 1,011,749
Misc. Loans
Directors accounts
Owing to shareholders 784,428 884,428 2,333,437
Owing to related companies
Proposed dividend
Long Term‑due 1 year
Hire Purchase‑under 1 year
Taxation 189,517 86,223 227,125
Advance receipts
Misc. Current Liabilities 13,448 4,936 3,880
Total
Current Liabilities 32,537,704 24,805,288 14,872,961
Owner's Equity & Liabilities 34,316,245 26,552,996 15,564,067
PROFIT & LOSS
Figures are: Figures are: Figures are:
Fiscal Year Fiscal Year Fiscal Year
01/01/2012 to 31/12/2012
01/01/2011 to 31/12/2011 01/01/2008 to 31/12/2008
Total Income/Turnover 13,925,842 13,576,637 14,845,405
Cost of sales 11,900,880 12,299,028 13,810,563
Gross Profit/(Loss) 2,024,962 1,277,609 1,034,842
Admin/selling expenses 26,826 82,321 482
Services 1,175,353 419,569 67,758
Salaries 280,086 266,530 231,359
Auditors Fee 19,294 19,215 18,660
Stock Depreciation
Depreciation 54,691 59,573 66,469
Misc. Operating Expenses
Misc. Operating Income
Net Operating Profit/(Loss) 468,712 430,401 650,114
Interest Receivable/Finance
Income
Group related income
Misc. Financial Income 20,603 251,967 297
Total Financial Income 20,603 251,967 297
Interest Payable/Finance costs 324,631 407,545
Misc. financial expenses 64,118 1 250,859
Total Financial Expenses 388,749 407,546 250,859
Profit/(Loss) before taxes 100,566 274,822 399,552
Income Tax 69,733 86,223 120,827
Other Tax
Profit/(Loss) after taxes 30,833 188,599 278,725
Extraordinary items
Exceptional items
Misc. Items
Net Profit/(Loss) 30,833 188,599 278,725
Previous years retained earnings
Current years net income 30,833 188,599 278,725
Misc. additions in current year
Current years net loss
Dividends in current year
Withdrawals in current year
Misc. deductions in current year
Retained earnings at end of 30,833 188,599 278,725
financial period
Average employees
Directors fee
Earnings per share
Earnings per share‑previous year
Auditors Comments
Date accounts obtained: 30/04/2013
Accounts obtained from: Subject's
accountant
Auditors Opinion: The audited
financial statement gives a true and fair view of the state of affairs of the
subject
Financial Statements have been prepared on
an on‑going basis.
Assuming support of: shareholders
FINANCIAL RATIOS / COMPARATIVE DATA
Actual Company Industrial Averages Actual
Company Industrial Averages
Results (2012) (2012) Results
(2011) (2011)
Liquidity Ratios
Current
Ratio 1.05 1.46 1.06 1.54
Acid
Test Ratio 0.12 0.92 0.19 1.02
Accounts
2.15 0.42 1.63 0.37
Payable/Sales Ratio
Current
Liabilities/Net 18.29 3.79 14.19 0.61
Worth
Total
Liabilities/Net 18.29 3.80 14.19 ‑0.08
Worth
Fixed
Assets/Net 4.48 16.30 7.69 ‑27.77
Worth (%)
Profitability Ratios
Gross
Profit Ratio (%) 14.54 22.15 9.41 26.27
Return
on Capital 5.65 13.52 15.72 21.15
Employed (ROCE)(%)
Net
Profit/Sales (%) 0.72 2.99 2.02 3.65
Return
on Assets (%) 0.29 3.91 1.03 5.34
Efficiency Ratios
Sales/Working
Capital 8.25 6.02 8.47 8.39
Assets/Sales(%) 246.42 104.64 195.58 133.68
Shareholders
5.65 13.57 15.72 39.89
Return(%)
Average
Inventory 795.84 198.45 175.62
Period
Average
Collection 26.85 146.67 236.95
Period
Leverage Ratios
Capital
Employed 7.83 4.58 7.77 5.13
Number
of 308 308
Companies within the
industry (NACE G)
Statistics based on Wholesale
and retail Wholesale
and retail
NACE(G) trade;repair
of motor trade;repair
of motor
vehicles and vehicles
and
motorcycles motorcycles
The
statistical Industrial Average results are calculated against companies for the
specific country.
INDUSTRY SECTOR COMPARATIVE DATA
Elements Taken Result
for specific RANKING Total Companies Used
company
DATE
OF REGISTRATION 13/11/1995 595 1397
TOTAL
EMPLOYEES 15 561 1234
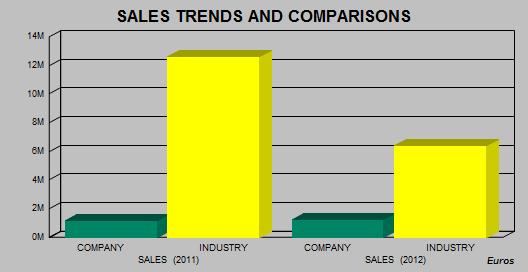
SALES
(2012) 1,224,360 21 29
SALES
(2011) 1,193,658 188 302
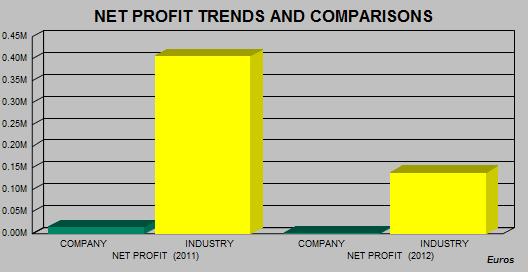
NET
PROFIT (2012) 2,711 14 15
NET
PROFIT (2011) 16,582 200 306
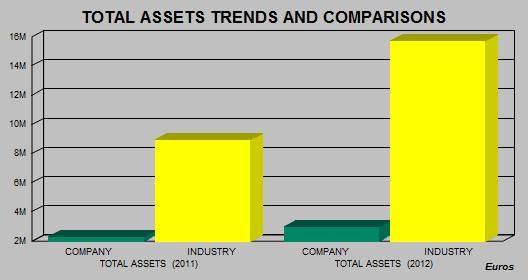
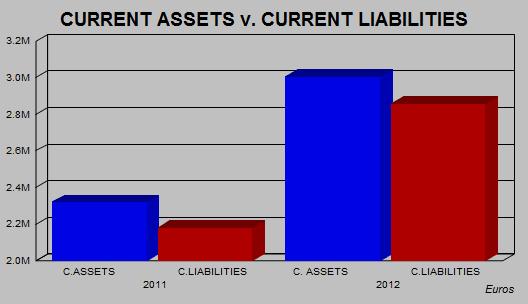
TOTAL
ASSETS (2012) 3,017,084 6 12
TOTAL
ASSETS (2011) 2,334,539 126 308
Currency: EUROS
Rankings:
The results given below are calculated against companies for the
specific country.
Scale: 1 is the highest result found in our database.
Example: Ranking 5: Total Companies used to generate the Ranking : 20
This means that this company is the 5th largest company out of 20 found
in our database in the specific industry
Charts of Financial Trends and Industry Comparisons
PLEASE NOTE THAT CHARTS ARE SHOWN IN EUROS FOR TREND AND COMPARISON
PURPOSES
The statistical Industrial Average results are calculated against
companies for the specific country.
Payments
Subject's payments reported to be: UNDETERMINED
Representation
Other Comments
Other Comments: Patent :
32602629
Interview & Reporter Comments
Date: 30/04/2013
Name/Title: Mr.
Abderrahim Rizaoui Accountant
Comment: Subject
has confirmed the general details shown in the report.
Reporter Comment Date: 02/05/2013
Reporter Comment: All
legal forms in Morocco are obliged by law to be registered with the Registry
Office (OMPIC : Office
Marocain De La Propriete Industrielle Et Commerciale) which is publicly
available.
Subject was found registered and Information obtained from above
official source is as follows :
Registered name / registration
number / date of registration /
registered address / legal form / capital / main principals – administrators /
shareholders / shareholders%.
According to the Morocco Commercial Law, all legal forms except for
proprietorship entities are obliged to file their financial accounts to the
OMPIC.
Any other data stated in the report was obtained directly from the
subject company and/or other publicly available information. Therefore it
should be used as a point of reference as it is not possible to verify such
data with official sources.
Conclusions
Local Reputation: The company
being investigated is considered by local reporters to be a Fair / Normal Trade
Risk.
Owner/Shareholders
Comments: All or most of the
owners / shareholders have an active participation in the running of the
business.
Financial Results
Trend: Financial
Information indicates that the business activities of the company are declining
in strength.
Age of Business: The
company is long established in the local market.
FOREIGN EXCHANGE RATES
|
Currency |
Unit
|
Indian Rupees |
|
US Dollar |
1 |
Rs.53.95 |
|
|
1 |
Rs.84.03 |
|
Euro |
1 |
Rs.70.72 |
INFORMATION DETAILS
|
Report Prepared
by : |
SDA |
RATING EXPLANATIONS
|
RATING |
STATUS |
PROPOSED CREDIT LINE |
|
|
>86 |
Aaa |
Possesses an extremely sound financial base with the strongest
capability for timely payment of interest and principal sums |
Unlimited |
|
71-85 |
Aa |
Possesses adequate working capital. No caution needed for credit
transaction. It has above average (strong) capability for payment of interest
and principal sums |
Large |
|
56-70 |
A |
Financial & operational base are regarded healthy. General
unfavourable factors will not cause fatal effect. Satisfactory capability for
payment of interest and principal sums |
Fairly Large |
|
41-55 |
Ba |
Overall operation is considered normal. Capable to meet normal
commitments. |
Satisfactory |
|
26-40 |
B |
Capability to overcome financial difficulties seems comparatively
below average. |
Small |
|
11-25 |
Ca |
Adverse factors are apparent. Repayment of interest and principal sums
in default or expected to be in default upon maturity |
Limited with
full security |
|
<10 |
C |
Absolute credit risk exists. Caution needed to be exercised |
Credit not
recommended |
|
---- |
NB |
New Business |
---- |
This score serves as a reference to assess
SC’s credit risk and to set the amount of credit to be extended. It is
calculated from a composite of weighted scores obtained from each of the major
sections of this report. The assessed factors and their relative weights (as
indicated through %) are as follows:
Financial
condition (40%) Ownership
background (20%) Payment
record (10%)
Credit history
(10%) Market trend (10%) Operational size
(10%)
This report is issued at your request without any risk
and responsibility on the part of MIRA INFORM PRIVATE LIMITED (MIPL) or its
officials.