MIRA INFORM REPORT
|
Report Date : |
29.05.2013 |
IDENTIFICATION DETAILS
|
Name : |
KEN AS |
|
|
|
|
Registered Office : |
Bogebjergvej 60, 5672 Broby
Denmark |
|
|
|
|
Country : |
Denmark |
|
|
|
|
Financials (as on) : |
2012 |
|
|
|
|
Date of Incorporation : |
26.09.1987 |
|
|
|
|
Com. Reg. No.: |
10676096 |
|
|
|
|
Legal Form : |
Limited Company |
|
|
|
|
Line of Business : |
Manufacturer of other general-purpose machinery |
|
|
|
|
No. of Employees : |
226 |
RATING & COMMENTS
|
MIRA’s Rating : |
Ba |
|
RATING |
STATUS |
PROPOSED CREDIT LINE |
|
|
41-55 |
Ba |
Overall operation is considered normal. Capable to meet normal
commitments. |
Satisfactory |
|
Status : |
Satisfactory |
|
|
|
|
Payment Behaviour : |
No Complaints |
|
|
|
|
Litigation : |
Clear |
NOTES:
Any query related to this report can be made
on e-mail: infodept@mirainform.com
while quoting report number, name and date.
ECGC Country Risk Classification List – March 31st 2013
|
Country Name |
Previous Rating (31.12.2012) |
Current Rating (31.03.2013) |
|
Denmark |
A2 |
A2 |
|
Risk Category |
ECGC
Classification |
|
Insignificant |
A1 |
|
Low |
A2 |
|
Moderate |
B1 |
|
High |
B2 |
|
Very High |
C1 |
|
Restricted |
C2 |
|
Off-credit |
D |
denmark ECONOMIC OVERVIEW
This thoroughly modern market economy features a high-tech agricultural
sector, state-of-the-art industry with world-leading firms in pharmaceuticals,
maritime shipping and renewable energy, and a high dependence on foreign trade.
Denmark is a member of the European Union (EU); Danish legislation and
regulations conform to EU standards on almost all issues. Danes enjoy a high
standard of living and the Danish economy is characterized by extensive
government welfare measures and an equitable distribution of income. Denmark is
a net exporter of food and energy and enjoys a comfortable balance of payments
surplus but depends on imports of raw materials for the manufacturing sector.
Within the EU, Denmark is among the strongest supporters of trade
liberalization. After a long consumption-driven upswing, Denmark's economy
began slowing in 2007 with the end of a housing boom. Housing prices dropped
markedly in 2008-09 and, following a short respite in 2010, has since continued
to decline. The global financial crisis has exacerbated this cyclical slowdown
through increased borrowing costs and lower export demand, consumer confidence,
and investment. The global financial crisis cut Danish real GDP in 2008-09.
Denmark made a modest recovery in 2010 with real GDP growth of 1.3%, in part
because of increased government spending; however, the country experienced a
technical recession in late 2010-early 2011. Historically low levels of
unemployment rose sharply with the recession and have remained at about 6% in
2010-12, based on the national measure, about two-thirds average EU
unemployment. An impending decline in the ratio of workers to retirees will be
a major long-term issue. Denmark maintained a healthy budget surplus for many
years up to 2008, but the budget balance swung into deficit in 2009. In spite
of the deficits, the new coalition government delivered a modest stimulus to
the economy in 2012. Nonetheless, Denmark's fiscal position remains among the
strongest in the EU with public debt at about 45% of GDP in 2012. Despite
previously meeting the criteria to join the European Economic and Monetary
Union (EMU), so far Denmark has decided not to join, although the Danish krone
remains pegged to the euro. Denmark held the EU presidency during the first
half of 2012; priorities included promoting a responsible, dynamic, green, and
safe Europe, while working to steer Europe out of its euro zone economic
crisis.
|
Source : CIA |
summary
Company name KEN A/S
Operative address BOGEBJERGVEJ 60
5672 BROBY Denmark
Status Active
Legal form Limited
company - A/S
Registration number Trade register number: 10676096
Trade
register number: 10676096
VAT-number DK10
67 60 96
|
Year |
2012 |
Mutation |
2011 |
Mutation |
2010 |
|
Fixed
assets |
5.798.096 |
-8, 02 |
6. 303. 603 |
-5,92 |
6. 700. 181 |
|
Total
receivables |
7.461.128 |
8,47 |
6.878.450 |
6,05 |
6.486.273 |
|
Total
equity |
12.145.607 |
7,87 |
11.259.059 |
12,61 |
9. 997. 898 |
|
Short term
liabilities |
7. 226.951 |
10, 65 |
6.531.155 |
-2, 58 |
6. 704. 060 |
|
Net result |
969.374 |
-25,80 |
1.306.446 |
21, 77 |
1.072.885 |
|
Working
capital |
10.566.728 |
15,71 |
9.131.845 |
27,44 |
7.165. 856 |
|
Quick
ratio |
1,41 |
6,82 |
1,32 |
18,92 |
1,11 |
Contact information
Company name KEN
A/S
Operative address BOGEBJERGVEJ
60
5672 BROBY
Denmark
Correspondence address BOGEBJERGVEJ 60
5672 BROBY
Denmark
Telephone number +45 62631091
Fax number +45 62631607
Email address ken@ken.dk
Website www.ken.dk
Registration
Registration number Trade register number: 10676096
Trade register number: 10676096
VAT-number DK10
67 60 96
Status Active
Establishment date 1987-09-26
Legal form Limited
company - A/S
Subscribed share capital DKK 5.000.000
activities
NACE Manufacture
of other general-purpose machinery n.e.c. (2829)
Relations
Shareholders ULTIMATE
GLOBAL SHAREHOLDER
Name: FABRIKANT KAJ E. NIELSEN
OG GUDRUN E. NIELSENS FOND
National id number: 74311628
Address: Bøgebjergvej 60
Zipcode: 5672
City: BROBY
Country: DK
Phone: +45 70102092
Type: Mutual & Guest-house
Fund/Nominee/Trust/Trustee
Share direct: 100.00%
Share TOTAL: 100.00%
TOTAL assets : 23.58 mil. EUR
Profit loss before tax: 1.5051
mil. EUR
Profit loss after tax net
income: 1.5051 mil. EUR
Shareholders funds: 23.4209
mil. EUR
SHAREHOLDERS
Name: FABRIKANT KAJ E. NIELSEN
OG GUDRUN E. NIELSENS FOND
National id number: 74311628
Address: Bøgebjergvej 60
Zipcode: 5672
City: BROBY
Country: DK
Phone: +45 70102092
Type: Mutual & Guest-house
Fund/Nominee/Trust/Trustee
Share direct: 100.00%
TOTAL assets : 23.58 mil. EUR
Profit loss before tax: 1.5051
mil. EUR
Profit loss after tax net
income: 1.5051 mil. EUR
Shareholders funds: 23.4209
mil. EUR
Number of employees: 0
Structure SUBSIDIARIES
Name: EJENDOMMEN KASTANIEVEJ
18 APS
National id number: 30804929
Address: Gærupvej 20
Zipcode: 5600
City: FAABORG
Country: DK
Type: Industrial company
Phone: Array
Share direct: 100.00%
Total assets : 0.13 mil. EUR
Profit loss before tax: 0.006
mil. EUR
Profit loss after tax net
income: 0.0046 mil. EUR
Shareholders
funds: 0.0307 mil. EUR
Name: KEN NORGE AS
National id number: 924 869
860
Address: Verkseier Furulunds
Vei 21
Zipcode: 0668
City: OSLO
Country: NO
Type: Industrial company
Phone: Array
Fax: +47 22302642
W ebsite: www.ken-nimo.no
Share direct: 100.00%
Turnover: 4.17 mil. EUR
Total assets : 1.79 mil. EUR
Profit loss before tax: 0.0784
mil. EUR
Profit loss after tax net
income: 0.0552 mil. EUR
Shareholders funds: 1.0564
mil. EUR
Number of employees: 10
Name: KEN SLOVAK S.R.O.
Country: SK
Type: Industrial company
Share direct: 100.00%
Name: KEN STORKØKKEN A/S
National id number: 20218428
Address: Runetoften 15
Zipcode: 8210
City: AARHUS V
Country: DK
Type: Industrial company
Fax: +45 86248300
W ebsite:
www.kenstorkoekken.dk
Share direct: 56.00%
Turnover: 24.54 mil. EUR
Total assets : 12.34 mil. EUR
Profit loss before tax: 0.4231
mil. EUR
Profit loss after tax net
income: 0.3135 mil. EUR
Shareholders funds: 4.1741
mil. EUR
Number of employees: 45
Branches Name:
KAJ E NIELSEN (KEN) MASKINFABRIK A/S EKSPORT
National id number:
10676096-E14
Address: Bøgebjergvej 60
Zipcode: 5672
City: BROBY
Country: DK
Name: KEN A/S, LAGER LILLE
SKENSVED
National id number:
10676096-A90
Address: Hjørnegårdsvej 7
Zipcode: 4623
City: LILLE SKENSVED
Country: DK
Name: MONTØR BJARKE TØNNING
STEPHANSEN
National id number:
10676096-D63
Address: Alperne 4
Zipcode: 7870
City: ROSLEV
Country: DK
Bank details
Bank details
Accounts Danske
Bank
Sydbank
Management
Management Fullname:
Mr. Mogens Karby Nielsen
Type: Individual
Gender: Male
date of birth: 1938/06/01
Age: 75
Address: Denmark
Number of involvements: 6
Function: Chairman
Level of responsibility:
President / Chairman
Fullname: Mr. PETER Eriksen
Jensen
Type: Individual
Gender: Male
Country of nationality:
Denmark
Address: Denmark
Number of involvements: 21
Function: Member of the board
Level of responsibility:
Member
Appointment date: 2007/01/17
Fullname: Mrs. Birgit Karby
Schmidt
Type: Individual
Gender: Female
Address: Denmark
Number of involvements: 3
Function:
Member of the board
Level of responsibility:
Member
Fullname: Mr. Jesper Torp
Type: Individual
Gender: Male
Address: Denmark
Number of involvements: 1
Function: Member of the board
Level of responsibility: Member
Appointment date: 2011/09/02
Fullname: Mr. Per Juul Nielsen
Type: Individual
Gender: Male
date of birth: 1963/07/01
Age: 49
Address: Denmark
Number of involvements: 4
Function: Managing Director
Level of responsibility:
Highest executive
Appointment date: 2009/01/06
Employees
|
Year |
2012 |
2011 |
2010 |
2009 |
2008 |
|
Total |
226 |
233 |
222 |
234 |
256 |
Financial analysis
Trend Constant
Profitability Sufficient
Solvability Sufficient
Liquidity Positive
Show amount in Euro
Key figures
|
Year |
2012 |
2011 |
2010 |
2009 |
2008 |
||||
|
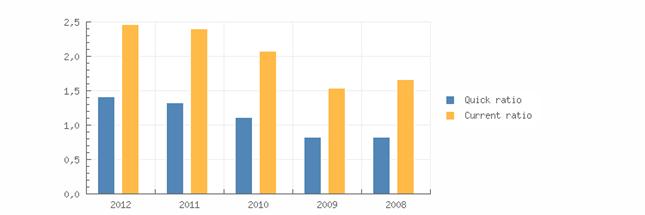
Quick ratio |
1,41 |
1,32 |
1,11 |
0,83 |
0,82 |
||||
|
Current ratio |
2,46 |
2,40 |
2,07 |
1,54 |
1,66 |
||||
|
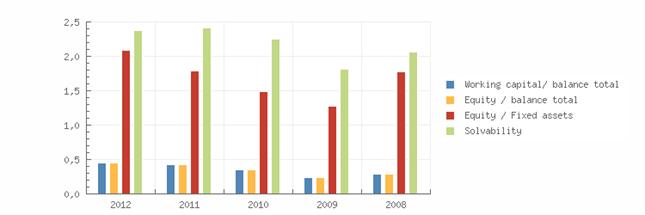
W orking capital/ balance
total |
0,45 |
0,42 |
0,35 |
0,24 |
0,29 |
||||
|
Equity / balance total |
0,45 |
0,42 |
0,35 |
0,24 |
0,29 |
||||
|
Equity / Fixed assets |
2,09 |
1,79 |
1,49 |
1,28 |
1,77 |
||||
|
Solvability |
2,38 |
2,41 |
2,25 |
1,81 |
2,06 |
||||
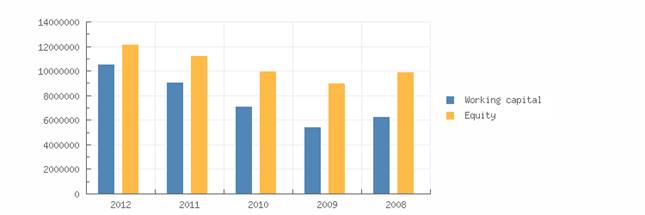
|
W orking capital |
10.566.728 |
9.131.845 |
7.165.856 |
5.456.388 |
6.267.628 |
||||
|
Equity |
12.145.607 |
11.259.059 |
9.997.898 |
9.049.675 |
9.959.537 |
||||
|
Mutation equity |
7,87 |
12,61 |
10,48 |
-9,14 |
|
||||
|
Mutation short term liabilities |
10,65 |
-2,58 |
-33,36 |
5,72 |
|
||||
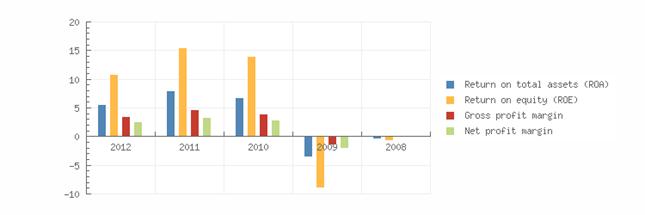
|
Return on total assets (ROA) |
5,61 |
7,95 |
6,81 |
-3,61 |
-0,33 |
||||
|
Return on equity (ROE) |
10,91 |
15,52 |
14,01 |
-9,01 |
-0,71 |
||||
|
Gross profit margin |
3,56 |
4,77 |
3,89 |
-1,40 |
-0,14 |
||||
|
Net profit margin |
2,56 |
3,41 |
2,97 |
-2,07 |
-0,15 |
||||
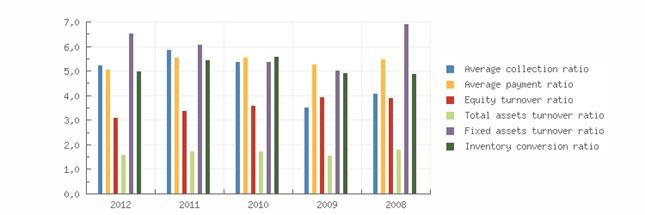
|
Average collection ratio |
5,24 |
5,87 |
5,38 |
3,54 |
4,11 |
||||
|
Average payment ratio |
5,07 |
5,57 |
5,56 |
5,30 |
5,50 |
||||
|
Equity turnover ratio |
3,12 |
3,40 |
3,61 |
3,94 |
3,93 |
||||
|
Total assets turnover ratio |
1,60 |
1,74 |
1,75 |
1,58 |
1,83 |
||||
|
Fixed assets turnover ratio |
6,53 |
6,08 |
5,38 |
5,03 |
6,94 |
||||
|
Inventory conversion ratio |
4,99 |
5,46 |
5,61 |
4,95 |
4,90 |
||||
|
Turnover |
37.837.714 |
38.314.672 |
36.078.237 |
35.641.530 |
39.105.904 |
||||
|
Gross margin |
9.041.755 |
9.397.746 |
8.716.590 |
6.184.336 |
7.414.909 |
||||
|
Operating result |
1.347.525 |
1.828.595 |
1.401.975 |
-498.904 |
-55.213 |
||||
|
Net result after taxes |
969.374 |
1.306.446 |
1.072.885 |
-738.420 |
-57.759 |
||||
|
Cashflow |
1.817.358 |
2.236.767 |
2.056.542 |
138.152 |
761.459 |
||||
|
EBITDA |
2.195.509 |
2.758.916 |
2.385.631 |
377.668 |
764.005 |
||||
Summary
The 2012 financial result structure is a postive working
captial of 10.566.728 euro,
which is in agreement with 45 % of the total assets of the
company.
The working capital has increased with 15.71 % compared to
previous year. The ratio,
with respect to the total assets of the company has
however, increased.
The improvement between 2011 and 2012 has mainly been
caused by an increase of
the current assets.
The current ratio of the company in 2012 was 2.46. A
company with a current ratio
between 1.5 and 3.0 generally indicates good short-term
financial strengt h.
The quick ratio in 2012 of the company was 1.41. A company
with a Quick Ratio of
more than 1 can currently pay back its current
liabilities.
The 2011 financial result structure is a postive working
captial of 9.131.845 euro, which
is in agreement with 42 % of the total assets of the
company.
The working capital has increased with 27.44 % compared to
previous year. The ratio,
with respect to the total assets of the company has
however, increased.
The improvement between 2010 and 2011 has mainly been
caused by an increase of
the current assets.
The current ratio of the company in 2011 was 2.4. A
company with a current ratio
between 1.5 and 3.0 generally indicates good short-term
financial strength.
The quick ratio in 2011 of the company was 1.32. A company
Financial statement
Auditor Name: BDO
Statsautoriseret Revisionsaktieselskab
Last annual account 2012
Remark annual account The company is
obliged to file its financial
statements.
Type of annual account Consolidated
Annual account KEN A/S
BOGEBJERGVEJ 60
5672 BROBY Denmark
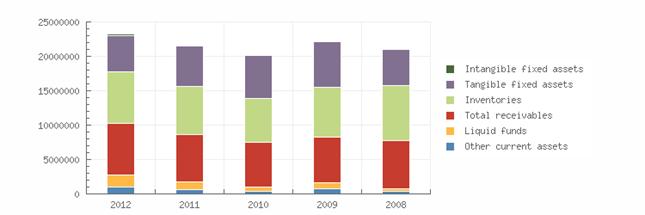
Balance sheet
|
Year |
2012 |
2011 |
2010 |
2009 |
2008 |
|
End Date |
1970-01-01 |
1970-01-01 |
1970-01-01 |
1970-01-01 |
1970-01-01 |
|
Intangible fixed assets |
243.587 |
192.957 |
155.047 |
137.883 |
125.972 |
|
tangible fixed
assets |
5.252.310 |
5.795.802 |
6.232.499 |
6.633.162 |
5.266.555 |
|
Other fixed assets |
302.198 |
314.845 |
312.635 |
313.627 |
241.624 |
|
Fixed assets |
5.798.096 |
6.303.603 |
6.700.181 |
7.084.672 |
5.634.151 |
|
Inventories |
7.584.535 |
7.021.391 |
6.428.482 |
7.206.444 |
7.977.493 |
|
Total receivables |
7.461.128 |
6.878.450 |
6.486.273 |
6.723.517 |
7.111.906 |
|
Liquid funds |
1.797.597 |
1.162.432 |
540.456 |
880.063 |
289.735 |
|
Other current assets |
950.419 |
600.726 |
414.706 |
706.467 |
404.316 |
|
Current assets |
17.793.679 |
15.663.000 |
13.869.916 |
15.516.491 |
15.783.450 |
|
Total assets |
23.591.774 |
21.966.603 |
20.570.097 |
22.601.163 |
21.417.601 |
|
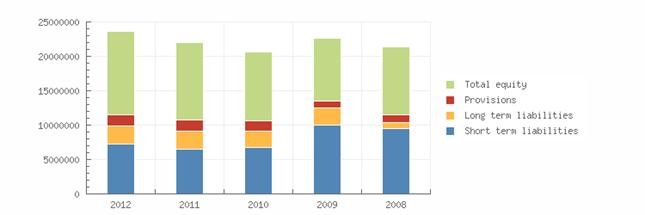
Total equity |
12.145.607 |
11.259.059 |
9.997.898 |
9.049.675 |
9.959.537 |
|
Provisions |
1.546.616 |
1.577.845 |
1.411.339 |
1.058.358 |
1.051.328 |
|
Long term liabilities |
2.672.466 |
2.598.409 |
2.456.666 |
2.433.162 |
890.781 |
|
Accounts payable |
2.881.639 |
2.780.639 |
2.262.557 |
1.975.610 |
2.890.380 |
|
Short term liabilities |
7.226.951 |
6.531.155 |
6.704.060 |
10.060.103 |
9.515.822 |
|
Total liabilities |
23.591.774 |
21.966.603 |
20.570.097 |
22.601.163 |
21.417.601 |
Summary
The total assets of the
company increased with 7.4 % between
2011 and 2012.![]() Despite the assets growth, the
non current assets decreased with -8.02 %.
Despite the assets growth, the
non current assets decreased with -8.02 %.
In 2012 the assets of the
company were 2359177400 % composed of
fixed assets and -2359177300 % by
current assets. The assets are
being financed by an equity of
2359177400 %, and total debt of -2359177300 %.
The total assets of the
company increased with 6.79 % between
2010 and 2011. Despite the assets growth, the non current assets
decreased with -5.92 %.
In 2011 the assets of the
company were 2196660300 % composed of
fixed assets and
-2196660200 % by current assets. The assets are
being financed by an equity of
2196660300 %, and total debt of -2196660200
%
Profit & loss
|
Year |
2012 |
2011 |
2010 |
2009 |
2008 |
|
Net Turnover |
37.837.714 |
38.314.672 |
36.078.237 |
35.641.530 |
39.105.904 |
|
Cost of sales |
28.795.959 |
28.916.926 |
27.361.648 |
29.457.194 |
31.690.995 |
|
Gross margin |
9.041.755 |
9.397.746 |
8.716.590 |
6.184.336 |
7.414.909 |
|
W ages and salaries |
13.501.332 |
13.300.187 |
12.459.514 |
12.728.754 |
13.211.483 |
|
Amorization and depreciation |
847.984 |
930.321 |
983.656 |
876.572 |
819.218 |
|
Operating expenses |
7.694.229 |
7.569.151 |
7.314.615 |
6.683.240 |
7.470.122 |
|
Operating result |
1.347.525 |
1.828.595 |
1.401.975 |
-498.904 |
-55.213 |
|
Financial income |
222.213 |
284.138 |
328.019 |
264.623 |
289.065 |
|
Financial expenses |
245.066 |
365.531 |
329.625 |
581.338 |
304.476 |
|
Financial result |
-22.853 |
-81.393 |
-1.605 |
-316.715 |
-15.411 |
|
Result on ordinary operations before taxes |
1.324.672 |
1.747.202 |
1.400.369 |
-815.619 |
-70.625 |
|
Taxation on the result of ordinary
activities |
355.298 |
440.756 |
327.484 |
-77.198 |
-12.865 |
|
Result on ordinary operations
after taxes |
969.374 |
1.306.446 |
1.072.885 |
-738.420 |
-57.759 |
|
Net results |
969.374 |
1.306.446 |
1.072.885 |
-738.420 |
-57.759 |
Summary
The turnover of the company decreased by -1.24 % between 2011 and 2012.
The gross profit
of the company decreased by -3.79
% between 2011 and 2012.
The operating result of the company declined with -26.31 % between 2011 and 2012. This
evolution implies an decrease of
the company's economic profitability.
The result of these changes is a reduction of the company's Economic Profitability
of -
29.43 % of the analysed period, being equal to 2011 % in the year 2012.
This fall has
contributed to a asset
turnover decrease, whose index
evolved from -8.05 to a level of
1.6.
The Net Result of the company increased by -25.8 % between 2011 and 2012.
The company's Financial
Profitability has been negatively affected by the financial
activities in comparison to the
EBITs behaviour. The result of
these variations is a profitability
reduction of -29.7 % of the analysed period, being 10.91
% in the year 2012.
The company's financial
profitability has been
positively affected by its financial structure.
The turnover of the company grew with 6.2 % between 2010 and 2011.
The gross profit
of the company grew with 7.81 %
between 2010 and 2011.
The operating result of the company grew with 30.43 % between 2010 and 2011.
This evolution implies an
increase of the company's economic
profitability.
The result of these changes is an increase of the company's Economic Profitability
of 16.74 % of the analysed
period, being equal to 2010 % in the
year 2011. Despite the growth the asset
turnover remained the same at
1.74.
The Net Result of the company decreased by 21.77 % between 2010 and 2011. The company's Financial Profitability has
been positively affected by the financial activities in comparison to the EBITs behaviour.
The result of these variations is a
profitability increase of 10.78 % of the analysed period, being 15.52
% in the year 2011. The company's financial structure has
slowed down its financial
profitability.
Publications
Remarks
Status: Active
Category: Large company
Last year: 2012
Turnover last year: 37.837.714 EUR Result last
year: 969.374 EUR
TOTAL assets last year:
23.591.775 EUR Number of
employees: 226
Number of shareholders: 1
Number of subsidiaries: 4
Number of branches: 3
FOREIGN EXCHANGE RATES
|
Currency |
Unit
|
Indian Rupees |
|
US Dollar |
1 |
Rs.55.74 |
|
UK Pound |
1 |
Rs.84.17 |
|
Euro |
1 |
Rs.72.03 |
INFORMATION DETAILS
|
Report Prepared
by : |
MNL |
RATING EXPLANATIONS
|
RATING |
STATUS |
PROPOSED CREDIT LINE |
|
|
>86 |
Aaa |
Possesses an extremely sound financial base with the strongest capability
for timely payment of interest and principal sums |
Unlimited |
|
71-85 |
Aa |
Possesses adequate working capital. No caution needed for credit
transaction. It has above average (strong) capability for payment of interest
and principal sums |
Large |
|
56-70 |
A |
Financial & operational base are regarded healthy. General
unfavourable factors will not cause fatal effect. Satisfactory capability for
payment of interest and principal sums |
Fairly Large |
|
41-55 |
Ba |
Overall operation is considered normal. Capable to meet normal
commitments. |
Satisfactory |
|
26-40 |
B |
Capability to overcome financial difficulties seems comparatively
below average. |
Small |
|
11-25 |
Ca |
Adverse factors are apparent. Repayment of interest and principal sums
in default or expected to be in default upon maturity |
Limited with
full security |
|
<10 |
C |
Absolute credit risk exists. Caution needed to be exercised |
Credit not
recommended |
|
---- |
NB |
New Business |
---- |
This score serves as a reference to assess
SC’s credit risk and to set the amount of credit to be extended. It is
calculated from a composite of weighted scores obtained from each of the major
sections of this report. The assessed factors and their relative weights (as
indicated through %) are as follows:
Financial
condition (40%) Ownership
background (20%) Payment
record (10%)
Credit history
(10%) Market trend (10%) Operational size
(10%)
This report is issued at your request without any
risk and responsibility on the part of MIRA INFORM PRIVATE LIMITED (MIPL)
or its officials.