MIRA INFORM REPORT
|
Report Date : |
09.11.2013 |
IDENTIFICATION DETAILS
|
Name : |
NAPOLEON ARMENGOL SL |
|
|
|
|
Registered Office : |
Calle Pintor Joan Miro 12 ( Pol. Can Humet Dalt ), Parc. - 14 -
Polinya - 08213 - |
|
|
|
|
Country : |
|
|
|
|
|
Financials (as on) : |
2012 |
|
|
|
|
Date of Incorporation : |
01.06.1989 |
|
|
|
|
Legal Form : |
Private Limited Company |
|
|
|
|
Line of Business : |
The subject is an old family company which is engaged in manufacturing
and sale of products for the protection and security of conducting elements
in electric installation, such as tubes and steely pipes. |
|
|
|
|
No. of Employees : |
5 |
RATING & COMMENTS
|
MIRA’s Rating : |
B |
|
RATING |
STATUS |
PROPOSED CREDIT LINE |
|
|
26-40 |
B |
Capability to overcome financial difficulties seems comparatively
below average. |
Small |
|
Status : |
Moderate |
|
|
|
|
Payment Behaviour : |
Slow |
|
|
|
|
Litigation : |
Clear |
NOTES:
Any query related to this report can be made on
e-mail: infodept@mirainform.com
while quoting report number, name and date.
ECGC Country Risk Classification List – March, 31st, 2013
|
Country Name |
Previous Rating (31.12.2012) |
Current Rating (31.03.2013) |
|
Spain |
A2 |
A2 |
|
Risk Category |
ECGC
Classification |
|
Insignificant |
A1 |
|
Low |
A2 |
|
Moderate |
B1 |
|
High |
B2 |
|
Very High |
C1 |
|
Restricted |
C2 |
|
Off-credit |
D |
spain - ECONOMIC OVERVIEW
After almost 15 years of above average GDP growth, the
Spanish economy began to slow in late 2007 and entered into a recession in the
second quarter of 2008. GDP contracted by 3.7% in 2009, ending a 16-year growth
trend, and by another 0.3% in 2010; GDP expanded 0.4% in 2011, before
contracting 1.4% in 2012. The economy has once again fallen into recession as
deleveraging in the private sector, fiscal consolidation, and continued high
unemployment weigh on domestic demand and investment, even as exports have
shown signs of resiliency. The unemployment rate rose from a low of about 8% in
2007 to 26.0% in 2012. The economic downturn has also hurt Spain's public
finances. The government budget deficit peaked at 11.2% of GDP in 2010 and the
process to reduce this imbalance has been slow despite the central government's
efforts to raise new tax revenue and cut spending. Spain reduced its budget
deficit to 9.4% of GDP in 2011, and roughly 7.4% of GDP in 2012, above the 6.3%
target negotiated between Spain and the EU. Although Spain''s large budget
deficit and poor economic growth prospects remain a source of concern for
foreign investors, the government''s ongoing efforts to cut spending and
introduce flexibility into the labor markets are intended to assuage these concerns.
The government is also taking steps to shore up the banking system, namely by
using up to $130 billion in EU funds to recapitalize struggling banks exposed
to the collapsed domestic construction and real estate sectors.
|
Source
: CIA |
EXECUTIVE SUMMARY
|
Name: |
NAPOLEON ARMENGOL SL |
|
NIF / Fiscal code: |
B58838228 |
|
Trade Name |
NAPOLEON ARMENGOL |
|
Status: |
ACTIVE |
|
Incorporation Date: |
01/06/1989 |
|
Register Data |
Register Section 8 Sheet 103401 |
|
Last Publication
in BORME: |
25/06/2013 [Take-over Merger] |
|
Last Published Account Deposit: |
2012 |
|
Share Capital: |
120.805,02 |
|
|
|
|
Localization: |
CALLE PINTOR JOAN MIRO 12 ( POL. CAN HUMET DALT ), PARC. - 14 -
POLINYA - 08213 - BARCELONA |
|
Telephone - Fax - Email - Website: |
Ph.:. 937149238/937132444 Email.
armengol@napoleon-armengol.com Website. www.napoleon-armengol.com |
|
|
|
|
Activity: |
|
|
NACE: |
4612 - Agents involved in the sale of fuels, ores, metals and industrial
chemicals |
|
Registered Trademarks: |
|
|
Audited / Opinion: |
Si / |
|
Tenders and Awards: |
0 for a total cost of 0 |
|
Subsidies: |
1 for a total cost of 4240.98 |
|
Quality Certificate: |
No |
|
|
|
|
Defaults, Legal Claims
and Insolvency Proceedings : |
|
|
|
|
|
|
|
Number |
Amount (€) |
Most Recent
Entry |
|
Insolvency Proceedings, Bankruptcy and Suspension of Payments |
|
Unpublished |
--- |
--- |
|
Defaults on debt with Financial Institutions and Large Companies |
|
None |
--- |
--- |
|
Judicial Claims (Notices, Executive Proceedings, Attachments,
Auctions, Bad Debt) |
|
None |
0 |
--- |
|
Proceedings heard by the Civil Court |
|
Unpublished |
0 |
--- |
|
Proceedings heard by the Labour Court |
|
Unpublished |
0 |
--- |
Partners
|
INAGRUP CINC ASSOCIATS SL |
99 % |
|
|
Shares: |
0 |
|
|
Other Links: |
4 |
|
|
No. of Active Corporate Bodies: |
SINGLE ADMINISTRATOR 1 |
|
|
Ratios |
2012 |
2011 |
Change |
|
|
|
|
|
Guarantees: |
|
|
Properties Registered: |
Company NO, Administrator NO |
|
Financing / Guarantee Sources : |
Sources NO, Guarantees NO |
INVESTIGATION SUMMARY
|
The commercial entity NAPOLEON ARMENGOL SL with VAT number B58838228
was founded in Barcelona in June, 1989 and it is engaged in wholesale of
machinery and equipment, mainly of electrical installations. According to the
sources consulted and after the analysis of the data we have and economic
information for the year 2012, we estimate in general that its structure is
favourable. |
Identification
|
Social
Denomination: |
NAPOLEON ARMENGOL SL |
|
Trade Name: |
NAPOLEON ARMENGOL |
|
NIF / Fiscal
code: |
B58838228 |
|
Corporate
Status: |
ACTIVE |
|
Start of
activity: |
1990 |
|
Registered
Office: |
CALLE PINTOR JOAN MIRO 12 ( POL. CAN HUMET DALT ), PARC. - 14 |
|
Locality: |
POLINYA |
|
Province: |
BARCELONA |
|
Postal Code: |
08213 |
|
Telephone: |
937149238/937132444 |
|
Fax: |
937132058 |
|
Website: |
www.napoleon-armengol.com |
|
Email: |
armengol@napoleon-armengol.com |
Activity
|
NACE: |
4612 |
|
CNAE Obtaining
Source: |
4612 |
|
Additional
Information: |
The subject is an old family company which is engaged in manufacturing
and sale of products for the protection and security of conducting elements
in electric installation, such as tubes and steely pipes. |
|
Additional
Address: |
Offices and other premises are situated in its registered office,
located in calle Pintor Joan Miró 12, parcel 14 of the Polígono Industrial
Can Humet, in the town of Polinya, 08213, in Barcelona, owned by the subject. |
|
Franchise: |
No |
|
Import / export: |
DOES NOT IMPORT / EXPORT |
|
Future
Perspective: |
Product / service improvement |
|
Industry
situation: |
Maturity |
Number of Employees
|
Year |
No. of employees |
Established |
Incidentals |
|
2013 |
5 |
|
|
Chronological Summary
|
|
|
|
|
Year |
Act |
|
|
1990 |
Accounts deposit (ejer. 1989) |
|
|
1991 |
Accounts deposit (ejer. 1990) |
|
|
1992 |
Accounts deposit (ejer. 1991) Appointments/ Re-elections (1) |
|
|
1993 |
Accounts deposit (ejer. 1992) Adaptation to Law (1) Increase of
Capital (1) Statutory Modifications (1) |
|
|
1995 |
Accounts deposit (ejer. 1993, 1994) Appointments/ Re-elections (1) |
|
|
1996 |
Accounts deposit (ejer. 1995) |
|
|
1997 |
Accounts deposit (ejer. 1996) |
|
|
1998 |
Accounts deposit (ejer. 1997) Appointments/ Re-elections (3)
Cessations/ Resignations/ Reversals (1) Dividends Payment (1) Other Concepts/
Events (1) Statutory Modifications (1) |
|
|
1999 |
Accounts deposit (ejer. 1998) |
|
|
2000 |
Accounts deposit (ejer. 1999) |
|
|
2001 |
Accounts deposit (ejer. 2000) |
|
|
2003 |
Accounts deposit (ejer. 2001, 2002) Appointments/ Re-elections (1) |
|
|
2004 |
Accounts deposit (ejer. 2003) |
|
|
2006 |
Accounts deposit (ejer. 2004) |
|
|
2007 |
Accounts deposit (ejer. 2005) Appointments/ Re-elections (3)
Cessations/ Resignations/ Reversals (1) |
|
|
2008 |
Accounts deposit (ejer. 2006, 2007) |
|
|
2009 |
Accounts deposit (ejer. 2008) |
|
|
2010 |
Accounts deposit (ejer. 2009) |
|
|
2011 |
Accounts deposit (ejer. 2010) |
|
|
2012 |
Accounts deposit (ejer. 2011) Appointments/ Re-elections (2) Cessations/
Resignations/ Reversals (2) Company Transformation (2) |
|
|
2013 |
Accounts deposit (ejer. 2012) Increase of Capital (1) Statutory
Modifications (1) Take-over Merger (2) |
|
Breakdown of Owners' Equity
|
Registered
Capital: |
120.805,02 |
|
Paid up capital: |
120.805,02 |
Updated Evolution of the Subscribed and Paid-in Capital
|
|
|
Publishing Date |
Registration
Type |
Capital
Subscribed |
Paid up capital |
Underwritten
result |
Disbursed Result |
|
09/12/1993 |
Increase of Capital |
48.081 |
3.005 |
60.101 |
15.025 |
|
01/04/1998 |
Capital call payment |
--- |
45.076 |
60.101 |
60.101 |
|
17/06/2013 |
Increase of Capital |
60.703 |
60.703 |
120.805 |
120.805 |
Active Social Bodies
|
Post published |
Social Body's
Name |
Appointment Date |
Other Positions
in this Company |
|
SINGLE ADMINISTRATOR |
ARMENGOL ASPARO SALVADOR |
27/12/2012 |
6 |
|
PROXY |
ARMENGOL ASPARO MARIA CARME |
01/04/1998 |
3 |
|
|
ARMENGOL ASPARO SALVADOR |
07/07/1992 |
6 |
|
RESERVE ADMINISTRATOR |
ARMENGOL ASPARO MARIA CARMEN |
27/12/2012 |
3 |
|
ACCOUNTS' AUDITOR / HOLDER |
AUDITORIA OPERATIVA BARCINO SL |
26/04/2007 |
1 |
Historical Social Bodies
|
Social Body's Name |
Post published |
End Date |
Other Positions in this Company |
|
ARMENGOL ARBAT
SALVADOR |
ADMINISTRATOR |
01/04/1998 |
1 |
|
ARMENGOL ASPARO
MARIA CARME |
RESERVE
ADMINISTRATOR |
24/07/2007 |
3 |
|
|
RESERVE
ADMINISTRATOR |
21/08/2012 |
|
|
ARMENGOL ASPARO
MARIA CARMEN |
RESERVE
ADMINISTRATOR |
13/03/2003 |
3 |
|
|
RESERVE
ADMINISTRATOR |
27/12/2012 |
|
|
ARMENGOL ASPARO
ROSA MARIA |
PROXY |
05/02/2007 |
1 |
|
ARMENGOL ASPARO
SALVADOR |
SINGLE
ADMINISTRATOR |
24/07/2007 |
6 |
|
|
SINGLE
ADMINISTRATOR |
21/08/2012 |
|
|
|
SINGLE
ADMINISTRATOR |
27/12/2012 |
|
|
|
ADMINISTRATOR |
13/03/2003 |
|
|
FERRER SALA JOSEP |
PROXY |
29/11/2012 |
1 |
Executive board
|
Post |
NIF |
Name |
|
ADMINISTRATOR |
|
MARIA CARMEN
ARMENGOL ASPARO |
|
ADMINISTRATOR |
|
SALVADOR ARMENGOL
ASPARO |
|
DIRECTOR/GENERAL
MANAGER |
|
SALVADOR ARMENGOL
ASPARO |
Defaults, Legal Claims and Insolvency Proceedings
Section enabling
assessment of the degree of compliance of the company queried with its payment
obligations. It provides information on the existence and nature of all stages
of Insolvency and Legal Proceedings published with reference to the Company in
the country's various Official Bulletins and national newspapers, as well
Defaults Registered in the main national credit bureaus (ASNEF Industrial and
RAI ).
> Summary
Chronological
summary
|
|
|
Number of Publications |
Amount (_) |
Start date |
End date |
|
Insolvency
Proceedings, Bankruptcy and Suspension of Payments |
|
Unpublished |
--- |
--- |
--- |
|
Request/Declaration |
|
0 |
--- |
date |
|
|
Proceedings |
|
--- |
--- |
|
--- |
|
Resolution |
|
--- |
--- |
|
--- |
|
Defaults on debt
with Financial Institutions and Large Companies |
Bank and
Commercial Delinquency |
None |
0 |
|
|
|
Status: Friendly |
|
--- |
|
|
|
|
Status:
Pre-Litigation |
|
--- |
|
|
|
|
Status:
Litigation |
|
--- |
|
|
|
|
Status:
Non-performing |
|
--- |
|
|
|
|
Status:
insolvency proceedings, bankruptcy and suspension of payments |
|
--- |
|
|
|
|
Other status |
|
--- |
|
|
|
|
Legal and
Administrative Proceedings |
|
Unpublished |
--- |
|
|
|
Notices of
defaults and enforcement |
|
--- |
--- |
|
--- |
|
Seizures |
|
--- |
--- |
|
--- |
|
Auctions |
|
--- |
--- |
|
--- |
|
Declarations of
insolvency and bad debt |
|
--- |
--- |
|
--- |
|
Proceedings heard
by the Civil Court |
|
Unpublished |
--- |
|
|
|
Proceedings heard
by the Labour Court |
|
Unpublished |
--- |
|
|
Probability of default
> Probabilidad
Estimada de Impago para los próximos 12 meses: 4.2 %
|
Sector in which
comparison is carried out : 461 Wholesale
on a fee or contract basis |
|
|
Relative
Position:
|
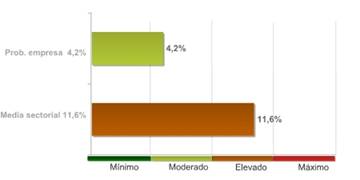
The company's comparative analysis with the rest of the companies that comprise the sector, shows the company holds a better position with regard to the probability of non-compliance.
The 72.00% of the companies of the sector NAPOLEON ARMENGOL SL belongs to show a higher probability of non-compliance.
The probability of the company's non-compliance with its payment obligations within deadlines estimated by our qualifications models is 4.17%.
In the event they fail to comply with the payment, the seriousness of the loss will depend on factors such as the promptness of the commencement of the charging management, the existence of executive documents which match the credit or the existence of guarantees and free debt assets under the name of the debtor. Therefore, the probability of non-compliance should not be solely interpreted as the total loss of the owed amount.
LEGAL CLAIMS
Summary of Judicial Claims
|
|
|
|
|
|
|
|
||
|
|
|
No se han
publicado |
|
|
|
|
No se han
publicado |
|
|
INCIDENCES WITH THE PUBLIC ADMINISTRATIONS |
|
||
|
|
|
No se han
publicado |
|
|
|
|
No se han
publicado |
|
|
|
|
No se han
publicado |
|
|
|
|
No se han
publicado |
|
|
|
|
||
|
|
|
No se han
publicado |
|
|
|
|
No se han
publicado |
|
|
|
|
||
|
|
|
No se han
publicado |
|
Guarantees
References
Clients
|
|
Name |
NIF |
Telephone |
|
|
|
REPRESENTACIONES
MANUEL ZAPATA, S.L. |
B91048298 |
954409000 |
|
|
|
RELECTRO GR, S.L. |
B18351437 |
958468815 |
|
|
|
TEC
REPRESENTACIONES, S.L. |
B15453509 |
981231486 |
|
|
|
REPRESENTACIONES
ELECTRICAS |
B53879680 |
965429302 |
|
|
|
COMATEL SL |
B03875762 |
965114808 |
|
|
|
VIELCO
ELECTRICITAT COMERCIAL, S.A. |
A08967218 |
938143500 |
|
|
|
MATA APARELLATJE
ELECTRICS SL |
B17431875 |
972581214 |
|
Link List
|
ABSORBS TO: |
1 Entities |
|
IS RELATED
WITH: |
3 Entities |
|
SHAREHOLDERS: |
1 Entities |
> Shareholders
|
Relationship |
Entity |
Province |
Shareholding stake |
|
SHAREHOLDERS |
INAGRUP CINC
ASSOCIATS SL |
BARCELONA |
99 |
> Other
relationships
|
Relationship |
Entity |
Province |
Shareholding stake |
|
IS RELATED WITH |
GALVANICAS ARME
SL |
BARCELONA |
|
|
|
INAGESTIO ASSOCIATS
SL |
BARCELONA |
|
|
IS RELATED WITH |
GALVANICAS ARME
SL |
BARCELONA |
|
|
ABSORBS TO |
GALVANICAS ARME
SL |
BARCELONA |
|
Turnover
|
Total Sales 2012 |
2.596.856,67 |
Financial Accounts and Balance Sheets
Financial Years Presented
|
Ejercicio |
Tipo de Cuentas Anuales |
Fecha Presentacion |
|
2012 |
Normales |
August 2013 |
|
2011 |
Normales |
October
2012 |
|
2010 |
Normales |
September
2011 |
|
2009 |
Normales |
October
2010 |
|
2008 |
Normales |
September
2009 |
|
2007 |
Normales |
September
2008 |
|
2006 |
Normales |
November
2007 |
|
2005 |
Normales |
November
2006 |
|
2004 |
Normales |
December
2005 |
|
2003 |
Normales |
September
2004 |
|
2002 |
Normales |
September
2003 |
|
2001 |
Normales |
March 2003 |
|
2000 |
Normales |
September
2001 |
|
1999 |
Normales |
September
2000 |
|
1998 |
Normales |
August 1999 |
|
1997 |
Normales |
August 1998 |
|
1996 |
Normales |
August 1997 |
|
1995 |
Normales |
October
1996 |
|
1994 |
Normales |
July 1995 |
|
1993 |
Normales |
April 1995 |
|
1992 |
Normales |
July 1993 |
|
1991 |
Normales |
July 1992 |
|
1990 |
Normales |
August 1991 |
|
1989 |
Normales |
August 1990 |
The data in the report regarding the last Company Accounts submitted by the company is taken from the TRADE REGISTER serving the region in which the company's address is located 31/12/2012
> Balance en formato Pyme de acuerdo al Nuevo Plan General Contable 2007
Information corresponding to the fiscal year 2012 2011 2010 2009 2008 is taken from information submitted to the TRADE REGISTER. Data corresponding to fiscal years before 2012 2011 2010 2009 2008 has been compiled based on the equivalence criteria stipulated in Act JUS/206/2009. Where the provisions of the Act did not establish relevant equivalence criteria, axesor created such criteria using its own methodology. To view details on the methodology.
|
|
ORIGINAL |
ORIGINAL |
ORIGINAL |
ORIGINAL |
ORIGINAL |
|
|
Assets |
2012 |
2011 |
2010 |
2009 |
2008 |
|
|
A) NON-CURRENT
ASSETS: 11000 |
150.736,00 |
135.291,00 |
107.452,00 |
90.088,00 |
99.430,00 |
|
|
I. Intangible fixed assets : 11100 |
17.524,00 |
23.044,00 |
10.454,00 |
7.745,00 |
2.463,00 |
|
|
II. Tangible fixed assets : 11200 |
71.878,00 |
61.014,00 |
66.645,00 |
71.016,00 |
85.641,00 |
|
|
III. Real estate investment: 11300 |
0,00 |
0,00 |
0,00 |
0,00 |
0,00 |
|
|
IV. Long-term investments in Group companies and associates :
11400 |
0,00 |
0,00 |
0,00 |
0,00 |
0,00 |
|
|
V. Long-term financial investments: 11500 |
10.703,00 |
10.703,00 |
10.703,00 |
10.703,00 |
10.703,00 |
|
|
VI. Assets for deferred tax : 11600 |
50.631,00 |
40.531,00 |
19.651,00 |
624,00 |
624,00 |
|
|
VII. Non-current trade debtors : 11700 |
0,00 |
0,00 |
0,00 |
0,00 |
0,00 |
|
|
B) CURRENT
ASSETS: 12000 |
2.656.404,00 |
2.739.757,00 |
2.898.291,00 |
2.835.970,00 |
2.999.283,00 |
|
|
I. Stocks : 12200 |
499.960,00 |
438.532,00 |
337.207,00 |
499.152,00 |
482.678,00 |
|
|
II. Trade debtors and others receivable accounts : 12300 |
856.273,00 |
793.775,00 |
1.172.945,00 |
1.127.556,00 |
1.368.927,00 |
|
|
1. Trade debtors / accounts receivable:
12380 |
583.396,00 |
659.721,00 |
1.121.191,00 |
991.400,00 |
1.368.927,00 |
|
|
a) Long-term receivables
from sales and services supplied : 12381 |
0,00 |
0,00 |
0,00 |
0,00 |
0,00 |
|
|
b) Customers for sales and
provisions of services : 12382 |
583.396,00 |
659.721,00 |
1.121.191,00 |
991.400,00 |
1.368.927,00 |
|
|
2. Called up share capital: 12370 |
0,00 |
0,00 |
0,00 |
0,00 |
0,00 |
|
|
3. Other accounts receivable : 12390 |
272.877,00 |
134.054,00 |
51.754,00 |
136.156,00 |
0,00 |
|
|
III. Short-term investment in Group companies and associates:
12400 |
0,00 |
0,00 |
0,00 |
0,00 |
0,00 |
|
|
IV. Short-term financial investments : 12500 |
913.812,00 |
1.019.635,00 |
1.015.003,00 |
650.000,00 |
0,00 |
|
|
V. Short-term accruals : 12600 |
0,00 |
713,00 |
523,00 |
608,00 |
731,00 |
|
|
VI. Cash and other equivalent liquid assets : 12700 |
386.359,00 |
487.103,00 |
372.613,00 |
558.654,00 |
1.146.947,00 |
|
|
TOTAL ASSETS (A +
B) : 10000 |
2.807.140,00 |
2.875.048,00 |
3.005.743,00 |
2.926.058,00 |
3.098.714,00 |
|
|
|
ORIGINAL |
ORIGINAL |
ORIGINAL |
ORIGINAL |
ORIGINAL |
|
|
Liabilities and Net Worth |
2012 |
2011 |
2010 |
2009 |
2008 |
|
|
A) NET WORTH:
20000 |
2.341.705,00 |
2.372.029,00 |
2.439.650,00 |
2.496.029,00 |
2.447.758,00 |
|
|
A-1)
Shareholders' equity: 21000 |
2.341.705,00 |
2.372.029,00 |
2.439.650,00 |
2.496.029,00 |
2.447.758,00 |
|
|
I. Capital: 21100 |
60.102,00 |
60.102,00 |
60.102,00 |
60.102,00 |
60.102,00 |
|
|
1. Registered capital : 21110 |
60.102,00 |
60.102,00 |
60.102,00 |
60.102,00 |
60.102,00 |
|
|
2. (Uncalled capital): 21120 |
0,00 |
0,00 |
0,00 |
0,00 |
0,00 |
|
|
II. Share premium: 21200 |
0,00 |
0,00 |
0,00 |
0,00 |
0,00 |
|
|
III. Reserves: 21300 |
2.435.927,00 |
2.435.927,00 |
2.435.927,00 |
2.387.656,00 |
2.139.176,00 |
|
|
IV. (Common stock equity): 21400 |
0,00 |
0,00 |
0,00 |
0,00 |
0,00 |
|
|
V. Profit or loss brought forward: 21500 |
-124.000,00 |
-56.379,00 |
0,00 |
0,00 |
0,00 |
|
|
VI. Other shareholders' contributions: 21600 |
0,00 |
0,00 |
0,00 |
0,00 |
0,00 |
|
|
VII. Result of the period: 21700 |
-30.324,00 |
-67.622,00 |
-56.379,00 |
48.271,00 |
248.480,00 |
|
|
VIII. (Interim dividend): 21800 |
0,00 |
0,00 |
0,00 |
0,00 |
0,00 |
|
|
A-2) Changes in net
worth : 22000 |
0,00 |
0,00 |
0,00 |
0,00 |
0,00 |
|
|
A-3) Received
subsidies, donations and legacies: 23000 |
0,00 |
0,00 |
0,00 |
0,00 |
0,00 |
|
|
B) NON-CURRENT
LIABILITIES: 31000 |
2.222,00 |
8.887,00 |
0,00 |
0,00 |
0,00 |
|
|
I. Long-term provisions: 31100 |
0,00 |
0,00 |
0,00 |
0,00 |
0,00 |
|
|
II. Long-term creditors : 31200 |
2.222,00 |
8.887,00 |
0,00 |
0,00 |
0,00 |
|
|
1. Amounts owed to credit institutions:
31220 |
2.222,00 |
8.887,00 |
0,00 |
0,00 |
0,00 |
|
|
2. Creditors from financial leasing : 31230 |
0,00 |
0,00 |
0,00 |
0,00 |
0,00 |
|
|
3. Other long-term creditors : 31290 |
0,00 |
0,00 |
0,00 |
0,00 |
0,00 |
|
|
III. Long-term debts with Group companies and associates: 31300 |
0,00 |
0,00 |
0,00 |
0,00 |
0,00 |
|
|
IV. Liabilities for deferred tax: 31400 |
0,00 |
0,00 |
0,00 |
0,00 |
0,00 |
|
|
V. Long-term accruals: 31500 |
0,00 |
0,00 |
0,00 |
0,00 |
0,00 |
|
|
VI. Non-current trade creditors : 31600 |
0,00 |
0,00 |
0,00 |
0,00 |
0,00 |
|
|
VII. Special long-term debts : 31700 |
0,00 |
0,00 |
0,00 |
0,00 |
0,00 |
|
|
C) CURRENT
LIABILITIES : 32000 |
463.213,00 |
494.132,00 |
566.092,00 |
430.029,00 |
650.956,00 |
|
|
I. Short-term provisions: 32200 |
21.226,00 |
16.511,00 |
16.561,00 |
3.458,00 |
0,00 |
|
|
II. Short-term creditors : 32300 |
7.236,00 |
7.572,00 |
1.162,00 |
2.887,00 |
1.960,00 |
|
|
1. Amounts owed to credit institutions:
32320 |
7.236,00 |
7.572,00 |
1.162,00 |
2.887,00 |
1.460,00 |
|
|
2. Creditors from financial leasing : 32330 |
0,00 |
0,00 |
0,00 |
0,00 |
0,00 |
|
|
3. Other short-term creditors : 32390 |
0,00 |
0,00 |
0,00 |
0,00 |
500,00 |
|
|
III. Short-term amounts owed to group and associated companies:
32400 |
0,00 |
0,00 |
0,00 |
0,00 |
0,00 |
|
|
IV. Trade creditors and other accounts payable: 32500 |
434.751,00 |
470.049,00 |
548.369,00 |
423.684,00 |
648.996,00 |
|
|
1. Suppliers: 32580 |
311.177,00 |
325.400,00 |
309.826,00 |
213.430,00 |
348.468,00 |
|
|
a) Long-term debts :
32581 |
0,00 |
0,00 |
0,00 |
0,00 |
0,00 |
|
|
b) Short-term debts :
32582 |
311.177,00 |
325.400,00 |
309.826,00 |
213.430,00 |
348.468,00 |
|
|
2. Other creditors: 32590 |
123.575,00 |
144.649,00 |
238.543,00 |
210.253,00 |
300.528,00 |
|
|
V. Short-term accruals : 32600 |
0,00 |
0,00 |
0,00 |
0,00 |
0,00 |
|
|
VI. Special short-term debts : 32700 |
0,00 |
0,00 |
0,00 |
0,00 |
0,00 |
|
|
TOTAL NET WORTH AND
LIABILITIES (A + B + C) : 30000 |
2.807.140,00 |
2.875.048,00 |
3.005.743,00 |
2.926.058,00 |
3.098.714,00 |
|
|
|
ORIGINAL |
ORIGINAL |
ORIGINAL |
ORIGINAL |
ORIGINAL |
|
|
Profit and Loss |
2012 |
2011 |
2010 |
2009 |
2008 |
|
|
1. Net turnover: 40100 |
2.596.857,00 |
2.502.860,00 |
3.191.208,00 |
3.026.708,00 |
5.205.207,00 |
|
|
2. Changes in stocks of finished goods and work in progress:
40200 |
62.157,00 |
99.325,00 |
9.654,00 |
-3.824,00 |
0,00 |
|
|
3. Works carried out by the company for its assets: 40300 |
0,00 |
0,00 |
0,00 |
2.250,00 |
0,00 |
|
|
4. Supplies : 40400 |
-2.062.654,00 |
-1.986.284,00 |
-2.441.840,00 |
-2.136.816,00 |
-3.596.451,00 |
|
|
5. Other operating income: 40500 |
5.750,00 |
4.645,00 |
4.241,00 |
3.009,00 |
1.857,00 |
|
|
6. Personnel costs: 40600 |
-231.438,00 |
-243.029,00 |
-237.940,00 |
-246.961,00 |
-242.540,00 |
|
|
7. Other operating costs: 40700 |
-472.268,00 |
-498.500,00 |
-597.812,00 |
-561.681,00 |
-999.544,00 |
|
|
8. Amortisation of fixed assets: 40800 |
-26.574,00 |
-26.357,00 |
-21.026,00 |
-24.463,00 |
-34.935,00 |
|
|
9. Allocation of subsidies of non-financial fixed assets and other:
40900 |
0,00 |
0,00 |
0,00 |
0,00 |
0,00 |
|
|
10. Excess provisions : 41000 |
0,00 |
0,00 |
0,00 |
0,00 |
0,00 |
|
|
11. Impairment and result of transfers of fixed assets: 41100 |
50.401,00 |
0,00 |
-86,00 |
0,00 |
0,00 |
|
|
12. Other results : 41300 |
2.906,00 |
20.627,00 |
-1.793,00 |
4.026,00 |
-1.485,00 |
|
|
A) OPERATING INCOME
(1 + 2 + 3 + 4 + 5 + 6 + 7 + 8 + 9 + 10 + 11 + 12) : 49100 |
-74.864,00 |
-126.712,00 |
-95.396,00 |
62.249,00 |
332.110,00 |
|
|
13. Financial income : 41400 |
34.695,00 |
38.455,00 |
20.868,00 |
5.913,00 |
21.642,00 |
|
|
a) Allocation of financial subsidies, donations
and legacies: 41430 |
0,00 |
0,00 |
0,00 |
0,00 |
0,00 |
|
|
b) Other financial income: 41490 |
34.695,00 |
38.455,00 |
20.868,00 |
5.913,00 |
21.642,00 |
|
|
14. Financial expenditure : 41500 |
-255,00 |
-245,00 |
0,00 |
0,00 |
0,00 |
|
|
15. Changes in fair value of financial instruments : 41600 |
0,00 |
0,00 |
0,00 |
0,00 |
0,00 |
|
|
16. Exchange rate differences: 41700 |
0,00 |
0,00 |
0,00 |
0,00 |
0,00 |
|
|
17. Impairment and result for transfers of financial instruments :
41800 |
0,00 |
0,00 |
-877,00 |
0,00 |
0,00 |
|
|
18. Other financial income and expenditure: 42100 |
0,00 |
0,00 |
0,00 |
0,00 |
0,00 |
|
|
a) Incorporation of financial expenditure to
assets: 42110 |
0,00 |
0,00 |
0,00 |
0,00 |
0,00 |
|
|
b) Financial income from arrangement with
creditors: 42120 |
0,00 |
0,00 |
0,00 |
0,00 |
0,00 |
|
|
c) Other income and expenditure: 42130 |
0,00 |
0,00 |
0,00 |
0,00 |
0,00 |
|
|
B) FINANCIAL
REVENUE ( 13 + 14 + 15 + 16 + 17 +18 ) : 49200 |
34.440,00 |
38.210,00 |
19.991,00 |
5.913,00 |
21.642,00 |
|
|
C) NET RESULT BEFORE
TAXES ( A + B ) : 49300 |
-40.424,00 |
-88.502,00 |
-75.406,00 |
68.162,00 |
353.752,00 |
|
|
19. Income taxes : 41900 |
10.100,00 |
20.880,00 |
19.027,00 |
-19.891,00 |
-105.272,00 |
|
|
D) RESULT OF THE PERIOD
( C + 19 ) : 49500 |
-30.324,00 |
-67.622,00 |
-56.379,00 |
48.271,00 |
248.480,00 |
|
> Normal Balance
Sheet under the rules of the 1990 General Accounting Plan (repealed since 1st
January of 2008)
Information corresponding to the fiscal year 2012 2011 2010 2009 2008 has been compiled based on the equivalence criteria stipulated in Act JUS/206/2009. Where the provisions of the Act did not establish relevant equivalence criteria, Axesor created such criteria using its own methodology. To view details on the methodology 2012 2011 2010 2009 2008 is taken from information submitted to the TRADE REGISTER.
|
|
EQUIVALENCIA |
EQUIVALENCIA |
EQUIVALENCIA |
EQUIVALENCIA |
EQUIVALENCIA |
|
|
ASSETS |
2012 |
2011 |
2010 |
2009 |
2008 |
|
|
A) SHAREHOLDERS
(PARTNERS) BY UNCALLED SUSCRIBED CAPITAL: |
0,00 |
0,00 |
0,00 |
0,00 |
0,00 |
|
|
B) FIXED ASSETS:
|
100.105,00 |
94.760,00 |
87.801,00 |
89.464,00 |
98.807,00 |
|
|
I. Formation expenses: |
0,00 |
0,00 |
0,00 |
0,00 |
0,00 |
|
|
II. Intangible fixed assets: |
17.524,00 |
23.044,00 |
10.454,00 |
7.745,00 |
2.463,00 |
|
|
III. Tangible fixed assets: |
71.878,00 |
61.014,00 |
66.645,00 |
71.016,00 |
85.641,00 |
|
|
IV. Financial investments: |
10.703,00 |
10.703,00 |
10.703,00 |
10.703,00 |
10.703,00 |
|
|
V. Own shares: |
0,00 |
0,00 |
0,00 |
0,00 |
0,00 |
|
|
VI. Long-term trade receivables: |
0,00 |
0,00 |
0,00 |
0,00 |
0,00 |
|
|
C) Deferred
expenses: |
0,00 |
0,00 |
0,00 |
0,00 |
0,00 |
|
|
D) CURRENT
ASSETS: |
2.707.035,00 |
2.780.288,00 |
2.917.942,00 |
2.836.594,00 |
2.999.907,00 |
|
|
I. Called-up share capital (not paid): |
0,00 |
0,00 |
0,00 |
0,00 |
0,00 |
|
|
II. Stocks: |
499.960,00 |
438.532,00 |
337.207,00 |
499.152,00 |
482.678,00 |
|
|
III. Debtors: |
906.904,00 |
834.306,00 |
1.192.596,00 |
1.128.180,00 |
1.369.551,00 |
|
|
IV. Short-term investments: |
913.812,00 |
1.019.635,00 |
1.015.003,00 |
650.000,00 |
0,00 |
|
|
V. Short-term treasury shares: |
0,00 |
0,00 |
0,00 |
0,00 |
0,00 |
|
|
VI. Cash at bank and in hand: |
386.359,00 |
487.103,00 |
372.613,00 |
558.654,00 |
1.146.947,00 |
|
|
VII. Prepayments and accrued income: |
0,00 |
713,00 |
523,00 |
608,00 |
731,00 |
|
|
GENERAL TOTAL (A
+ B + C + D): |
2.807.140,00 |
2.875.048,00 |
3.005.743,00 |
2.926.058,00 |
3.098.714,00 |
|
MERCANTILE REGISTRY.
|
|
EQUIVALENCIA |
EQUIVALENCIA |
EQUIVALENCIA |
EQUIVALENCIA |
EQUIVALENCIA |
|
|
LIABILITIES |
2012 |
2011 |
2010 |
2009 |
2008 |
|
|
A) EQUITY: |
2.341.705,00 |
2.372.029,00 |
2.439.650,00 |
2.496.029,00 |
2.447.758,00 |
|
|
I. Subscribed capital: |
60.102,00 |
60.102,00 |
60.102,00 |
60.102,00 |
60.102,00 |
|
|
II. Share premium: |
0,00 |
0,00 |
0,00 |
0,00 |
0,00 |
|
|
III. Revaluation reserves: |
0,00 |
0,00 |
0,00 |
0,00 |
0,00 |
|
|
IV. Reserves: |
2.435.927,00 |
2.435.927,00 |
2.435.927,00 |
2.387.656,00 |
2.139.176,00 |
|
|
a) Differences for capital adjustment to euros:
|
0,00 |
0,00 |
0,00 |
0,00 |
0,00 |
|
|
b) Remaining Reserves: |
2.435.927,00 |
2.435.927,00 |
2.435.927,00 |
2.387.656,00 |
2.139.176,00 |
|
|
V. Profit or loss brought forward: |
-124.000,00 |
-56.379,00 |
0,00 |
0,00 |
0,00 |
|
|
VI. Profit or loss for the financial year: |
-30.324,00 |
-67.622,00 |
-56.379,00 |
48.271,00 |
248.480,00 |
|
|
VII. Interim dividend paid: |
0,00 |
0,00 |
0,00 |
0,00 |
0,00 |
|
|
VIII. Own shares for capital reduction: |
0,00 |
0,00 |
0,00 |
0,00 |
0,00 |
|
|
B) Deferred
income: |
0,00 |
0,00 |
0,00 |
0,00 |
0,00 |
|
|
C) PROVISIONS FOR
LIABILITIES AND CHARGES: |
0,00 |
0,00 |
0,00 |
0,00 |
0,00 |
|
|
D) LONG TERM
LIABILITIES: |
2.222,00 |
8.887,00 |
0,00 |
0,00 |
0,00 |
|
|
E) SHORT TERM
CREDITORS: |
441.987,00 |
477.621,00 |
549.531,00 |
426.571,00 |
650.956,00 |
|
|
F) SHORT-TERM
PROVISIONS FOR LIABILITIES AND CHARGES: |
21.226,00 |
16.511,00 |
16.561,00 |
3.458,00 |
0,00 |
|
|
GENERAL TOTAL (A
+ B + C + D + E + F): |
2.807.140,00 |
2.875.048,00 |
3.005.743,00 |
2.926.058,00 |
3.098.714,00 |
|
MERCANTILE REGISTRY.
|
|
EQUIVALENCIA |
EQUIVALENCIA |
EQUIVALENCIA |
EQUIVALENCIA |
EQUIVALENCIA |
|
|
DEBIT |
2012 |
2011 |
2010 |
2009 |
2008 |
|
|
A) CHARGES (A.1
to A.15): |
2.720.932,00 |
2.634.210,00 |
3.272.695,00 |
2.993.636,00 |
4.980.227,00 |
|
|
A.1. Operating consumption: |
2.000.498,00 |
1.886.959,00 |
2.432.187,00 |
2.140.640,00 |
3.596.451,00 |
|
|
A.2. Staff Costs: |
231.438,00 |
243.029,00 |
237.940,00 |
246.961,00 |
242.540,00 |
|
|
a) Wages, salaries et al.:
|
181.263,00 |
190.342,00 |
186.356,00 |
193.422,00 |
189.958,00 |
|
|
b) Social security costs:
|
50.174,00 |
52.687,00 |
51.584,00 |
53.540,00 |
52.581,00 |
|
|
A.3. Depreciation expense: |
26.574,00 |
26.357,00 |
21.026,00 |
24.463,00 |
34.935,00 |
|
|
A.4. Variation of trade provisions and losses of
unrecovered receivables: |
0,00 |
0,00 |
0,00 |
0,00 |
0,00 |
|
|
A.5. Other operating charges: |
472.268,00 |
498.500,00 |
597.812,00 |
561.681,00 |
999.544,00 |
|
|
A.I. OPERATING BENEFITS (B.1-A.1-A.2-A.3-A.4-A.5): |
0,00 |
0,00 |
0,00 |
58.222,00 |
333.595,00 |
|
|
A.6. Financial and similar charges: |
255,00 |
245,00 |
877,00 |
0,00 |
0,00 |
|
|
a) Due to liabilities with
companies of the group: |
0,00 |
0,00 |
0,00 |
0,00 |
0,00 |
|
|
b) Due to liabilities with
associated companies: |
0,00 |
0,00 |
0,00 |
0,00 |
0,00 |
|
|
c) Due to other debts:
|
255,00 |
245,00 |
0,00 |
0,00 |
0,00 |
|
|
d) Losses from financial
investments: |
0,00 |
0,00 |
877,00 |
0,00 |
0,00 |
|
|
A.7. Financial investment provision change:
|
0,00 |
0,00 |
0,00 |
0,00 |
0,00 |
|
|
A.8. Exchange losses: |
0,00 |
0,00 |
0,00 |
0,00 |
0,00 |
|
|
A.II. POSITIVE FINANCIAL RESULTS (B.2+B.3-A.6-A.7-A.8): |
34.440,00 |
38.210,00 |
19.991,00 |
5.913,00 |
21.642,00 |
|
|
A.III. PROFIT FROM ORDINARY ACTIVITIES (A.I+A.II-B.I-B.II): |
0,00 |
0,00 |
0,00 |
64.136,00 |
355.237,00 |
|
|
A.9. Changes in provisions for intangible,
tangible and securities portfolio: |
0,00 |
0,00 |
0,00 |
0,00 |
0,00 |
|
|
A.10. Losses from tangible and intangible fixed
assets and portfolio: |
0,00 |
0,00 |
86,00 |
0,00 |
0,00 |
|
|
A.11. Losses from transactions with own shares
and debentures: |
0,00 |
0,00 |
0,00 |
0,00 |
0,00 |
|
|
A.12. Extraordinary expenses: |
0,00 |
0,00 |
1.793,00 |
0,00 |
1.485,00 |
|
|
A.13. Prior year expenses and losses: |
0,00 |
0,00 |
0,00 |
0,00 |
0,00 |
|
|
A.IV. EXTRAORDINARY PROFIT
(B.4+B.5+B.6+B.7+B.8-A.9-A.10-A.11-A.12-A.13): |
53.307,00 |
20.627,00 |
0,00 |
4.026,00 |
0,00 |
|
|
A.V. PROFIT BEFORE TAXES (A.III+A.IV-B.III-B.IV): |
0,00 |
0,00 |
0,00 |
68.162,00 |
353.752,00 |
|
|
A.14. Corporation Tax: |
-10.100,00 |
-20.880,00 |
-19.027,00 |
19.891,00 |
105.272,00 |
|
|
A.15. Miscellaneous taxes: |
0,00 |
0,00 |
0,00 |
0,00 |
0,00 |
|
|
A.VI. FINANCIAL YEAR RESULT (PROFIT) (A.V-A.14-A.15): |
0,00 |
0,00 |
0,00 |
48.271,00 |
248.480,00 |
|
MERCANTILE REGISTRY.
|
|
EQUIVALENCIA |
EQUIVALENCIA |
EQUIVALENCIA |
EQUIVALENCIA |
EQUIVALENCIA |
|
|
CREDIT |
2012 |
2011 |
2010 |
2009 |
2008 |
|
|
B) INCOME ( B.1
to B.8): |
2.690.608,00 |
2.566.588,00 |
3.216.316,00 |
3.041.907,00 |
5.228.707,00 |
|
|
B.1. Operating income: |
2.602.607,00 |
2.507.505,00 |
3.195.449,00 |
3.031.968,00 |
5.207.064,00 |
|
|
a) Net total sales: |
2.596.857,00 |
2.502.860,00 |
3.191.208,00 |
3.026.708,00 |
5.205.207,00 |
|
|
b) Miscellaneous operating
income: |
5.750,00 |
4.645,00 |
4.241,00 |
5.259,00 |
1.857,00 |
|
|
B.I. PÉRDIDAS DE EXPLOTACIÓN (A.1+A.2+A.3+A.4+A.5-B.1 ): |
128.171,00 |
147.339,00 |
93.517,00 |
0,00 |
0,00 |
|
|
B.2. Financial income: |
34.695,00 |
38.455,00 |
20.868,00 |
5.913,00 |
21.642,00 |
|
|
a) Companies of the group:
|
0,00 |
0,00 |
0,00 |
0,00 |
0,00 |
|
|
b) In associated companies:
|
0,00 |
0,00 |
0,00 |
0,00 |
0,00 |
|
|
c) Miscellaneous: |
34.695,00 |
38.455,00 |
20.868,00 |
5.913,00 |
21.642,00 |
|
|
d) Profit on financial
investment: |
0,00 |
0,00 |
0,00 |
0,00 |
0,00 |
|
|
B.3. Exchange gains: |
0,00 |
0,00 |
0,00 |
0,00 |
0,00 |
|
|
B.II. NEGATIVE FINANCIAL RESULTS (A.6+A.7+A.8-B.2-B.3): |
0,00 |
0,00 |
0,00 |
0,00 |
0,00 |
|
|
B.III. LOSSES ON ORDINARY ACTIVITIES ( B.I + B.II - A.I - A.II ):
|
93.731,00 |
109.129,00 |
73.526,00 |
0,00 |
0,00 |
|
|
B.4. Profit on disposal of both tangible and
intangible fixed assets and securities portfolio: |
50.401,00 |
0,00 |
0,00 |
0,00 |
0,00 |
|
|
B.5. Profit on transactions with own shares and
debentures: |
0,00 |
0,00 |
0,00 |
0,00 |
0,00 |
|
|
B.6. Capital grants transferred to profit and
loss: |
0,00 |
0,00 |
0,00 |
0,00 |
0,00 |
|
|
B.7. Extraordinary income: |
2.906,00 |
20.627,00 |
0,00 |
4.026,00 |
0,00 |
|
|
B.8. Income and profit of former financial years:
|
0,00 |
0,00 |
0,00 |
0,00 |
0,00 |
|
|
B.IV. NEGATIVE EXTRAORDINARY RESULTS
(A.9+A.10+A.11+A.12+A.13-B.4-B.5-B.6-B.7-B.8): |
0,00 |
0,00 |
1.880,00 |
0,00 |
1.485,00 |
|
|
B.V. LOSSES BEFORE TAXES (B.III+B.IV-A.III-A.IV): |
40.424,00 |
88.502,00 |
75.406,00 |
0,00 |
0,00 |
|
|
B.VI. FINANCIAL YEAR RESULTS (LOSSES) (B.V+A.14+A.15): |
30.324,00 |
67.622,00 |
56.379,00 |
0,00 |
0,00 |
|
MERCANTILE REGISTRY.
CASHFLOW STATEMENT
Model: Normal
> Source of information:
Data contained in this section is taken from the information declared in the
Annual Accounts submitted to the Trade Register.
|
|
2012 |
2011 |
2010 |
2009 |
2008 |
|
|
1. Fiscal year
result before taxes.: 61100 |
-40.424,00 |
-88.502,00 |
-75.406,00 |
68.162,00 |
353.752,00 |
|
|
2. Results
adjustments.: 61200 |
-3.151,00 |
-11.904,00 |
13.262,00 |
22.008,00 |
73.094,00 |
|
|
a) Fixed Assets Amortization (+).: 61201 |
26.574,00 |
26.357,00 |
21.026,00 |
24.463,00 |
34.935,00 |
|
|
b) Obsolescence Allowances (+/-). : 61202 |
0,00 |
0,00 |
0,00 |
0,00 |
59.801,00 |
|
|
c) Variation in Provision (+/-). : 61203 |
4.715,00 |
-50,00 |
13.104,00 |
3.458,00 |
0,00 |
|
|
g) Financial income (-).: 61207 |
-34.695,00 |
-38.455,00 |
-20.868,00 |
-5.913,00 |
-21.642,00 |
|
|
h) Financial Expenses (+). : 61208 |
255,00 |
245,00 |
0,00 |
0,00 |
0,00 |
|
|
3. Changes in
current capital equity.: 61300 |
-42.589,00 |
215.584,00 |
-104.649,00 |
-670.183,00 |
44.706,00 |
|
|
a) Stock (+/-).: 61301 |
-61.428,00 |
-101.325,00 |
161.945,00 |
-16.474,00 |
5.232,00 |
|
|
d) Debtors and other accounts receivable (+/-). : 61302 |
-62.498,00 |
379.171,00 |
-45.389,00 |
241.371,00 |
254.344,00 |
|
|
c) Other current assets (+/-). : 61303 |
106.535,00 |
-4.822,00 |
-364.917,00 |
-649.877,00 |
257,00 |
|
|
d) Creditors and other accounts payable (+/-). : 61304 |
-25.198,00 |
-57.439,00 |
143.712,00 |
-245.204,00 |
-173.634,00 |
|
|
e) Other current liabilities (+/-).: 61305 |
0,00 |
0,00 |
0,00 |
0,00 |
500,00 |
|
|
4. Other cash
flows for operating activities.: 61400 |
34.440,00 |
38.210,00 |
20.868,00 |
5.913,00 |
-82.645,00 |
|
|
a) Interest payments (-). : 61401 |
-255,00 |
-245,00 |
0,00 |
0,00 |
0,00 |
|
|
c) Interest collection (+). : 61403 |
34.695,00 |
38.455,00 |
20.868,00 |
5.913,00 |
17.778,00 |
|
|
d) Income tax payment collection (payments) (+/-).: 61404 |
0,00 |
0,00 |
0,00 |
0,00 |
-100.423,00 |
|
|
5. Operating
activity cash flows (1 + 2 + 3 + 4) : 61500 |
-51.724,00 |
153.389,00 |
-145.925,00 |
-574.101,00 |
388.907,00 |
|
|
6. Payments for
investment (-).: 62100 |
-20.965,00 |
-33.470,00 |
-21.736,00 |
-5.282,00 |
-6.193,00 |
|
|
b) Intangible fixed assets. : 62102 |
0,00 |
-12.590,00 |
-2.709,00 |
-5.282,00 |
0,00 |
|
|
c) Fixed assets. : 62103 |
-10.865,00 |
0,00 |
0,00 |
0,00 |
-6.193,00 |
|
|
h) Other assets. : 62108 |
-10.100,00 |
-20.880,00 |
-19.027,00 |
0,00 |
0,00 |
|
|
7. Divestment
payment collection (+). : 62200 |
5.519,00 |
5.631,00 |
4.372,00 |
14.625,00 |
0,00 |
|
|
b) Intangible fixed assets. : 62202 |
5.519,00 |
0,00 |
0,00 |
0,00 |
0,00 |
|
|
c) Fixed assets. : 62203 |
0,00 |
5.631,00 |
4.372,00 |
14.625,00 |
0,00 |
|
|
8. Investment activity
cash flows (6 + 7) minus Amortization: 62300 |
-42.019,00 |
-54.195,00 |
-38.391,00 |
-15.120,00 |
-6.193,00 |
|
|
9. Payment
collection and payments for equity instruments. : 63100 |
0,00 |
0,00 |
0,00 |
0,00 |
0,00 |
|
|
10. Payment
collection and payments for financial liabilities instruments.: 63200 |
-7.001,00 |
15.296,00 |
-1.725,00 |
928,00 |
-1.011,00 |
|
|
a) Issuance : 63201 |
0,00 |
15.296,00 |
0,00 |
1.428,00 |
0,00 |
|
|
2. Debts incurred with credit institutions (+). : 63203 |
0,00 |
15.296,00 |
0,00 |
1.428,00 |
0,00 |
|
|
b) Repayment and amortization of : 63207 |
-7.001,00 |
0,00 |
-1.725,00 |
-500,00 |
-1.011,00 |
|
|
2. Debts incurred with credit institutions (-).: 63209 |
-7.001,00 |
0,00 |
-1.725,00 |
0,00 |
-1.011,00 |
|
|
5. Other debts (-). : 63212 |
0,00 |
0,00 |
0,00 |
-500,00 |
0,00 |
|
|
11. Payments from
dividends and remunerations from other assets instruments. : 63300 |
0,00 |
0,00 |
0,00 |
0,00 |
0,00 |
|
|
a) Dividends (-).: 63301 |
0,00 |
0,00 |
0,00 |
0,00 |
229.000,00 |
|
|
12. Cash flows
for financing activities (9+10+11).: 63400 |
-7.001,00 |
15.296,00 |
-1.725,00 |
928,00 |
-1.011,00 |
|
|
D) EFECTO DE LAS
VARIACIONES DE LOS TIPOS DE CAMBIO: 64000 |
0,00 |
0,00 |
0,00 |
0,00 |
0,00 |
|
|
E) NET
INCREASE/DECREASE OF CASH OR EQUIVALENT ASSETS (+/-5+/-8+/12+/-D) :
65000 |
-100.744,00 |
114.490,00 |
-186.040,00 |
-588.293,00 |
381.703,00 |
|
|
Cash or equivalent assets as of beginning of the fiscal year.:
65100 |
487.103,00 |
372.613,00 |
558.654,00 |
1.146.947,00 |
765.244,00 |
|
|
Cash or equivalent assets as of end of the fiscal year.: 65200 |
386.359,00 |
487.103,00 |
372.613,00 |
558.654,00 |
1.146.947,00 |
|
>
Economic-Financial Comparative Analysis
Data used in the
following ratios and indicators is taken from the Annual Accounts submitted by
the company to the TRADE REGISTER.
> Comparison
within the Sector
|
Cash Flow |
2012 |
2011 |
Variación 2012 - 2011 |
|
|||
|
|
Empresa |
Sector |
Empresa |
Sector |
Empresa |
Sector |
|
|
Cash Flow over
Sales: |
-0,04 % |
0,00 % |
0,05 % |
0,01 % |
-184,81 % |
-104,06 % |
|
|
EBITDA over
Sales: |
-3,91 % |
2,62 % |
-4,83 % |
4,34 % |
19,06 % |
-39,55 % |
|
|
Cash Flow Yield:
|
-0,04 % |
0,00 % |
0,04 % |
0,01 % |
-190,12 % |
-103,76 % |
|
|
Profitability |
2012 |
2011 |
Variación 2012 - 2011 |
|
|||
|
|
Empresa |
Sector |
Empresa |
Sector |
Empresa |
Sector |
|
|
Operating
economic profitability: |
-4,13 % |
0,95 % |
-7,99 % |
1,44 % |
48,28 % |
-34,08 % |
|
|
Total economic
profitability: |
-1,43 % |
1,35 % |
-3,07 % |
1,81 % |
53,39 % |
-25,45 % |
|
|
Financial
profitability: |
-1,29 % |
-0,34 % |
-2,85 % |
0,39 % |
54,58 % |
-187,53 % |
|
|
Margin: |
-2,99 % |
1,06 % |
-5,88 % |
1,57 % |
49,15 % |
-32,35 % |
|
|
Mark-up: |
-1,66 % |
-0,22 % |
-4,35 % |
0,27 % |
61,75 % |
-182,85 % |
|
|
Solvency |
2012 |
2011 |
Variación 2012 - 2011 |
|
|||
|
|
Empresa |
Sector |
Empresa |
Sector |
Empresa |
Sector |
|
|
Liquidity: |
0,87 |
0,23 |
1,02 |
0,22 |
-14,29 |
8,31 |
|
|
Acid Test: |
4,88 |
1,07 |
4,82 |
1,02 |
1,29 |
5,42 |
|
|
Working Capital /
Investment: |
0,78 |
0,21 |
0,78 |
0,23 |
0,03 |
-5,33 |
|
|
Solvency: |
6,12 |
1,79 |
5,82 |
1,76 |
5,22 |
1,99 |
|
|
Indebtedness |
2012 |
2011 |
Variación 2012 - 2011 |
|
|||
|
|
Empresa |
Sector |
Empresa |
Sector |
Empresa |
Sector |
|
|
Indebtedness
level: |
0,19 |
1,08 |
0,21 |
1,36 |
-7,51 |
-20,70 |
|
|
Borrowing
Composition: |
0,01 |
0,80 |
0,02 |
0,83 |
-72,98 |
-3,33 |
|
|
Repayment
Ability: |
-4,41 |
-1.451,83 |
4,25 |
60,69 |
-203,76 |
-2.492,18 |
|
|
Warranty: |
6,32 |
1,93 |
5,91 |
1,74 |
6,94 |
11,02 |
|
|
Generated
resources / Total creditors: |
-0,01 |
0,04 |
-0,08 |
0,05 |
90,05 |
-5,81 |
|
|
Efficiency |
2012 |
2011 |
Variación 2012 - 2011 |
|
|||
|
|
Empresa |
Sector |
Empresa |
Sector |
Empresa |
Sector |
|
|
Productivity:
|
0,56 |
1,11 |
0,50 |
1,19 |
11,71 |
-7,34 |
|
|
Turnover of
Collection Rights : |
3,04 |
4,25 |
3,16 |
4,13 |
-3,78 |
2,81 |
|
|
Turnover of
Payment Entitlements: |
5,97 |
2,76 |
5,50 |
2,75 |
8,66 |
0,36 |
|
|
Stock rotation:
|
5,46 |
3,66 |
6,05 |
3,39 |
-9,78 |
8,05 |
|
|
Assets turnover:
|
1,38 |
0,90 |
1,36 |
0,92 |
1,70 |
-2,56 |
|
|
Borrowing Cost:
|
0,06 |
2,43 |
0,05 |
2,40 |
13,77 |
1,14 |
|
> Trend of
indicators under the General Accounting Plan of 2007 (2012, 2011, 2010, 2009,
2008)
|
Cash Flow |
2012 |
2011 |
2010 |
2009 |
2008 |
|
|
Cash Flow over
Sales: |
-0,04 % |
0,05 % |
-0,06 % |
-19,44 % |
7,33 % |
|
|
EBITDA over
Sales: |
-3,91 % |
-4,83 % |
-2,27 % |
2,73 % |
7,08 % |
|
|
Cash Flow Yield:
|
-0,04 % |
0,04 % |
-0,06 % |
-20,11 % |
12,32 % |
|
|
Profitability |
2012 |
2011 |
2010 |
2009 |
2008 |
|
|
Operating economic
profitability: |
-4,13 % |
-7,99 % |
-4,73 % |
2,57 % |
10,80 % |
|
|
Total economic
profitability: |
-1,43 % |
-3,07 % |
-2,51 % |
2,33 % |
11,42 % |
|
|
Financial
profitability: |
-1,29 % |
-2,85 % |
-2,31 % |
1,93 % |
10,15 % |
|
|
Margin: |
-2,99 % |
-5,88 % |
-2,93 % |
1,92 % |
6,41 % |
|
|
Mark-up: |
-1,66 % |
-4,35 % |
-2,30 % |
2,12 % |
0,44 % |
|
|
Solvency |
2012 |
2011 |
2010 |
2009 |
2008 |
|
|
Liquidity: |
0,87 |
1,02 |
0,68 |
1,31 |
1,76 |
|
|
Acid Test: |
4,88 |
4,82 |
4,66 |
5,48 |
3,86 |
|
|
Working Capital /
Investment: |
0,78 |
0,78 |
0,78 |
0,82 |
0,76 |
|
|
Solvency: |
6,12 |
5,82 |
5,31 |
6,65 |
4,61 |
|
|
Indebtedness |
2012 |
2011 |
2010 |
2009 |
2008 |
|
|
Indebtedness
level: |
0,19 |
0,21 |
0,23 |
0,17 |
0,27 |
|
|
Borrowing
Composition: |
0,01 |
0,02 |
0,00 |
0,00 |
0,00 |
|
|
Repayment
Ability: |
-4,41 |
4,25 |
-2,95 |
4,73 |
-5,11 |
|
|
Warranty: |
6,32 |
5,91 |
5,47 |
6,86 |
4,76 |
|
|
Generated
resources / Total creditors: |
-0,01 |
-0,08 |
-0,06 |
0,17 |
0,50 |
|
|
Efficiency |
2012 |
2011 |
2010 |
2009 |
2008 |
|
|
Productivity:
|
0,56 |
0,50 |
0,70 |
1,33 |
2,52 |
|
|
Turnover of
Collection Rights : |
3,04 |
3,16 |
2,72 |
2,69 |
3,80 |
|
|
Turnover of
Payment Entitlements: |
5,97 |
5,50 |
5,56 |
6,36 |
7,08 |
|
|
Stock rotation:
|
5,46 |
6,05 |
9,75 |
5,96 |
10,10 |
|
|
Assets turnover:
|
1,38 |
1,36 |
1,61 |
1,34 |
1,69 |
|
|
Borrowing Cost:
|
0,06 |
0,05 |
0,00 |
0,00 |
0,00 |
|
COMPARATIVE
SECTORIAL BALANCE
Sector-based Comparison under the rules of
the New General Accounting Plan
|
|
Variación - |
|
|
|
Empresa |
Sector |
|
|
Variación - |
|
|
|
Empresa |
Sector |
News
Public Tenders and Works Won
No Public Tenders assigned to the name of
the company.
Detail of Subsidies appearing
in Balances Memories
|
Entity |
ORGANISMO NO
ESPECIFICADO |
|
Status |
CONCEDIDA |
|
Amount Granted |
4.240,98 |
Research Summary
The commercial entity NAPOLEON ARMENGOL SL with VAT number B58838228 was founded in Barcelona in June, 1989 and it is engaged in wholesale of machinery and equipment, mainly of electrical installations. According to the sources consulted and after the analysis of the data we have and economic information for the year 2012, we estimate in general that its structure is favourable.
FOREIGN EXCHANGE RATES
|
Currency |
Unit
|
Indian Rupees |
|
US Dollar |
1 |
Rs.62.73 |
|
|
1 |
Rs.100.92 |
|
Euro |
1 |
Rs.84.06 |
INFORMATION DETAILS
|
Report Prepared
by : |
SDA |
RATING EXPLANATIONS
|
RATING |
STATUS |
PROPOSED CREDIT LINE |
|
|
>86 |
Aaa |
Possesses an extremely sound financial base with the strongest
capability for timely payment of interest and principal sums |
Unlimited |
|
71-85 |
Aa |
Possesses adequate working capital. No caution needed for credit transaction.
It has above average (strong) capability for payment of interest and
principal sums |
Large |
|
56-70 |
A |
Financial & operational base are regarded healthy. General
unfavourable factors will not cause fatal effect. Satisfactory capability for
payment of interest and principal sums |
Fairly Large |
|
41-55 |
Ba |
Overall operation is considered normal. Capable to meet normal
commitments. |
Satisfactory |
|
26-40 |
B |
Capability to overcome
financial difficulties seems comparatively below average. |
Small |
|
11-25 |
Ca |
Adverse factors are apparent. Repayment of interest and principal sums
in default or expected to be in default upon maturity |
Limited with
full security |
|
<10 |
C |
Absolute credit risk exists. Caution needed to be exercised |
Credit not
recommended |
|
---- |
NB |
New Business |
---- |
This score serves as a reference to assess
SC’s credit risk and to set the amount of credit to be extended. It is
calculated from a composite of weighted scores obtained from each of the major
sections of this report. The assessed factors and their relative weights (as
indicated through %) are as follows:
Financial
condition (40%) Ownership
background (20%) Payment
record (10%)
Credit history
(10%) Market trend (10%) Operational size
(10%)
This report is issued at your request without any
risk and responsibility on the part of MIRA INFORM PRIVATE LIMITED (MIPL)
or its officials.