MIRA
INFORM REPORT
|
Report Date : |
21.11.2013 |
IDENTIFICATION DETAILS
|
Name : |
SHARDA EUROPE" SPOLKA Z OGRANICZONA ODPOWIEDZIALNOSCIA |
|
|
|
|
Registered Office : |
Rzgowska 276 A 95-200 Pabianice Lodzkie Pabianicki |
|
|
|
|
Country : |
Poland |
|
|
|
|
Financials (as on) : |
31.03.2012 |
|
|
|
|
Date of Incorporation : |
10.01.2005 |
|
|
|
|
Com. Reg. No.: |
473284146 |
|
|
|
|
Legal Form : |
Limited Liability Company |
|
|
|
|
Line of Business : |
Wholesale of textiles |
|
|
|
|
No. of Employees : |
Not Available |
RATING & COMMENTS
|
MIRA’s Rating : |
Ba |
|
RATING |
STATUS |
PROPOSED CREDIT LINE |
|
|
41-55 |
Ba |
Overall operation is considered normal. Capable to meet normal
commitments. |
Satisfactory |
|
Status : |
Satisfactory |
|
Payment Behaviour : |
No complaints |
|
Litigation : |
Clear |
NOTES :
Any query related to this report can be made
on e-mail: infodept@mirainform.com
while quoting report number, name and date.
ECGC Country Risk Classification List – March 31st, 2013
|
Country Name |
Previous Rating (31.12.2012) |
Current Rating (31.03.2013) |
|
Poland |
B1 |
B1 |
|
Risk Category |
ECGC
Classification |
|
Insignificant |
A1 |
|
Low |
A2 |
|
Moderate |
B1 |
|
High |
B2 |
|
Very High |
C1 |
|
Restricted |
C2 |
|
Off-credit |
D |
POLAND - ECONOMIC OVERVIEW
Poland has pursued a policy of economic liberalization since
1990 and Poland's economy was the only one in the European Union to avoid a
recession through the 2008-09 economic downturn. Although EU membership and
access to EU structural funds have provided a major boost to the economy since
2004, GDP per capita remains significantly below the EU average while
unemployment continues to exceed the EU average. The government of Prime
Minister Donald TUSK steered the Polish economy through the economic downturn
by skillfully managing public finances without stifling economic growth and
adopted controversial pension and tax reforms to further shore up public
finances. While the Polish economy has performed well over the past five years,
growth slowed in 2012, in part due to the ongoing economic difficulties in the
euro zone. The key policy challenge is to provide support to the economy
through monetary easing, while maintaining the pace of structural fiscal
consolidation. Poland's economic performance could improve over the longer term
if the country addresses some of the remaining deficiencies in its road and
rail infrastructure and its business environment. An inefficient commercial
court system, a rigid labor code, red tape, and a burdensome tax system keep
the private sector from realizing its full potential
Source
: CIA
GENERAL INFORMATION
|
Company Name: |
"SHARDA EUROPE"
SPOLKA Z OGRANICZONA ODPOWIEDZIALNOSCIA |
|
Tax identification number
NIP: |
729-256-30-43 |
|
REGON number: |
473284146 |
|
KRS number: |
KRS 0000225721 |
ADDRESS
|
Street: |
RZGOWSKA 276 A |
|
Postal code: |
95-200 |
|
City: |
PABIANICE |
|
Province: |
LODZKIE |
|
County: |
PABIANICKI |
|
Commune: |
PABIANICE |
CURREN BOARD OF MANAGEMENT
|
PRESIDENT OF MANAGEMENT
BOARD |
ANIL MANSINGHKA |
|
VICE-PRESIDENT OF
MANAGEMENT BOARD |
AMIT LATH |
Other info
|
Legal form: |
LIMITED LIABILITY COMPANY |
|
Registration date: |
10.01.2005 |
|
Activity status: |
Active company |
|
Company representation: |
DO SKLADANIA OSWIADCZEN W
IMIENIU SPOLKI UPRAWNIONY JEST SAMODZIELNIE KAZDY Z CZLONKOW ZARZADU |
|
Bank Account |
|
|
NACE rev 2 (core activity) |
46.41 WHOLESALE OF
TEXTILES |
|
NACE rev 1.1 (core
activity) |
51.41 WHOLESALE OF
TEXTILES |
SELECTED FINANCIAL
DATA (2011)
|
Turnover |
90,678,117.75 |
|
Net Sales |
87,559,432.93 |
|
Total Assets |
45,486,967.20 |
|
Net Profit/Loss |
2,210,941.46 |
PAYMENT INFO
|
Type of info |
Details |
|
List of Payment/Collection/Debt
info: |
There are no negative on
the company payment behavior by available sources of KRD (National Debt Register
Economic Information Bureau) at 2013.11.15 |
BASIC INFORMATION
Registered name:
"SHARDA EUROPE"
SPOLKA Z OGRANICZONA ODPOWIEDZIALNOSCIA
KRS number: KRS 0000225721
REGON number: 473284146
|
Tax identification number
NIP: |
729-256-30-43 |
Legal form
|
LIMITED LIABILITY COMPANY |
Registered address
|
City: |
PABIANICE |
|
Street: |
RZGOWSKA 276 A |
|
Postal code: |
95-200 |
|
Postal area: |
|
|
Province: |
LODZKIE |
|
County: |
PABIANICKI |
|
Commune: |
PABIANICE |
|
Data submitted at the registration
day: |
|
On 18.02.2005 following
changes were made:
GORNICZA 18/36 91-765 LODZ
On 21.10.2005 following
changes were made:
NICIARNIANA 50/52 92-320
LODZ
On 11.02.2008 following
changes were made:
PABIANICE RZGOWSKA 276 A 95-200
PABIANICE POLSKA
Is the company working with
other entities based on civil law contracts:
NO
Company registration date in
KRS:
10.01.2005
Duration for which the
company was established:
UNDEFINED
Can a shareholder have one
or more shares:
MORE SHARES
Date of signing the articles
of association or statutes of the company:
05.11.2004
HISTORY OF AMENDMENTS
IN THE AGREEMENT
On 07.04.2005 following
changes were made:
10 MARCA 2005 R., REP. A NR 1113/2005,
NOTARIUSZ GRZEGORZ SZAFRUGA, KANCELARIA NOTARIALNA W LODZI - ZMIANA § 2
On 11.02.2008 following
changes were made:
31.01.2008 R. - REPERTORIUM
A NR 893/2008, NOTARIUSZ GRZEGORZ SZAFRUGA, KANCELARIA NOTARIALNA W LODZI,
ZMIANIE ULEGL: § 3
ORAZ § 23 UMOWY SPOLKI Z DNIA 05.11.2004 R.
On 19.11.2009 following
changes were made:
31 LIPCA 2009 R.,
REPERTORIUM A NR 11643/2009, NOTARIUSZ ARTUR STRZ^PEK, KANCELARIA NOTARIALNA W
LODZI - ZMIANA § 6.2 UMOWY SPOLKI.
On 10.02.2012 following changes
were made:
20.01.2012 R., NOTARIUSZ
WLODZIMIERZ OLEK, KANCELARIRA NOTARIALNA W PABIANICACH, REP, A NR 241/2012,
ZMIANA TRESCI PAR 6 UMOWY SPOLKI.
On 13.12.2012 following
changes were made:
3.10.2012 ROKU, REPERTORIUM
A NR 4056/2012, NOTARIUSZ DOMINIK JAN KASZYNSKI KANCELARIA NOTARIALNA W LODZI -
ZMIANA § 18 UST. 2, DODANO W § 18 UST. 3
INFORMATION ON COMPANY
ESTABLISHMENT
Data submitted at the
registration day:
|
Event type |
Duration for which the
company was established |
Description of the letter |
Can a shareholder have one
or more shares |
|
Entry made |
UNDEFINED |
|
MORE SHARES |
SHAREHOLDERS
Data submitted at the
registration day:
|
Event type |
Surname or business name
of shareholder/partner |
Names of shareholder |
PESEL/REGON |
KRS |
Shares |
Value of shares |
All shares |
|
Remained the shareholder |
SHARDA SPUNTEX PRIVATE
LIMITED |
|
|
|
99 |
49500 |
NO |
|
On 07.04.2005 following
changes were made: |
|||||||
|
Event type |
Surname or business name
of shareholder/partner |
Names of shareholder |
PESEL/REGON |
KRS |
Shares |
Value of shares |
All shares |
|
Changed |
Changed (Shares) from
amount: 99 to amount: 3099 from value: 49500 to value: 1549500 with reference
to: (dla pozycji 1. SHARDA SPUNTEX PRIVATE LIMITED) |
||||||
Share capital
|
Event type |
Share capital |
|
Defined |
50000.00 |
|
The capital was increased |
1550000.00 |
REPRESENTATION METHOD
DO SKŁADANIA OŚWIADCZEŃ W IMIENIU SPÓŁKI UPRAWNIONY JEST SAMODZIELNIE KAŻDY Z CZŁONKÓW ZARZĄDU
CURRENT BOARD OF MANAGEMENT
Function Person
PRESIDENT OF MANAGEMENT BOARD ANIL MANSINGHKA
VICE-PRESIDENT OF MANAGEMENT BOARD AMIT LATH
HISTORY OF CHANGES IN BOARD OF
MANAGEMENT
|
Event type |
Surname or business name
of representing party |
Names of representative |
PESEL/REGON |
Position |
Was s/he suspended |
End of suspension |
|
Appointed |
MANSINGHKA |
ANIL KUMAR |
|
PRESIDENT OF MANAGEMENT
BOARD |
NO |
|
|
Appointed |
LATH |
AMIT KAILASHCHANDRA |
|
VICE-PRESIDENT OF
MANAGEMENT BOARD |
NO |
|
|
Appointed |
MANSINGHKA |
MANOJ KUMAR |
|
VICE-PRESIDENT OF
MANAGEMENT BOARD |
NO |
|
|
On 15.11.2006 following
changes were made: |
||||||
|
Event type |
Surname or business name
of representing party |
Names of representative |
PESEL/REGON |
Position |
Was s/he suspended |
End of suspension |
|
Canceled |
MANSINGHKA |
MANOJ KUMAR |
|
VICE-PRESIDENT OF
MANAGEMENT BOARD |
NO |
|
|
PROXIES Data submitted at the
registration day: |
||||||
|
Event type |
Proxy name |
Proxy first name |
PESEL |
Proxy type |
||
|
Proxy created |
AJMERA |
DEEPAK |
|
SELF PROXY |
||
TYPE
OF ACTIVITY
Data submitted at the
registration day: |
||||||
|
Event type |
Object of activity
according to NACE |
|||||
|
Activity commenced |
51.41 WHOLESALE OF
TEXTILES |
|||||
|
Activity commenced |
51.42 WHOLESALE OF
CLOTHING AND FOOTWEAR |
|||||
|
On 19.11.2009 following
changes were made: |
||||||
|
Event type |
Object of activity
according to NACE |
|||||
|
Activity discontinued |
51.41 WHOLESALE OF
TEXTILES |
|||||
|
Activity discontinued |
51.42 WHOLESALE OF
CLOTHING AND FOOTWEAR |
|||||
|
Activity discontinued |
51.24 WHOLESALE OF HIDES,
SKINS AND LEATHER |
|||||
|
Activity discontinued |
51.35 WHOLESALE OF TOBACCO
PRODUCTS |
|||||
|
Activity discontinued |
51.36 WHOLESALE OF SUGAR
AND CHOCOLATE AND SUGAR CONFECTIONERY |
|||||
|
Activity discontinued |
51.37 WHOLESALE OF COFFEE,
TEA, COCOA AND SPICES |
|||||
|
Activity discontinued |
51.38 WHOLESALE OF OTHER
FOOD, INCLUDING FISH, CRUSTACEANS AND MOLLUSCS |
|||||
|
discontinued |
51.45 WHOLESALE OF PERFUME
AND COSMETICS |
|
Activity discontinued |
51.55 WHOLESALE OF
CHEMICAL PRODUCTS |
|
Activity discontinued |
51.56 WHOLESALE OF OTHER
INTERMEDIATE PRODUCTS |
|
Activity discontinued |
51.90 OTHER WHOLESALE |
|
Activity discontinued |
52.33 RETAIL SALE OF
COSMETIC AND TOILET ARTICLES |
|
Activity discontinued |
52.41 RETAIL SALE OF
TEXTILES |
|
Activity discontinued |
52.42 RETAIL SALE OF
CLOTHING |
|
Activity discontinued |
52.43 RETAIL SALE OF
FOOTWEAR AND LEATHER GOODS |
|
Activity discontinued |
60.24 FREIGHT TRANSPORT BY
ROAD |
|
Activity discontinued |
63.12 STORAGE AND
WAREHOUSING |
|
Activity discontinued |
74.40 ADVERTISING |
|
Activity discontinued |
26.70 CUTTING, SHAPING AND
FINISHING OF ORNAMENTAL AND BUILDING STONE |
|
Activity discontinued |
70.12 BUYING AND SELLING
OF OWN REAL ESTATE |
|
Activity discontinued |
74.13 MARKET RESEARCH AND
PUBLIC OPINION POLLING |
|
Activity discontinued |
74.14 BUSINESS AND
MANAGEMENT CONSULTANCY ACTIVITIES |
|
Activity discontinued |
55.30 RESTAURANTS |
|
Activity discontinued |
55.40 BARS |
|
Activity discontinued |
55.52 CATERING |
|
Activity commenced |
46.41 WHOLESALE OF
TEXTILES |
|
Activity commenced |
46.42 WHOLESALE OF
CLOTHING AND FOOTWEAR |
|
Activity commenced |
46.24 WHOLESALE OF HIDES,
SKINS AND LEATHER |
|
Activity commenced |
46.35 WHOLESALE OF TOBACCO
PRODUCTS |
|
Activity commenced |
46.36 WHOLESALE OF SUGAR
AND CHOCOLATE AND SUGAR CONFECTIONERY |
|
Activity commenced |
46.37 WHOLESALE OF COFFEE,
TEA, COCOA AND SPICES |
|
Activity commenced |
46.38 WHOLESALE OF OTHER
FOOD, INCLUDING FISH, CRUSTACEANS AND MOLLUSCS |
|
Activity commenced |
46.31 WHOLESALE OF FRUIT
AND VEGETABLES |
|
Activity commenced |
46.45 WHOLESALE OF PERFUME
AND COSMETICS |
|
Activity commenced |
46.75 WHOLESALE OF
CHEMICAL PRODUCTS |
|
Activity commenced |
46.76 WHOLESALE OF OTHER
INTERMEDIATE PRODUCTS |
|
Activity commenced |
46.90 NON-SPECIALISED
WHOLESALE TRADE |
|
Activity commenced |
47.75 RETAIL SALE OF
COSMETIC AND TOILET ARTICLES IN SPECIALISED STORES |
|
Activity commenced |
47.51 RETAIL SALE OF
TEXTILES IN SPECIALISED STORES |
|
Activity commenced |
47.71 RETAIL SALE OF
CLOTHING IN SPECIALISED STORES |
|
Activity commenced |
47.72 RETAIL SALE OF
FOOTWEAR AND LEATHER GOODS IN SPECIALISED STORES |
|
Activity commenced |
49.41 FREIGHT TRANSPORT BY
ROAD |
|
Activity commenced |
49.42 REMOVAL SERVICES |
|
Activity commenced |
52.10 WAREHOUSING AND
STORAGE |
|
Activity commenced |
73.11 ADVERTISING AGENCIES |
|
Activity commenced |
73.12 MEDIA REPRESENTATION |
|
Activity commenced |
23.70 CUTTING, SHAPING AND
FINISHING OF STONE |
|
Activity commenced |
68.20 RENTING AND
OPERATING OF OWN OR LEASED REAL ESTATE |
|
Activity commenced |
73.20 MARKET RESEARCH AND
PUBLIC OPINION POLLING |
|
Activity commenced |
02.40 SUPPORT SERVICES TO
FORESTRY |
|
Activity commenced |
70.21 PUBLIC RELATIONS AND
COMMUNICATION ACTIVITIES |
|
Activity commenced |
70.22 BUSINESS AND OTHER MANAGEMENT
CONSULTANCY ACTIVITIES |
|
Activity commenced |
74.90 OTHER PROFESSIONAL,
SCIENTIFIC AND TECHNICAL ACTIVITIES N.E.C. |
|
Activity commenced |
85.60 EDUCATIONAL SUPPORT
ACTIVITIES |
|
Activity commenced |
56.10 RESTAURANTS AND MOBILE
FOOD SERVICE ACTIVITIES |
|
Activity commenced |
56.30 BEVERAGE SERVING
ACTIVITIES |
FINANCIAL STATEMENTS
|
Event type |
For the year |
Date from |
Date until |
|
Financial statement
submitted |
2005 |
01.01.2005 |
31.12.2005 |
|
Financial statement
submitted |
2006 |
01.01.2006 |
31.12.2006 |
|
Financial statement
submitted |
2007 |
01.01.2007 |
31.12.2007 |
|
Financial statement
submitted |
2008 |
01.01.2008 |
31.03.2009 |
|
Financial statement submitted |
2009 |
01.04.2009 |
31.03.2010 |
|
Financial statement
submitted |
2010 |
01.04.2010 |
31.03.2011 |
|
Financial statement
submitted |
2011 |
01.04.2011 |
31.03.2012 |
|
Financial statement
submitted |
2012 |
01.04.2012 |
31.03.2013 |
INDUSTRY ANALYSIS
Income
|
|
2012 |
2011 |
2010 |
2009 |
2008 |
2007 |
|
Company(in millions) : |
|
87.56 |
119.71 |
79.28 |
78.07 |
55.86 |
|
Industry(in millions) : |
6.18 |
5.44 |
3.82 |
3.94 |
4.66 |
5.40 |
|
Companies in industry: |
91 |
193 |
319 |
316 |
290 |
254 |
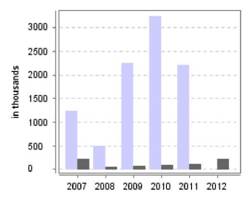
Net profit

|
|
2012 |
2011 |
2010 |
2009 |
2008 |
2007 |
|
Company(in thousands) : |
|
2,211 |
3,250 |
2,257 |
490.93 |
1,226 |
|
Industry(in thousands) : |
226.77 |
114.33 |
96.27 |
81.45 |
56.71 |
227.28 |
|
Companies in industry: |
94 |
203 |
338 |
338 |
306 |
269 |
Net income
|
|
2012 |
2011 |
2010 |
2009 |
2008 |
2007 |
|
Company : |
|
-26.86 |
51.00 |
|
|
3.82 |
|
Industry : |
-0.06 |
2.39 |
2.00 |
-5.10 |
-2.61 |
8.97 |
|
Companies in industry: |
54 |
141 |
228 |
208 |
175 |
183 |
|
|
2012 |
2011 |
2010 |
2009 |
2008 |
2007 |
|
Company : |
|
-26.86 |
51.00 |
|
|
3.82 |
|
Industry : |
-0.06 |
2.39 |
2.00 |
-5.10 |
-2.61 |
8.97 |
|
Companies in industry: |
54 |
141 |
228 |
208 |
175 |
183 |
Revenue growth

|
|
2012 |
2011 |
2010 |
2009 |
2008 |
2007 |
|
Company : |
|
-31.98 |
44.02 |
|
|
534.58 |
|
Industry : |
14.33 |
3.43 |
18.49 |
18.82 |
-11.55 |
43.16 |
|
Companies in industry: |
42 |
85 |
135 |
112 |
108 |
138 |
Return on revenue

|
|
2012 |
2011 |
2010 |
2009 |
2008 |
2007 |
|
Company : |
|
0.02 |
0.03 |
0.03 |
0.01 |
0.02 |
|
Industry : |
0.04 |
0.01 |
0.01 |
0.00 |
0.00 |
0.04 |
|
Companies in industry: |
91 |
193 |
319 |
316 |
290 |
254 |

|
|
2012 |
2011 |
2010 |
2009 |
2008 |
2007 |
|
Company : |
|
0.72 |
0.24 |
0.22 |
0.14 |
0.11 |
|
Industry : |
0.41 |
0.30 |
0.42 |
0.38 |
0.26 |
0.36 |
|
Companies in industry: |
92 |
194 |
331 |
329 |
298 |
265 |

|
|
2012 |
2011 |
2010 |
2009 |
2008 |
2007 |
|
Company : |
|
0.18 |
0.32 |
0.32 |
0.10 |
0.29 |
|
Industry : |
0.18 |
0.11 |
0.11 |
0.14 |
0.16 |
0.22 |
|
Companies in industry: |
94 |
203 |
338 |
338 |
306 |
269 |

|
|
2012 |
2011 |
2010 |
2009 |
2008 |
2007 |
|
Company : |
|
0.05 |
0.09 |
0.07 |
0.02 |
0.11 |
|
Industry : |
0.06 |
0.02 |
0.02 |
0.02 |
0.01 |
0.06 |
|
Companies in industry: |
94 |
203 |
338 |
337 |
306 |
269 |

|
|
2012 |
2011 |
2010 |
2009 |
2008 |
2007 |
|
Company : |
|
2.60 |
2.32 |
3.66 |
4.94 |
1.66 |
|
Industry : |
1.55 |
1.84 |
1.84 |
1.68 |
1.84 |
1.81 |
|
Companies in industry: |
92 |
196 |
333 |
331 |
298 |
265 |

|
|
2012 |
2011 |
2010 |
2009 |
2008 |
2007 |
|
Company : |
|
3.65 |
3.38 |
4.80 |
6.40 |
2.71 |
|
Industry : |
2.46 |
2.74 |
2.78 |
2.63 |
2.81 |
2.76 |
|
|
2012 |
2011 |
2010 |
2009 |
2008 |
2007 |
|
Company(in thousands) : |
|
2,073 |
1,664 |
1,142 |
623.99 |
656.97 |
|
Industry(in thousands) : |
163.52 |
106.43 |
80.40 |
81.42 |
84.66 |
109.57 |
|
Companies in industry: |
91 |
192 |
318 |
314 |
286 |
252 |

|
|
2012 |
2011 |
2010 |
2009 |
2008 |
2007 |
|
Company : |
|
2.00 |
2.00 |
0.00 |
0.00 |
3.00 |
|
Industry : |
1.09 |
1.38 |
1.19 |
1.02 |
0.93 |
1.34 |
|
Companies in industry: |
95 |
205 |
343 |
340 |
306 |
274 |
|
FINANCIAL DATA |
2DD7 2DD8
2009 2010 2011 2012 |
|||||
|
|
01.04.2011 |
01.04.2010 |
01.04.2009 |
01.01.2008 |
01.01.2007 |
01.01.2006 |
|
|
31.03.2012 |
31.03.2011 |
31.03.2010 |
31.03.2009 |
31.12.2007 |
31.12.2006 |
|
BALANCE SHEET |
||||||
|
Fixed assets |
656345.13 |
1189826.84 |
1303408.68 |
2257198.14 |
801534.38 |
33105.44 |
|
I. Intangible assets |
2713.28 |
3453.32 |
1054.13 |
2644.37 |
4638.18 |
6228.41 |
|
Research & development
costs |
|
|
|
|
|
|
|
Goodwill |
|
|
|
|
|
|
|
Other intangible assets |
2713.28 |
3453.32 |
1054.13 |
2644.37 |
4638.18 |
6228.41 |
|
Advance payments for
intangible assets |
|
|
|
|
|
|
|
II. Tangible assets |
239812.85 |
76339.52 |
78412.55 |
52643.77 |
14471.20 |
26877.03 |
|
Fixed assets |
239812.85 |
58583.42 |
78412.55 |
52643.77 |
14471.20 |
26877.03 |
|
a. Freehold land,
including perpetual usufruct |
|
|
|
|
|
|
|
b. Buildings &
constructions |
|
|
|
|
|
|
|
c. Plant & machinery |
3033.53 |
3733.49 |
4433.45 |
5446.89 |
14471.20 |
26877.03 |
|
d. Transportation means |
232092.12 |
48339.93 |
73979.10 |
47196.88 |
|
|
|
e. Other fixed assets |
4687.20 |
6510.00 |
|
|
|
|
|
Assets under construction |
|
|
|
|
|
|
|
Advance payments for fixed
assets |
|
17756.10 |
|
|
|
|
|
III. Long-term receivables |
|
|
|
|
|
|
|
From related entities |
|
|
|
|
|
|
|
From other entities |
|
|
|
|
|
|
|
IV. Long-term investments |
|
846870.00 |
861600.00 |
1062480.00 |
730500.00 |
|
|
Real property |
|
|
|
|
|
|
|
Intangible assets |
|
|
|
|
|
|
|
Long-term financial assets |
|
846870.00 |
861600.00 |
1062480.00 |
730500.00 |
|
|
a. In related entities |
|
846870.00 |
861600.00 |
1062480.00 |
|
|
|
i. Stocks or shares |
|
|
|
|
|
|
|
ii. Other securities |
|
|
|
|
|
|
|
iii. Loans granted |
|
846870.00 |
861600.00 |
1062480.00 |
|
|
|
iv. Other long-term financial
assets |
|
|
|
|
|
|
|
b. In order entities |
|
|
|
|
730500.00 |
|
|
i. Stocks or shares |
|
|
|
|
|
|
|
ii. Other securities |
|
|
|
|
|
|
|
iii. Loans granted |
|
|
|
|
730500.00 |
|
|
iv. Other long-term financial
assets |
|
|
|
|
|
|
|
Other long-term
investments |
|
|
|
|
|
|
|
V. Long-term prepayments
and accrued income |
413819.00 |
263164.00 |
362342.00 |
1139430.00 |
51925.00 |
|
|
Deferred income tax assets |
413819.00 |
263164.00 |
362342.00 |
1139430.00 |
51925.00 |
|
|
Other prepayments |
|
|
|
|
|
|
|
Current assets |
44830622.07 |
33470192.11 |
32359068.56 |
27993757.52 |
10666005.34 |
15203562.54 |
|
I. Inventory |
7249488.79 |
5993593.22 |
10506713.26 |
5489100.36 |
4776657.46 |
8548095.34 |
|
Raw materials |
|
|
|
|
|
|
|
Semi-finished goods and
work in progress |
|
|
|
|
|
|
|
Finished products |
|
|
|
|
|
|
|
Merchandise |
5836205.12 |
4261899.61 |
7653644.41 |
1950961.74 |
4284797.79 |
8548095.34 |
|
Advance payments for
deliveries |
1413283.67 |
1731693.61 |
2853068.85 |
3538138.62 |
491859.67 |
|
|
II. Short-term receivables |
14008412.53 |
21644020.85 |
15910270.68 |
19097505.64 |
5051215.42 |
5846480.47 |
|
Receivables from related
entities |
2733960.43 |
9453339.55 |
7379232.80 |
8692865.88 |
288649.26 |
1282494.33 |
|
a. Trade loans and credits
with payment date |
2733960.43 |
9453339.55 |
7379232.80 |
8692865.88 |
288649.26 |
1282494.33 |
|
i. Up to 12 months |
2733960.43 |
9453339.55 |
7379232.80 |
8692865.88 |
288649.26 |
1282494.33 |
|
ii. Over 12 months |
|
|
|
|
|
|
|
b. Other |
|
|
|
|
|
|
|
Receivables from other
entities |
11274452.10 |
12190681.30 |
8531037.88 |
10404639.76 |
4762566.16 |
4563986.14 |
|
a. Trade loans and credits
with payment date |
11262518.79 |
12164995.39 |
8410261.76 |
10343669.02 |
4035497.31 |
3607487.26 |
|
i. Up to 12 months |
11262518.79 |
12164995.39 |
8410261.76 |
10343669.02 |
4035497.31 |
3607487.26 |
|
ii. Over 12 months |
|
|
|
|
|
|
|
b. Taxation, grants,
customs duty, social security |
|
|
4098.00 |
49.93 |
625008.85 |
642004.71 |
|
c. Other |
11933.31 |
25685.91 |
116678.12 |
60920.81 |
102060.00 |
21324.90 |
|
d. Subject to court proceedings |
|
|
|
|
|
293169.27 |
|
III. Short-term
investments |
23492947.98 |
5799328.48 |
5563149.50 |
3323164.27 |
784874.07 |
762035.33 |
|
Short-term financial
assets |
23492947.98 |
5799328.48 |
5563149.50 |
3323164.27 |
784874.07 |
762035.33 |
|
a. In related entities |
|
|
|
95623.20 |
22108.97 |
|
|
i. Stocks or shares |
|
|
|
|
|
|
|
ii. Other securities |
|
|
|
|
|
|
|
iii. Loans granted |
|
|
|
95623.20 |
22108.97 |
|
|
iv. Other short-term
financial assets |
|
|
|
|
|
|
|
b. In order entities |
|
|
|
|
|
|
|
i. Stocks or shares |
|
|
|
|
|
|
|
ii. Other securities |
|
|
|
|
|
|
|
iii. Loans granted |
|
|
|
|
|
|
|
iv. Other short-term
financial assets |
|
|
|
|
|
|
|
c. Cash and cash equivalents |
23492947.98 |
5799328.48 |
5563149.50 |
3227541.07 |
762765.10 |
762035.33 |
|
i. Cash on hand and in
bank |
2029538.14 |
3610661.03 |
4441235.11 |
1804060.79 |
760488.46 |
712035.33 |
|
ii. Other cash |
21463409.84 |
2188667.45 |
1121914.39 |
1423480.28 |
2276.64 |
|
|
iii. Other cash |
|
|
|
|
|
50000.00 |
|
Other short-term
investments |
|
|
|
|
|
|
|
IV. Short-term accruals |
79772.77 |
33249.56 |
378935.12 |
83987.25 |
53258.39 |
46951.40 |
|
Total assets |
45486967.20 |
34660018.95 |
33662477.24 |
30250955.66 |
11467539.72 |
15236667.98 |
|
Equity |
12469614.88 |
10258673.42 |
7008422.06 |
4724245.61 |
4233317.69 |
2934382.93 |
|
I. Share capital |
1550000.00 |
1550000.00 |
1550000.00 |
1550000.00 |
1550000.00 |
1550000.00 |
|
II. Outstanding share
capital contributions |
|
|
|
-27301.33 |
-27301.33 |
-27301.33 |
|
III. Own shares |
|
|
|
|
|
|
|
IV. Supplementary capital |
8708673.42 |
5458422.06 |
3201546.94 |
2710619.02 |
1411684.26 |
1218468.51 |
|
V. Revaluation reserve |
|
|
|
|
|
|
|
VI. Other reserve capital |
|
|
|
|
|
|
|
VII. Retained earnings
(losses) |
|
|
|
|
72835.00 |
|
|
VIII. Profit (loss) after
taxation |
2210941.46 |
3250251.36 |
2256875.12 |
490927.92 |
1226099.76 |
193215.75 |
|
IX. Appropriation of the
financial year net result |
|
|
|
|
|
|
|
Liabilities and provisions
for liabilities |
33017352.32 |
24401345.53 |
26654055.18 |
25526710.05 |
7234222.03 |
12302285.05 |
|
I. Provisions for
liabilities |
589019.00 |
642270.00 |
752589.45 |
1067016.70 |
151865.66 |
|
|
Deferred income tax
provision |
589019.00 |
591278.00 |
386540.00 |
979833.00 |
109107.00 |
|
|
Provision for pension
benefits and similar |
|
|
|
|
|
|
|
a. Long-term |
|
|
|
|
|
|
|
b. Short-term |
|
|
|
|
|
|
|
Other provisions |
|
50992.00 |
366049.45 |
87183.70 |
42758.66 |
|
|
a. Long-term |
|
|
|
|
|
|
|
b. Short-term |
|
50992.00 |
366049.45 |
87183.70 |
42758.66 |
|
|
II. Long-term liabilities |
|
|
|
|
|
|
|
With related entities |
|
|
|
|
|
|
|
With other entities |
|
|
|
|
|
|
|
a. Loans and credits |
|
|
|
|
|
|
|
b. Debt securities |
|
|
|
|
|
|
|
c. Other financial
liabilities |
|
|
|
|
|
|
|
d. Other |
|
|
|
|
|
|
|
III. Short-term
liabilities |
32428333.32 |
23759075.53 |
25665503.90 |
23358132.73 |
7015669.49 |
10986712.01 |
|
With related entities |
|
492586.34 |
8843585.92 |
7716989.36 |
1601521.32 |
953047.35 |
|
a. Trade loans and credits
with due date |
|
492586.34 |
8843585.92 |
7716989.36 |
1601521.32 |
953047.35 |
|
i. Up to 12 months |
|
492586.34 |
8843585.92 |
7716989.36 |
1601521.32 |
953047.35 |
|
ii. Over 12 months |
|
|
|
|
|
|
|
b. Other |
|
|
|
|
|
|
|
With other entities |
32428333.32 |
23266489.19 |
16821917.98 |
15641143.37 |
5414148.17 |
10033664.66 |
|
a. Loans and credits |
16784018.49 |
7847783.30 |
7230553.90 |
10975671.36 |
3119655.95 |
964195.08 |
|
b. Debt securities |
|
|
|
|
|
|
|
c. Other financial
liabilities |
|
|
|
|
|
|
|
In respect of trade with
the due date |
13306225.17 |
11778404.61 |
8293772.76 |
3572748.23 |
2275926.06 |
6095998.97 |
|
i. Up to 12 months |
13306225.17 |
11778404.61 |
8293772.76 |
3572748.23 |
2275926.06 |
6095998.97 |
|
ii. Over 12 months |
|
|
|
|
|
|
|
e. Advance payments
received for inventory |
816337.98 |
1854177.21 |
344626.15 |
|
|
152307.37 |
|
f. Promissory note
liabilities |
|
|
|
|
|
|
|
g. In respect of taxes,
customs duties, social insurance and other benefits |
1521529.48 |
1785392.58 |
949636.15 |
1089394.76 |
11202.56 |
2724652.18 |
|
h. In respect of salaries |
|
|
3329.02 |
3329.02 |
5045.60 |
3458.43 |
|
i. Other |
222.20 |
731.49 |
|
|
2318.00 |
93052.63 |
|
Special funds |
|
|
|
|
|
|
|
a. Company Social Fund |
|
|
|
|
|
|
|
b. Company rehabilitation
fund for the disabled |
|
|
|
|
|
|
|
c. Other |
|
|
|
|
|
|
|
IV. Accruals |
|
|
235961.83 |
1101560.62 |
66686.88 |
1315573.04 |
|
Negative goodwill |
|
|
|
|
|
|
|
Other prepayments |
|
|
235961.83 |
1101560.62 |
66686.88 |
1315573.04 |
|
a. Long-term |
|
|
|
|
|
|
|
b. Short-term |
|
|
235961.83 |
1101560.62 |
66686.88 |
1315573.04 |
|
Total liabilities |
45486967.20 |
34660018.95 |
33662477.24 |
30250955.66 |
11467539.72 |
15236667.98 |
|
PROFIT & LOSS ACCOUNT
(COMPARATIVE SCENARIO) |
||||||
|
|
||||||
|
Net revenue on sales and
equivalents, including |
87559432.93 |
119709152.32 |
79276862.76 |
78067278.40 |
55864197.70 |
53806871.44 |
|
from related entities |
|
3719862.85 |
582988.73 |
5316584.25 |
314650.38 |
|
|
I. Net revenue on products
sold |
35830.00 |
1500.00 |
|
13173.49 |
46109.32 |
2924.45 |
|
II. Change in product
stock position |
|
|
|
|
|
|
|
III. Cost of production of
goods for company's own needs |
|
|
|
|
|
|
|
IV. Net revenues on
merchandise and raw materials sold |
87523602.93 |
119707652.32 |
79276862.76 |
78054104.91 |
55818088.38 |
53803946.99 |
|
Operating expenses |
84537806.70 |
114488286.60 |
76950802.13 |
72947090.09 |
53728152.55 |
52614582.46 |
|
I. Depreciation |
41300.24 |
22217.65 |
20582.50 |
21250.92 |
13996.06 |
30064.83 |
|
II. Consumption of
materials and energy |
99433.13 |
87432.53 |
70699.87 |
60972.83 |
34580.21 |
58631.95 |
|
III. Third party services |
3614998.83 |
5967545.29 |
1744896.68 |
1339890.64 |
830721.76 |
1749886.47 |
|
IV. Taxes and charges
including: |
9404.63 |
33447.63 |
15480.64 |
8474.46 |
52387.10 |
85533.34 |
|
excise tax |
|
|
|
|
|
|
|
V. Salaries |
515633.64 |
459328.45 |
426084.52 |
442140.47 |
363490.00 |
301033.14 |
|
VI. Social security and
other benefits |
107266.04 |
80036.79 |
76595.49 |
77553.95 |
73622.51 |
56406.02 |
|
VII. Other costs by
category |
228662.42 |
487953.94 |
262277.99 |
228687.95 |
242905.78 |
370461.73 |
|
VIII. Value of merchandise
and raw materials sold |
79921107.77 |
107350324.32 |
74334184.44 |
70768118.87 |
52116449.13 |
49962564.98 |
|
Profit (loss) on sales
(A-B) |
3021626.23 |
5220865.72 |
2326060.63 |
5120188.31 |
2136045.15 |
1192288.98 |
|
D. Other operating revenue |
2539041.21 |
778485.91 |
673447.61 |
577752.44 |
944044.62 |
25470.06 |
|
I. Profit on non-financial
fixed assets sold |
4628.11 |
|
|
|
|
|
|
II. Grants |
|
|
|
|
|
|
|
III. Other operating
revenue |
2534413.10 |
778485.91 |
673447.61 |
577752.44 |
944044.62 |
25470.06 |
|
Other operating costs |
544400.37 |
234062.16 |
2134625.77 |
429348.93 |
612664.85 |
976120.70 |
|
I. Loss on non-financial
fixed assets sold |
|
422.29 |
|
|
|
|
|
II. Revaluation of
non-financial assets |
286651.40 |
10683.89 |
577642.04 |
104835.69 |
179421.70 |
280282.45 |
|
III. Other operating
expenses |
257748.97 |
222955.98 |
1556983.73 |
324513.24 |
433243.15 |
695838.25 |
|
F. Operating profit (loss)
(C+D-E) |
5016267.07 |
5765289.47 |
864882.47 |
5268591.82 |
2467424.92 |
241638.34 |
|
G. Financial revenue |
579643.61 |
1600957.76 |
3366543.82 |
1535645.64 |
115237.84 |
320074.94 |
|
I. Dividends and share in
profits including |
|
|
|
|
|
|
|
from related entities |
|
|
|
|
|
|
|
II. Interest including |
411145.40 |
1192397.28 |
37853.05 |
1095421.87 |
113360.41 |
28383.71 |
|
from related entities |
4591.69 |
1003941.83 |
|
119016.90 |
80287.62 |
|
|
III. Profit on investments
sold |
|
|
|
|
|
|
|
IV. Revaluation of
investment value |
|
|
|
|
|
|
|
V. Other |
168498.21 |
408560.48 |
3328690.77 |
440223.77 |
1877.43 |
291691.23 |
|
H. Financial expenses |
3109799.22 |
3292685.87 |
1558499.17 |
6187140.54 |
1068828.00 |
113097.53 |
|
I. Interest including |
228895.86 |
1885026.38 |
114627.35 |
372995.81 |
254979.02 |
34267.93 |
|
for related entities |
|
|
|
|
|
|
|
II. Loss on investments
sold |
|
|
|
|
|
|
|
III. Revaluation of
investment value |
|
|
|
|
|
|
|
IV. Other |
2880903.36 |
1407659.49 |
1443871.82 |
5814144.73 |
813848.98 |
78829.60 |
|
I. Profit (loss) on
ordinary activities (F+G-H) |
2486111.46 |
4073561.36 |
2672927.12 |
617096.92 |
1513834.76 |
448615.75 |
|
J. Extraordinary losses
and gains (J.I.-J.II) |
|
|
|
|
|
|
|
I. Extraordinary gains |
|
|
|
|
|
|
|
II. Extraordinary losses |
|
|
|
|
|
|
|
K. Gross profit (loss)
(I-+J) |
2486111.46 |
4073561.36 |
2672927.12 |
617096.92 |
1513834.76 |
448615.75 |
|
L. Income tax |
275170.00 |
823310.00 |
416052.00 |
126169.00 |
287735.00 |
255400.00 |
|
M. Other obligatory
charges |
|
|
|
|
|
|
|
N. Net profit (loss)
(K-L-M) |
2210941.46 |
3250251.36 |
2256875.12 |
490927.92 |
1226099.76 |
193215.75 |
RATIO BASED ANALYSIS
TABLE OF RESULTS OF THE
PROFIT & LOSS ACCOUI
|
|
2011 |
2010 |
2009 |
2008 |
2007 |
2006 |
|
|
|
|
|
|
|
|
|
Operating expenses |
-26.16 |
48.78 |
|
|
2.12 |
|
|
Salaries |
12.26 |
7.80 |
|
|
20.75 |
|
|
Profit (loss) on sales |
-42.12 |
124.45 |
|
|
79.15 |
|
|
Other operating revenues |
226.15 |
15.60 |
|
|
3606.49 |
|
|
Other operating expenses |
132.59 |
-89.03 |
|
|
-37.23 |
|
|
Operating profit (loss) |
-12.99 |
566.60 |
|
|
921.12 |
|
|
Financial revenues |
-63.79 |
-52.45 |
|
|
-64.00 |
|
|
Financial expenses |
-5.55 |
111.27 |
|
|
845.05 |
|
|
Profit (loss) on ordinary
activities |
-38.97 |
52.40 |
|
|
237.45 |
|
|
Extraordinary losses and
gains |
|
|
|
|
|
|
|
Gross profit |
-38.97 |
52.40 |
|
|
237.45 |
|
|
Income tax |
-66.58 |
97.89 |
|
|
12.66 |
|
|
BALANCE -SHEET STRUCTURE |
|||||||
|
|
2011 |
2010 |
2009 |
2008 |
2007 |
2006 |
2005 |
|
Share of fixed assets |
1.44 |
3.43 |
3.87 |
7.46 |
6.99 |
0.22 |
0.33 |
|
Share of current assets |
98.56 |
96.57 |
96.13 |
92.54 |
93.01 |
99.78 |
99.67 |
FINANCIAL LIQUIDITY
Algorithms which are applied in the liquidity analysis look
as follows:
Current ratio = Current assets
Short-term
liabilities
Quick ratio = Short-term
receivables + Short-term investments
Short-term
liabilities
Cash ratio = Short-term
investments
Short-term
liabilities
2011 2010 2009 2008
2007 2006
2005
Current ratio 1.382 1.409 1.261
1.198 1.520
1.384 1.381
Quick ratio 1.156 1.155 0.837 0.960 0.832
0.602 0.868
Cash ratio 0.724
0.244 0.217
0.142 0.112 0.069 0.120
|
|
2011 |
2010 |
2009 |
2008 |
2007 |
2006 |
2005 |
|
Receivables turnover in
times |
6.25 |
5.53 |
4.98 |
4.09 |
11.06 |
9.20 |
4.89 |
|
Receivables turnover in
days |
58.55 |
65.99 |
73.25 |
111.31 |
33.00 |
39.66 |
80.90 |
|
Liabilities turnover in
times |
2.70 |
5.04 |
3.09 |
3.34 |
7.96 |
4.90 |
3.66 |
|
Liabilities turnover in
days |
135.55 |
72.44 |
118.17 |
136.14 |
45.84 |
74.53 |
108.12 |
|
Inventory turnover in
times |
12.08 |
19.97 |
7.54 |
14.22 |
11.70 |
6.29 |
7.18 |
|
Inventory turnover in days |
30.30 |
18.27 |
48.37 |
31.99 |
31.21 |
57.99 |
55.17 |
|
Cash conversion cycle |
-46.69 |
11.83 |
3.46 |
7.16 |
18.37 |
23.12 |
27.95 |
Algorithms which are applied in the management efficiency analysis look
as follows:
Receivables turnover in times = Revenue
on sales
Short-term
receivables
Liabilities turnover in times = Revenue
on sales
Short-term
liabilities
Inventory turnover in times = Revenue
on sales
Inventory
Receivables turnover in days = Short-term
receivables x 365
Revenue on sales
Liabilities turnover in days = Short-term
liabilities x 365
Revenue on sales
Inventory turnover in days = Inventory x 365
Revenue on sales
Cash conversion cycle [in days]:
receivables turnover + inventory turnover - liabilities turnover
PROFITABILITY ANALYSIS
|
|
2011 |
2010 |
2009 |
2008 |
2007 |
2006 |
2005 |
|
roi |
0.049 |
0.094 |
0.067 |
0.016 |
0.107 |
0.013 |
0.113 |
|
roe |
0.177 |
0.317 |
0.322 |
0.104 |
0.290 |
0.066 |
0.445 |
|
Profitability of revenues |
0.025 |
0.027 |
0.028 |
0.006 |
0.022 |
0.004 |
0.043 |

Algorithms which are applied in the management efficiency analysis
looked as follows:
ROI = Net profit
Assets in total
ROE = Net profit
Equity
Sales profitability = Net
profit
Revenue on sales
DEBT LEVEL ANALYSISDEBT LVEL
ANALYSIS
This ratio is calculated according to the following
algorithms:
Assets coverage = Total
Assets
Equity
General debt ratios = Short-term
liabilities + liabilities
Equity
This ratio data provides information on who is financing the company to a
larger extent, the owner (equity) or external capital lenders (banks, suppliers
selling against trade credit)
Coverage of fixed assets = Equity
Fixed assets

|
|
2011 |
2010 |
2009 |
2008 |
2007 |
2006 |
2005 |
|
Assets coverage |
3.65 |
3.38 |
4.80 |
6.40 |
2.71 |
5.19 |
3.95 |
|
General debt ratios |
2.60 |
2.32 |
3.66 |
4.94 |
1.66 |
3.74 |
2.85 |
|
Coverage of fixed assets |
19.00 |
8.62 |
5.38 |
2.09 |
5.28 |
88.64 |
77.64 |
PRODUCTIVITY ANALYSIS
PRODUCTIVITY ANALYSIS
The last group of coefficients are the ratios representing
productivity of assets and fixed assets. The algorithms of those ratios look as
follows:
Assets productivity = Revenue
on sales
Assets
in total
Productivity of fixed assets = Revenue on sales
Fixed
assets
|
|
2011 |
2010 |
2009 |
2008 |
2007 |
2006 |
2005 |
|
Assets productivity |
1.92 |
3.45 |
2.36 |
2.58 |
4.87 |
3.53 |
2.64 |
|
Productivity of fixed assets |
133.40 |
100.61 |
60.82 |
34.59 |
69.70 |
1625.32 |
810.42 |
ASSESSMENT OF BANKRUPTCY
PROBABILITY
Ratio Sensitivity
Critical
value
|
receivables turnover in days |
82.80 |
104.59 |
|
cash conversion cycle |
89.10 |
-100.48 |
|
liabilities turnover in days |
89.50 |
214.05 |
|
coverage of fixed assets |
91.70 |
-0.12 |
|
working capital |
91.80 |
-63.60 |
|
sales profitability |
91.90 |
-0.15 |
|
ROI |
91.90 |
-0.22 |
|
ROE |
92.90 |
-0.21 |
|
|
||
|
Ratio |
Critical value [2011] |
|
|
receivables turnover in days |
58.55 |
|
|
cash conversion cycle |
-46.69 |
|
|
liabilities turnover in days |
135.55 |
|
|
coverage of fixed assets |
19.00 |
|
|
working capital |
27.27 |
|
|
sales profitability |
0.03 |
|
|
ROI |
0.05 |
|
|
ROE |
0.18 |
|
|
This comparison indicates that there are no
direct conditions which may be interpreted as a threat of the company
bankruptcy |
||
ADDITIONAL INFORMATION
|
Type of info |
Details |
|
Manufactured Product |
Duvet covers |
|
Manufactured Product |
Flat sheets |
|
Manufactured Product |
Fitted sheets |
|
Manufactured Product |
Sheet sets |
|
Manufactured Product |
Pillow cases |
|
Manufactured Product |
Shams |
|
Manufactured Product |
Bed skirts |
|
Manufactured Product |
Valances |
|
Manufactured Product |
Bolsters |
|
Manufactured Product |
Cushion covers |
|
Manufactured Product |
Napkins |
|
Manufactured Product |
Place mats |
|
Manufactured Product |
Runners |
FOREIGN EXCHANGE RATES
|
Currency |
Unit
|
Indian Rupees |
|
US Dollar |
1 |
Rs.62.56 |
|
|
1 |
Rs.100.77 |
|
Euro |
1 |
Rs.84.71 |
INFORMATION DETAILS
|
Report
Prepared by : |
NIS |
RATING EXPLANATIONS
|
RATING |
STATUS |
PROPOSED CREDIT LINE |
|
|
>86 |
Aaa |
Possesses an extremely sound financial base with the strongest capability
for timely payment of interest and principal sums |
Unlimited |
|
71-85 |
Aa |
Possesses adequate working capital. No caution needed for credit
transaction. It has above average (strong) capability for payment of interest
and principal sums |
Large |
|
56-70 |
A |
Financial & operational base are regarded healthy. General
unfavourable factors will not cause fatal effect. Satisfactory capability for
payment of interest and principal sums |
Fairly Large |
|
41-55 |
Ba |
Overall operation
is considered normal. Capable to meet normal commitments. |
Satisfactory |
|
26-40 |
B |
Capability to overcome financial difficulties seems comparatively
below average. |
Small |
|
11-25 |
Ca |
Adverse factors are apparent. Repayment of interest and principal sums
in default or expected to be in default upon maturity |
Limited with
full security |
|
<10 |
C |
Absolute credit risk exists. Caution needed to be exercised |
Credit not
recommended |
|
-- |
NB |
New Business |
-- |
This score serves as a reference to assess SC’s credit risk
and to set the amount of credit to be extended. It is calculated from a
composite of weighted scores obtained from each of the major sections of this report.
The assessed factors and their relative weights (as indicated through %) are as
follows:
Financial
condition (40%) Ownership
background (20%) Payment
record (10%)
Credit history
(10%) Market trend
(10%) Operational
size (10%)
This report is issued at your request without any
risk and responsibility on the part of MIRA INFORM PRIVATE LIMITED (MIPL)
or its officials.