MIRA
INFORM REPORT
|
Report Date : |
26.11.2013 |
IDENTIFICATION DETAILS
|
Name : |
CALVO CONSERVAS SL |
|
|
|
|
Registered Office : |
Carretera Coruña - Finisterre Km. 34,5 - Carballo - 15106 - La Coruña |
|
|
|
|
Country : |
Spain |
|
|
|
|
Financials (as on) : |
2012 |
|
|
|
|
Date of Incorporation : |
1997 |
|
|
|
|
Legal Form : |
Private Limited Company |
|
|
|
|
Line of Business : |
Subject is engaged in the manufacture and sale of preserved fish and
other prepared food products (mussels, sardines, tuna, salads etc). It uses
the commercial name Calvo. It belongs to the corporate group of the same name
with headquarters in the heading address. |
|
|
|
|
No. of Employees : |
250 |
RATING & COMMENTS
|
MIRA’s Rating : |
Ba |
|
RATING |
STATUS |
PROPOSED CREDIT LINE |
|
|
41-55 |
Ba |
Overall operation is considered normal. Capable to meet normal
commitments. |
Satisfactory |
|
Status : |
Satisfactory |
|
Payment Behaviour : |
Regular |
|
Litigation : |
Clear |
NOTES:
Any query related to this report can be made
on e-mail: infodept@mirainform.com
while quoting report number, name and date.
ECGC Country Risk Classification List – March, 31st, 2013
|
Country Name |
Previous Rating (31.12.2012) |
Current Rating (31.03.2013) |
|
Spain |
A2 |
A2 |
|
Risk Category |
ECGC
Classification |
|
Insignificant |
A1 |
|
Low |
A2 |
|
Moderate |
B1 |
|
High |
B2 |
|
Very High |
C1 |
|
Restricted |
C2 |
|
Off-credit |
D |
spain - ECONOMIC OVERVIEW
After almost 15 years of above average GDP growth, the
Spanish economy began to slow in late 2007 and entered into a recession in the second
quarter of 2008. GDP contracted by 3.7% in 2009, ending a 16-year growth trend,
and by another 0.3% in 2010; GDP expanded 0.4% in 2011, before contracting 1.4%
in 2012. The economy has once again fallen into recession as deleveraging in
the private sector, fiscal consolidation, and continued high unemployment weigh
on domestic demand and investment, even as exports have shown signs of
resiliency. The unemployment rate rose from a low of about 8% in 2007 to 26.0%
in 2012. The economic downturn has also hurt Spain's public finances. The
government budget deficit peaked at 11.2% of GDP in 2010 and the process to
reduce this imbalance has been slow despite the central government's efforts to
raise new tax revenue and cut spending. Spain reduced its budget deficit to
9.4% of GDP in 2011, and roughly 7.4% of GDP in 2012, above the 6.3% target
negotiated between Spain and the EU. Although Spain''s large budget deficit and
poor economic growth prospects remain a source of concern for foreign
investors, the government''s ongoing efforts to cut spending and introduce
flexibility into the labor markets are intended to assuage these concerns. The
government is also taking steps to shore up the banking system, namely by using
up to $130 billion in EU funds to recapitalize struggling banks exposed to the
collapsed domestic construction and real estate sectors.
|
Source
: CIA |
EXECUTIVE SUMMARY
|
Name: |
CALVO CONSERVAS SL |
|
NIF / Fiscal code: |
B15584642 |
|
Trade Name |
CALVO |
|
Status: |
ACTIVE WITH PARTIAL DIVISION OF CAPITAL |
|
Incorporation Date: |
01/01/1997 |
|
Register Data |
Register Section 8 Sheet 17332 |
|
Last Publication in BORME: |
18/09/2013 [Reelections] |
|
Last Published Account Deposit: |
2012 |
|
Share Capital: |
4.865.954,43 |
|
|
|
|
Localization: |
CARRETERA CORUÑA - FINISTERRE KM. 34,5 - CARBALLO - 15106 - LA CORUÑA |
|
Telephone - Fax - Email - Website: |
Ph.:. 981704794 Website. www.grupocalvo.com |
|
|
|
|
Activity: |
|
|
NACE: |
1022 - Preserving of fish |
|
Registered Trademarks: |
|
|
Audited / Opinion: |
Si / |
|
Tenders and Awards: |
0 for a total cost of 0 |
|
Subsidies: |
6 for a total cost of 16316987 |
|
Quality Certificate: |
No |
|
|
|
|
|
|
|
Defaults, Legal Claims and Insolvency Proceedings
: |
|
|
|
|
|
|
|
Number |
Amount (€) |
Most Recent Entry |
|
Insolvency Proceedings, Bankruptcy and Suspension of Payments |
|
Unpublished |
--- |
--- |
|
Defaults on debt with Financial Institutions and Large Companies |
|
None |
--- |
--- |
|
Judicial Claims (Notices, Executive Proceedings, Attachments,
Auctions, Bad Debt) |
|
None |
0 |
--- |
|
Proceedings heard by the Civil Court |
|
Unpublished |
0 |
--- |
|
Proceedings heard by the Labour Court |
|
Unpublished |
0 |
--- |
|
|
|
Partners: |
|
|
|
LUIS CALVO SANZ SA |
100 % |
|
|
Shares: |
0 |
|
|
Other Links: |
5 |
|
|
No. of Active Corporate Bodies: |
CHIEF EXECUTIVE OFFICER 1 |
|
|
Ratios |
2012 |
2011 |
Change |
|
|
|
|
|
Guarantees: |
|
|
Properties Registered: |
Company NO, Administrator NO |
|
Financing / Guarantee Sources : |
Sources YES, Guarantees YES |
|
|
|
|
|
|
|
INVESTIGATION SUMMARY |
|
|
The company was incorporated in Coruña in 1997. It is engaged in the
manufacture and sale of preserved fish and other prepared food products. Its
incomes have been increased by 27% during 2012, however this commercial
effort has reduced margins significantly, as it has not been possible to
transfer to the market the significant increase experienced by the main raw
material (tuna) It has a very good scope for action, so that the guarantees
of its current creditors are well covered and therefore the company can
comply with its short-term payment obligations. It has an optimum level of
debt, plus the favorable relation between its fixed assets and external
funding that allows the company to comply with its payment obligations. |
|
Enquiry Details
|
Identification |
|
|
Social Denomination: |
CALVO CONSERVAS SL |
|
Trade Name: |
CALVO |
|
NIF / Fiscal code: |
B15584642 |
|
Corporate Status: |
ACTIVE WITH PARTIAL DIVISION OF CAPITAL |
|
Start of activity: |
1997 |
|
Registered Office: |
CARRETERA CORUÑA - FINISTERRE KM. 34,5 |
|
Locality: |
CARBALLO |
|
Province: |
LA CORUÑA |
|
Postal Code: |
15106 |
|
Telephone: |
981704794 |
|
Fax: |
981704008 |
|
Website: |
|
Activity
|
NACE: |
1022 |
|
Additional Information: |
It is engaged in the manufacture and sale of preserved fish and other
prepared food products (mussels, sardines, tuna, salads etc). It uses the
commercial name Calvo. It belongs to the corporate group of the same name
with headquarters in the heading address. |
|
Additional Address: |
Ctra. Coruña - Finisterre; km. 34,5, 15106 Carballo (La Coruña),
registered office, administrative offices, factory, warehouse and other
premises, believed to be owned by the subject. |
|
Import / export: |
IMPORTS / EXPORTS |
|
Future Perspective: |
Consolidation |
|
Industry situation: |
Maturity |
Number of
Employees
|
|
Year |
No. of employees |
Established |
Incidentals |
|
|
|
2013 |
250 |
|
|
|
Chronological Summary
|
|
Year |
Act |
|
|
|
1997 |
Appointments/ Re-elections (2) Company Formation (1) Other Concepts/
Events (1) |
|
|
|
1999 |
Accounts deposit (ejer. 1997, 1998) Appointments/ Re-elections (1)
Company Transformation (1) Increase of Capital (1) Statutory Modifications
(1) |
|
|
|
2000 |
Accounts deposit (ejer. 1999) Appointments/ Re-elections (2) Capital
Reduction (2) Partial split (5) Statutory Modifications (1) |
|
|
|
2001 |
Accounts deposit (ejer. 2000) Increase of Capital (1) Statutory
Modifications (1) |
|
|
|
2002 |
Accounts deposit (ejer. 2001) Appointments/ Re-elections (1)
Cessations/ Resignations/ Reversals (1) |
|
|
|
2003 |
Accounts deposit (ejer. 2002) Appointments/ Re-elections (3)
Cessations/ Resignations/ Reversals (1) Increase of Capital (1) Statutory
Modifications (1) Take-over Merger (5) |
|
|
|
2004 |
Accounts deposit (ejer. 2003) Appointments/ Re-elections (1) |
|
|
|
2005 |
Accounts deposit (ejer. 2004) Appointments/ Re-elections (1) |
|
|
|
2006 |
Accounts deposit (ejer. 2005) Appointments/ Re-elections (1) |
|
|
|
2007 |
Accounts deposit (ejer. 2006) Appointments/ Re-elections (1)
Cessations/ Resignations/ Reversals (2) |
|
|
|
2008 |
Accounts deposit (ejer. 2007) Appointments/ Re-elections (4)
Cessations/ Resignations/ Reversals (2) |
|
|
|
2009 |
Accounts deposit (ejer. 2008) Appointments/ Re-elections (1) |
|
|
|
2010 |
Accounts deposit (ejer. 2009) Appointments/ Re-elections (1) |
|
|
|
2011 |
Accounts deposit (ejer. 2010) Appointments/ Re-elections (3) Change of
Social Purpose (1) Statutory Modifications (1) |
|
|
|
2012 |
Accounts deposit (ejer. 2011) Appointments/ Re-elections (3)
Cessations/ Resignations/ Reversals (2) Other Concepts/ Events (1) |
|
|
|
2013 |
Accounts deposit (ejer. 2012) Appointments/ Re-elections (3)
Cessations/ Resignations/ Reversals (1) |
|
Main Historic Changes
|
Concept |
Publication |
Act |
Date |
|
Corporate Purpose Changes: |
FABRICACION, ENVASADO Y CONSERVACION DE TODA CLASE DE SEMICONSERVAS Y
CONSERVAS. |
Company Formation |
05/03/1997 |
Breakdown of Owners' Equity
|
Registered Capital: |
4.865.954,43 |
|
Paid up capital: |
4.865.954,43 |
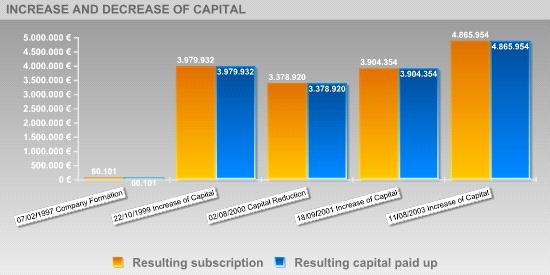
Updated Evolution of the
Subscribed and Paid-in Capital
|
|
|
|
|
|
|
|
|
|||||
|
|
|
|
|
|
|
|
Publishing Date |
Registration Type |
Capital Subscribed |
Paid up capital |
Underwritten result |
Disbursed Result |
|
07/02/1997 |
Company Formation |
60.101 |
60.101 |
60.101 |
60.101 |
|
22/10/1999 |
Increase of Capital |
3.919.831 |
3.919.831 |
3.979.932 |
3.979.932 |
|
02/08/2000 |
Capital Reduction |
-601.012 |
-601.012 |
3.378.920 |
3.378.920 |
|
18/09/2001 |
Increase of Capital |
525.502 |
525.502 |
3.904.354 |
3.904.354 |
|
11/08/2003 |
Increase of Capital |
961.600 |
961.600 |
4.865.954 |
4.865.954 |
Active Social Bodies
|
Post published |
Social Body's Name |
Appointment Date |
Other Positions in this Company |
|
SINGLE PARTNER |
LUIS CALVO SANZ SA |
07/02/1997 |
3 |
|
PRESIDENT |
CALVO PUMPIDO MARIA DOLORES |
20/10/1999 |
6 |
|
PARTNER |
LUIS CALVO SANZ SA |
07/02/1997 |
3 |
|
MEMBER OF THE BOARD |
CALVO GARCIA BENAVIDES MANUEL |
28/02/2007 |
2 |
|
|
CALVO PUMPIDO LUCIANO |
20/10/1999 |
4 |
|
|
CALVO PUMPIDO MARIA DOLORES |
20/10/1999 |
6 |
|
JOINT CHIEF EXECUTIVE OFFICER |
CALVO GARCIA BENAVIDES MANUEL |
28/02/2007 |
2 |
|
COMBINED PROXY |
LLANAS CARVAJAL DAVID |
13/05/2005 |
1 |
|
|
AÑON SEIJAS RICARDO |
13/05/2005 |
3 |
|
|
GARCIA MESURA RUBEN |
13/05/2005 |
3 |
|
|
MEDIAVILLA CANO EVA |
13/05/2005 |
2 |
|
|
CANO DE LA FUENTE JUANA |
13/05/2005 |
1 |
|
|
CANO DE LA FUENTE JUANITA |
13/11/2003 |
2 |
|
|
GARCIA TORRES MANUEL |
31/05/2000 |
1 |
|
PROXY |
SANCHEZ PLAZA CARLOS |
16/05/2013 |
1 |
|
|
PEÑALVA ARIGITA MIGUEL ANGEL |
16/05/2013 |
1 |
|
|
ORGE MIGUEZ ENRIQUE |
01/06/2012 |
1 |
|
|
AMADOR VELA-HIDALGO RAFAEL |
09/05/2011 |
1 |
|
|
OUTEIRO VILLAR JESUS |
15/03/2002 |
2 |
|
CHIEF EXECUTIVE OFFICER |
CALVO PUMPIDO LUCIANO |
20/10/1999 |
4 |
|
SECRETARY |
CASAS ROBLA JESUS |
20/10/1999 |
2 |
|
VICE SECRETARY |
CUBEDO SANCHEZ BELEN |
16/10/2012 |
1 |
|
ACCOUNTS' AUDITOR / HOLDER |
DELOITTE SL |
10/09/2013 |
7 |
Historical Social Bodies
|
Social Body's Name |
Post published |
End Date |
Other Positions in this Company |
|
AÑON SEIJAS RICARDO |
JOINT ATTORNEY/COMBINED PROXY |
13/11/2003 |
3 |
|
|
COMBINED PROXY |
13/05/2005 |
|
|
CALVO ARECHAVALETA JOSE RAMON |
JOINT ATTORNEY/COMBINED PROXY |
05/02/2007 |
1 |
|
CALVO GARCIA BENAVIDES MARTA MARIA |
JOINT ATTORNEY/COMBINED PROXY |
16/05/2013 |
1 |
|
CALVO PUMPIDO HERMINIA |
MEMBER OF THE BOARD |
07/11/2008 |
2 |
|
|
MEMBER OF THE BOARD |
20/10/1999 |
|
|
CALVO PUMPIDO JOSE LUIS |
MEMBER OF THE BOARD |
20/10/1999 |
4 |
|
|
MEMBER OF THE BOARD |
07/11/2008 |
|
|
|
CHIEF EXECUTIVE OFFICER |
20/10/1999 |
|
|
|
CHIEF EXECUTIVE OFFICER |
03/12/2003 |
|
|
CALVO PUMPIDO LUCIANO |
MEMBER OF THE BOARD |
20/10/1999 |
4 |
|
|
CHIEF EXECUTIVE OFFICER |
20/10/1999 |
|
|
CALVO PUMPIDO MANUEL |
MEMBER OF THE BOARD |
20/10/1999 |
4 |
|
|
MEMBER OF THE BOARD |
08/02/2008 |
|
|
|
CHIEF EXECUTIVE OFFICER |
20/10/1999 |
|
|
|
CHIEF EXECUTIVE OFFICER |
08/02/2008 |
|
|
CALVO PUMPIDO MARIA DOLORES |
MEMBER OF THE BOARD |
20/10/1999 |
6 |
|
|
CHIEF EXECUTIVE OFFICER |
20/10/1999 |
|
|
|
PRESIDENT |
20/10/1999 |
|
|
|
CHIEF EXECUTIVE OFFICER |
03/12/2003 |
|
|
CALVO PUMPIDO MARIA LUISA |
MEMBER OF THE BOARD |
07/02/1997 |
5 |
|
|
MEMBER OF THE BOARD |
20/10/1999 |
|
|
|
VICE CHAIRMAN |
20/10/1999 |
|
|
|
VICE CHAIRMAN |
07/11/2008 |
|
|
|
MEMBER OF THE BOARD |
07/11/2008 |
|
|
CANO DE LA FUENTE JUANITA |
COMBINED PROXY |
13/11/2003 |
2 |
|
CASAS ROBLA JESUS |
SECRETARY |
20/10/1999 |
2 |
|
DELOITTE & TOUCHE ESPAÑA SL |
ACCOUNTS' AUDITOR / HOLDER |
14/12/2006 |
1 |
|
DELOITTE S L |
ACCOUNTS' AUDITOR / HOLDER |
08/02/2008 |
1 |
|
DELOITTE SL |
ACCOUNTS' AUDITOR / HOLDER |
07/11/2008 |
7 |
|
|
ACCOUNTS' AUDITOR / HOLDER |
28/10/2009 |
|
|
|
ACCOUNTS' AUDITOR / HOLDER |
09/11/2010 |
|
|
|
ACCOUNTS' AUDITOR / HOLDER |
07/09/2011 |
|
|
|
ACCOUNTS' AUDITOR / HOLDER |
16/10/2012 |
|
|
|
ACCOUNTS' AUDITOR / HOLDER |
10/09/2013 |
|
|
GARCIA MESURA RUBEN |
COMBINED PROXY |
13/05/2005 |
3 |
|
|
COMBINED PROXY |
13/11/2003 |
|
|
JOVEN MARTINEZ JOAQUIN |
PROXY |
09/08/2007 |
1 |
|
LAZCOZ CISNEROS FRANCISCO JAVIER |
PROXY |
01/06/2012 |
1 |
|
LAZCOZ FRANCISCO JAVIER |
PROXY |
01/06/2012 |
1 |
|
LLANAS CARBAJAL DAVID |
JOINT ATTORNEY/COMBINED PROXY |
13/11/2003 |
2 |
|
|
COMBINED PROXY |
13/05/2005 |
|
|
LUIS CALVO SANZ SA |
PARTNER |
07/02/1997 |
3 |
|
MARCOS GARCIA EMILIO |
PROXY |
01/06/2012 |
1 |
|
MEDIAVILLA CANO EVA |
COMBINED PROXY |
13/05/2005 |
2 |
|
MENESES PONCIO JOSE JUAN |
JOINT ATTORNEY/COMBINED PROXY |
05/02/2007 |
1 |
|
MURGA TOME ALVARO |
JOINT ATTORNEY/COMBINED PROXY |
15/03/2002 |
1 |
|
OUTEIRO VILLAR JESUS |
JOINT ATTORNEY/COMBINED PROXY |
15/03/2002 |
2 |
|
PORTEIRO EIROA EZEQUIEL |
COMBINED PROXY |
13/05/2005 |
3 |
|
|
COMBINED PROXY |
23/01/2012 |
|
|
|
COMBINED PROXY |
13/11/2003 |
|
|
PRICE WATERHOUSE COOPERS AUDITORES SL |
ACCOUNTS' AUDITOR / HOLDER |
11/03/2004 |
2 |
|
|
ACCOUNTS' AUDITOR / HOLDER |
27/02/2003 |
|
|
SILVA ROMANI JOSE LUIS |
COMBINED PROXY |
11/08/2003 |
3 |
|
|
COMBINED PROXY |
05/02/2007 |
|
|
|
PROXY |
05/02/2007 |
|
Executive
board
|
Post |
NIF |
Name |
|
FINANCIAL DIRECTOR |
|
DAVID LLANAS CARVAJAL |
Defaults, Legal Claims and
Insolvency Proceedings
Section enabling assessment of the degree of compliance of the company
queried with its payment obligations. It provides information on the existence
and nature of all stages of Insolvency and Legal Proceedings published with
reference to the Company in the country's various Official Bulletins and
national newspapers, as well Defaults Registered in the main national credit
bureaus (ASNEF Industrial and RAI ).
> Summary
Chronological summary
|
|
|
Number of Publications |
Amount (_) |
Start date |
End date |
|
Insolvency Proceedings, Bankruptcy and Suspension of Payments |
|
Unpublished |
--- |
--- |
--- |
|
Request/Declaration |
|
0 |
--- |
date |
|
|
Proceedings |
|
--- |
--- |
|
--- |
|
Resolution |
|
--- |
--- |
|
--- |
|
Defaults on debt with Financial Institutions and Large Companies |
Bank and Commercial Delinquency |
None |
0 |
|
|
|
Status: Friendly |
|
--- |
|
|
|
|
Status: Pre-Litigation |
|
--- |
|
|
|
|
Status: Litigation |
|
--- |
|
|
|
|
Status: Non-performing |
|
--- |
|
|
|
|
Status: insolvency proceedings, bankruptcy and suspension of payments |
|
--- |
|
|
|
|
Other status |
|
--- |
|
|
|
|
Legal and Administrative Proceedings |
|
Unpublished |
--- |
|
|
|
Notices of defaults and enforcement |
|
--- |
--- |
|
--- |
|
Seizures |
|
--- |
--- |
|
--- |
|
Auctions |
|
--- |
--- |
|
--- |
|
Declarations of insolvency and bad debt |
|
--- |
--- |
|
--- |
|
Proceedings heard by the Civil Court |
|
Unpublished |
--- |
|
|
|
Proceedings heard by the Labour Court |
|
Unpublished |
--- |
|
|
> Details
> Basis for rating
|
Positive Factors |
Adverse Factors |
|
No judicial claims have been detected in the Official Gazettes,
regarding any Company's outstanding debts with the Tax Bureau or Social
Security administrations, as submitted by Courts of the various court
jurisdictions. It has been found to have regular payment performance and has paid all
of its debts in a timely manner. It is one of the major domestic companies in terms of sales volume. CALVO CONSERVAS SL's borrowing cost is appropriate according to its
volume of external financing sources. Positive Working Capital. The Company's Working Capital quality is
significant, i.e. much of the Company financing comes from its equity. A
structure is considered optimal if its liquidity level is slightly above its
debt volume as a result of low idleness levels of its financial resources
involved. |
Productivity decrease. The Company's salaried staff productivity has
decreased with respect to the previous fiscal year. This productivity
decrease is reflected in a decrease in its generated income, a fact that
might hinder the Company's financial situation. In fiscal year 2012 , total debts incurred with credit institutions
and trade creditors has increased with respect to the previous fiscal year.
The greater the level of indebtedness, the greater the Company's reliance on
capital suppliers and the more complicated its financial standing. Solvency decreaseThe company's capacity to bear the cost derived form
debts incurred with third parties has decreased significantly in its last
fiscal year. |
TREND
OF RATING
|
|
|
> Latest Rating Changes :
|
Rating |
Evolution |
Date |
Event |
|
|
|
05/11/13 |
Actualización de los estados financieros. |
|
|
14/02/13 |
Cambio de scoring realizado por un analista experto |
|
|
|
19/10/12 |
Actualización de los estados financieros. |
|
|
|
01/02/12 |
Actualización de información mercantil relevante. |
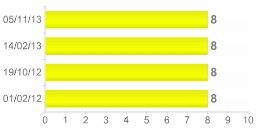
The information contained in the latest annual statements has led to a
Scoring review for the company.
Probability
of default
> Probabilidad Estimada de Impago para los próximos 12 meses:
2.2 %
> Latest Rating Changes :
|
Sector in which comparison is carried out : 102 Processing and preserving of fish, crustaceans and molluscs |
|
|
Relative Position:
|
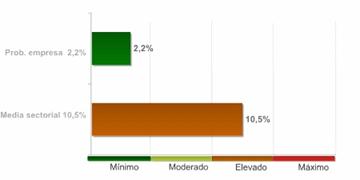
The company's comparative analysis with the rest of the companies that
comprise the sector, shows the company holds a better position with regard to
the probability of non-compliance.
The 91.00% of the companies of the sector CALVO CONSERVAS SL belongs to
show a higher probability of non-compliance.
The probability of the company's non-compliance with its payment
obligations within deadlines estimated by our qualifications models is 2.18%.
In the event they fail to comply with the payment, the seriousness of
the loss will depend on factors such as the promptness of the commencement of
the charging management, the existence of executive documents which match the
credit or the existence of guarantees and free debt assets under the name of
the debtor. Therefore, the probability of non-compliance should not be solely
interpreted as the total loss of the owed amount.
LEGAL
CLAIMS
|
Summary of Judicial Claims |
|
|
|
|
|
|
|
|
||
|
|
|
No se han publicado |
|
|
|
|
No se han publicado |
|
|
|
|
||
|
|
|
No se han publicado |
|
|
|
|
No se han publicado |
|
|
|
|
No se han publicado |
|
|
|
|
No se han publicado |
|
|
|
|
||
|
|
|
No se han publicado |
|
|
|
|
No se han publicado |
|
|
|
|
||
|
|
|
No se han publicado |
|
Guarantees
References
|
|
Clients |
|
|
|
Name |
NIF |
Telephone |
|
|
|
EL CORTE INGLES SA |
|
|
|
|
|
HIPERCOR SA |
|
|
|
|
|
ALCAMPO SA |
|
|
|
|
|
CENTRO COMERCIAL CARREFOUR SA |
|
|
|
Link List
|
ABSORBS TO: |
1 Entities |
|
IS RELATED WITH: |
2 Entities |
|
SE ESCINDE PARCIALMENTE EN: |
2 Entities |
|
SHAREHOLDERS: |
1 Entities |
> Shareholders
|
Relationship |
Entity |
Province |
Shareholding stake |
|
SHAREHOLDERS |
LUIS CALVO SANZ SA |
LA CORUÑA |
100 |
> Other relationships
|
Relationship |
Entity |
Province |
Shareholding stake |
|
IS RELATED WITH |
| | |
|
|
|
|
CALVO PESCA EL SALVADOR, SOCIEDAD ANONIMA, DE CV |
|
|
|
IS RELATED WITH |
CALVO ENVASES SL |
LA CORUÑA |
|
|
ABSORBS TO |
CALVO ENERGIA, SA |
LA CORUÑA |
|
|
SE ESCINDE PARCIALMENTE EN |
CALVO ENVASES, S.L. |
LA CORUÑA |
|
Turnover
|
Total Sales 2012 |
154.788.104 |
Financial Accounts and Balance
Sheets
Financial Years Presented
|
Ejercicio |
Tipo de Cuentas Anuales |
Fecha Presentacion |
|
2012 |
Normales |
November 2013 |
|
2011 |
Normales |
October 2012 |
|
2010 |
Normales |
September 2011 |
|
2009 |
Normales |
August 2010 |
|
2008 |
Normales |
October 2009 |
|
2007 |
Normales |
August 2008 |
|
2006 |
Normales |
September 2007 |
|
2005 |
Normales |
September 2006 |
|
2004 |
Normales |
July 2005 |
|
2003 |
Normales |
September 2004 |
|
2002 |
Normales |
August 2003 |
|
2001 |
Normales |
September 2002 |
|
2000 |
Normales |
October 2001 |
|
1999 |
Normales |
September 2000 |
|
1998 |
Normales |
November 1999 |
|
1997 |
Normales |
November 1999 |
The data in the report regarding the last Company Accounts submitted by
the company is taken from the TRADE REGISTER serving the region in which the
company's address is located 31/12/2012
> Balance en formato Normal de acuerdo al Nuevo Plan General
Contable 2007
Information corresponding to the fiscal year
2012 2011 2010 2009 2008 is taken from information
submitted to the TRADE REGISTER. Data corresponding to fiscal years before
2012 2011 2010 2009 2008 has been compiled based on
the equivalence criteria stipulated in Act JUS/206/2009. Where the provisions
of the Act did not establish relevant equivalence criteria
|
|
ORIGINAL |
ORIGINAL |
ORIGINAL |
ORIGINAL |
ORIGINAL |
|
|
Assets |
2012 |
2011 |
2010 |
2009 |
2008 |
|
|
A) NON-CURRENT ASSETS: 11000 |
6.582.141,00 |
6.644.608,00 |
6.723.712,00 |
5.479.083,00 |
4.939.383,00 |
|
|
I. Intangible fixed assets : 11100 |
422.909,00 |
469.188,00 |
381.616,00 |
258.699,00 |
0,00 |
|
|
1. Development: 11110 |
0,00 |
0,00 |
0,00 |
0,00 |
0,00 |
|
|
2. Concessions: 11120 |
0,00 |
0,00 |
0,00 |
0,00 |
0,00 |
|
|
3. Patents, licencing, trade
marks and similar: 11130 |
0,00 |
0,00 |
0,00 |
0,00 |
0,00 |
|
|
4. Goodwill: 11140 |
0,00 |
0,00 |
0,00 |
0,00 |
0,00 |
|
|
5. IT applications:
11150 |
422.909,00 |
469.188,00 |
381.616,00 |
258.699,00 |
0,00 |
|
|
6. Investigation:
11160 |
0,00 |
0,00 |
0,00 |
0,00 |
0,00 |
|
|
7. Other intangible fixed
assets: 11170 |
0,00 |
0,00 |
0,00 |
0,00 |
0,00 |
|
|
II. Tangible fixed assets : 11200 |
5.376.711,00 |
5.498.993,00 |
5.677.978,00 |
5.120.326,00 |
4.859.702,00 |
|
|
1. Land and buildings:
11210 |
3.311.415,00 |
3.429.235,00 |
3.519.643,00 |
2.846.687,00 |
2.968.432,00 |
|
|
2. Technical installations
and other tangible fixed assets: 11220 |
1.963.340,00 |
2.069.758,00 |
2.158.335,00 |
1.559.790,00 |
1.891.270,00 |
|
|
3. Tangible asset in
progress and advances: 11230 |
101.956,00 |
0,00 |
0,00 |
713.849,00 |
0,00 |
|
|
III. Real estate investment: 11300 |
0,00 |
0,00 |
0,00 |
0,00 |
0,00 |
|
|
1. Land: 11310 |
0,00 |
0,00 |
0,00 |
0,00 |
0,00 |
|
|
2. Buildings: 11320 |
0,00 |
0,00 |
0,00 |
0,00 |
0,00 |
|
|
IV. Long-term investments in Group companies and associates
: 11400 |
507.690,00 |
507.690,00 |
507.690,00 |
141,00 |
141,00 |
|
|
1. Equity instruments:
11410 |
141,00 |
141,00 |
141,00 |
141,00 |
141,00 |
|
|
2. Credits to businesses:
11420 |
507.549,00 |
507.549,00 |
507.549,00 |
0,00 |
0,00 |
|
|
3. Debt securities:
11430 |
0,00 |
0,00 |
0,00 |
0,00 |
0,00 |
|
|
4. Derivatives : 11440 |
0,00 |
0,00 |
0,00 |
0,00 |
0,00 |
|
|
5. Other financial assets :
11450 |
0,00 |
0,00 |
0,00 |
0,00 |
0,00 |
|
|
6. Other investments: 11460 |
0,00 |
0,00 |
0,00 |
0,00 |
0,00 |
|
|
V. Long-term financial investments: 11500 |
1.049,00 |
1.104,00 |
1.104,00 |
40,00 |
40,00 |
|
|
1. Equity instruments:
11510 |
1.049,00 |
1.104,00 |
1.104,00 |
40,00 |
40,00 |
|
|
2. Credits to third parties
: 11520 |
0,00 |
0,00 |
0,00 |
0,00 |
0,00 |
|
|
3. Debt securities:
11530 |
0,00 |
0,00 |
0,00 |
0,00 |
0,00 |
|
|
4. Derivatives : 11540 |
0,00 |
0,00 |
0,00 |
0,00 |
0,00 |
|
|
5. Other financial assets :
11550 |
0,00 |
0,00 |
0,00 |
0,00 |
0,00 |
|
|
6. Other investments:
11560 |
0,00 |
0,00 |
0,00 |
0,00 |
0,00 |
|
|
VI. Assets for deferred tax : 11600 |
273.782,00 |
167.633,00 |
155.324,00 |
99.877,00 |
79.500,00 |
|
|
VII. Non-current trade debts : 11700 |
0,00 |
0,00 |
0,00 |
0,00 |
0,00 |
|
|
B) CURRENT ASSETS: 12000 |
30.172.560,00 |
31.430.133,00 |
35.528.767,00 |
32.793.593,00 |
30.653.764,00 |
|
|
I. Non-current assets held for sale : 12100 |
294.780,00 |
200,00 |
168.349,00 |
401.898,00 |
719.439,00 |
|
|
II. Stocks: 12200 |
18.311.583,00 |
10.151.064,00 |
15.057.067,00 |
10.878.393,00 |
23.326.452,00 |
|
|
1. Commercial: 12210 |
0,00 |
0,00 |
0,00 |
0,00 |
0,00 |
|
|
2. Primary material and
other supplies: 12220 |
17.648.142,00 |
9.919.571,00 |
13.075.129,00 |
10.412.626,00 |
23.014.041,00 |
|
|
3. Work in progress:
12230 |
0,00 |
0,00 |
0,00 |
0,00 |
0,00 |
|
|
a) Of
long-term production cycle : 12231 |
0,00 |
0,00 |
0,00 |
0,00 |
0,00 |
|
|
b) Of
short-term production cycle : 12232 |
0,00 |
0,00 |
0,00 |
0,00 |
0,00 |
|
|
4. Finished goods:
12240 |
64.086,00 |
227.430,00 |
29.620,00 |
277.847,00 |
249.519,00 |
|
|
a) Of
long-term production cycle : 12241 |
0,00 |
0,00 |
0,00 |
0,00 |
0,00 |
|
|
b) Of
short-term production cycle : 12242 |
64.086,00 |
227.430,00 |
29.620,00 |
277.847,00 |
249.519,00 |
|
|
5. By-products, residues and
recycled materials: 12250 |
0,00 |
0,00 |
0,00 |
0,00 |
0,00 |
|
|
6. Advances to suppliers:
12260 |
599.355,00 |
4.063,00 |
1.952.318,00 |
187.920,00 |
62.892,00 |
|
|
III. Trade debtors and others receivable
accounts: 12300 |
9.849.429,00 |
8.598.219,00 |
6.963.189,00 |
5.387.145,00 |
6.318.587,00 |
|
|
1. Trade debtors / accounts
receivable: 12310 |
5.147.383,00 |
3.162.995,00 |
3.193.438,00 |
1.441.269,00 |
1.335.515,00 |
|
|
a)
Long-term receivables from sales and services supplied : 12311 |
0,00 |
0,00 |
0,00 |
0,00 |
0,00 |
|
|
b)
Customers for sales and provisions of services : 12312 |
5.147.383,00 |
3.162.995,00 |
3.193.438,00 |
1.441.269,00 |
1.335.515,00 |
|
|
2. Customers, Group
companies and associates : 12320 |
4.214.356,00 |
4.643.174,00 |
3.168.633,00 |
3.529.765,00 |
3.496.495,00 |
|
|
3. Other accounts
receivable: 12330 |
28.278,00 |
14.797,00 |
30.124,00 |
28.278,00 |
1.009.243,00 |
|
|
4. Personnel: 12340 |
5.664,00 |
15.043,00 |
9.350,00 |
2.179,00 |
4.534,00 |
|
|
5. Assets for deferred tax:
12350 |
0,00 |
0,00 |
0,00 |
0,00 |
0,00 |
|
|
6. Other debtors, including
tax and social security: 12360 |
453.748,00 |
762.210,00 |
561.644,00 |
385.654,00 |
472.800,00 |
|
|
7. Called up share capital:
12370 |
0,00 |
0,00 |
0,00 |
0,00 |
0,00 |
|
|
IV. Short-term investments in Group companies and
associates: 12400 |
1.029.673,00 |
11.857.000,00 |
12.749.647,00 |
15.928.535,00 |
82.851,00 |
|
|
1. Equity instruments:
12410 |
0,00 |
0,00 |
0,00 |
0,00 |
0,00 |
|
|
2. Credits to businesses:
12420 |
1.029.673,00 |
11.857.000,00 |
12.749.647,00 |
0,00 |
0,00 |
|
|
3. Debt securities:
12430 |
0,00 |
0,00 |
0,00 |
0,00 |
0,00 |
|
|
4. Derivatives : 12440 |
0,00 |
0,00 |
0,00 |
0,00 |
0,00 |
|
|
5. Other financial assets :
12450 |
0,00 |
0,00 |
0,00 |
15.928.535,00 |
82.851,00 |
|
|
6. Other investments:
12460 |
0,00 |
0,00 |
0,00 |
0,00 |
0,00 |
|
|
V. Short-term financial investments : 12500 |
395.596,00 |
383.076,00 |
396.278,00 |
0,00 |
0,00 |
|
|
1. Equity instruments:
12510 |
0,00 |
0,00 |
396.278,00 |
0,00 |
0,00 |
|
|
2. Credits to businesses:
12520 |
0,00 |
0,00 |
0,00 |
0,00 |
0,00 |
|
|
3. Debt securities:
12530 |
0,00 |
0,00 |
0,00 |
0,00 |
0,00 |
|
|
4. Derivatives : 12540 |
0,00 |
0,00 |
0,00 |
0,00 |
0,00 |
|
|
5. Other financial assets :
12550 |
395.596,00 |
383.076,00 |
0,00 |
0,00 |
0,00 |
|
|
6. Other investments:
12560 |
0,00 |
0,00 |
0,00 |
0,00 |
0,00 |
|
|
VI. Short-term accruals: 12600 |
172.085,00 |
184.058,00 |
191.876,00 |
197.622,00 |
204.319,00 |
|
|
VII. Cash and other equivalent liquid assets :
12700 |
119.414,00 |
256.516,00 |
2.361,00 |
0,00 |
2.116,00 |
|
|
1. Treasury: 12710 |
119.414,00 |
256.516,00 |
2.361,00 |
0,00 |
2.116,00 |
|
|
2. Other equivalent liquid
assets: 12720 |
0,00 |
0,00 |
0,00 |
0,00 |
0,00 |
|
|
TOTAL ASSETS (A + B) : 10000 |
36.754.701,00 |
38.074.741,00 |
42.252.479,00 |
38.272.676,00 |
35.593.147,00 |
|
|
|
ORIGINAL |
ORIGINAL |
ORIGINAL |
ORIGINAL |
ORIGINAL |
|
|
Liabilities and Net Worth |
2012 |
2011 |
2010 |
2009 |
2008 |
|
|
A) NET WORTH: 20000 |
18.083.417,00 |
18.019.100,00 |
17.547.662,00 |
17.221.928,00 |
16.481.636,00 |
|
|
A-1) Shareholders' equity: 21000 |
17.850.095,00 |
17.679.363,00 |
17.015.442,00 |
16.513.480,00 |
15.873.007,00 |
|
|
I. Capital: 21100 |
4.865.954,00 |
4.865.954,00 |
4.865.954,00 |
4.865.954,00 |
4.865.954,00 |
|
|
1. Registered capital :
21110 |
4.865.954,00 |
4.865.954,00 |
4.865.954,00 |
4.865.954,00 |
4.865.954,00 |
|
|
2. (Uncalled capital):
21120 |
0,00 |
0,00 |
0,00 |
0,00 |
0,00 |
|
|
II. Share premium: 21200 |
0,00 |
0,00 |
0,00 |
0,00 |
0,00 |
|
|
III. Reserves: 21300 |
12.813.409,00 |
12.149.488,00 |
11.647.526,00 |
11.007.053,00 |
9.619.921,00 |
|
|
1. Legal and statutory:
21310 |
973.191,00 |
973.191,00 |
973.191,00 |
973.191,00 |
973.191,00 |
|
|
2. Other reserves: 21320 |
11.840.218,00 |
11.176.297,00 |
10.674.335,00 |
10.033.862,00 |
8.646.730,00 |
|
|
IV. (Common stock equity): 21400 |
0,00 |
0,00 |
0,00 |
0,00 |
0,00 |
|
|
V. Results from previous periods: 21500 |
0,00 |
0,00 |
0,00 |
0,00 |
0,00 |
|
|
1. Brought forward:
21510 |
0,00 |
0,00 |
0,00 |
0,00 |
0,00 |
|
|
2. (Negative results from
previous periods): 21520 |
0,00 |
0,00 |
0,00 |
0,00 |
0,00 |
|
|
VI. Other shareholders' contributions:
21600 |
0,00 |
0,00 |
0,00 |
0,00 |
0,00 |
|
|
VII. Result of the period: 21700 |
170.732,00 |
663.921,00 |
1.401.962,00 |
3.440.473,00 |
2.587.132,00 |
|
|
VIII. (Interim dividend): 21800 |
0,00 |
0,00 |
-900.000,00 |
-2.800.000,00 |
-1.200.000,00 |
|
|
IX. Other net worth instruments: 21900 |
0,00 |
0,00 |
0,00 |
0,00 |
0,00 |
|
|
A-2) Adjustments due to changes in value:
22000 |
-41.614,00 |
-32.382,00 |
0,00 |
0,00 |
0,00 |
|
|
I. Financial assets held for sale: 22100 |
0,00 |
0,00 |
0,00 |
0,00 |
0,00 |
|
|
II. Hedge operations: 22200 |
-41.614,00 |
-32.382,00 |
0,00 |
0,00 |
0,00 |
|
|
III. Linked non-current assets and liabilities
held for sale : 22300 |
0,00 |
0,00 |
0,00 |
0,00 |
0,00 |
|
|
IV. Exchange rate difference: 22400 |
0,00 |
0,00 |
0,00 |
0,00 |
0,00 |
|
|
V. Other: 22500 |
0,00 |
0,00 |
0,00 |
0,00 |
0,00 |
|
|
A-3) Received subsidies, donations and legacies:
23000 |
274.936,00 |
372.119,00 |
532.220,00 |
708.448,00 |
608.629,00 |
|
|
B) NON-CURRENT LIABILITIES: 31000 |
1.179.026,00 |
1.605.740,00 |
317.739,00 |
482.911,00 |
529.776,00 |
|
|
I. Long-term provisions: 31100 |
0,00 |
0,00 |
0,00 |
0,00 |
0,00 |
|
|
1. Long-term employee
benefits liability: 31110 |
0,00 |
0,00 |
0,00 |
0,00 |
0,00 |
|
|
2. Environmental actions:
31120 |
0,00 |
0,00 |
0,00 |
0,00 |
0,00 |
|
|
3. Restructuring provisions:
31130 |
0,00 |
0,00 |
0,00 |
0,00 |
0,00 |
|
|
4. Other provisions:
31140 |
0,00 |
0,00 |
0,00 |
0,00 |
0,00 |
|
|
II Long-term creditors: 31200 |
1.059.449,00 |
1.446.260,00 |
0,00 |
0,00 |
0,00 |
|
|
1. Liabilities and other
securities: 31210 |
0,00 |
0,00 |
0,00 |
0,00 |
0,00 |
|
|
2. Amounts owed to credit
institutions: 31220 |
1.000.000,00 |
1.400.000,00 |
0,00 |
0,00 |
0,00 |
|
|
3. Creditors from financial
leasing: 31230 |
0,00 |
0,00 |
0,00 |
0,00 |
0,00 |
|
|
4. Derivatives : 31240 |
59.449,00 |
46.260,00 |
0,00 |
0,00 |
0,00 |
|
|
5. Other financial
liabilities : 31250 |
0,00 |
0,00 |
0,00 |
0,00 |
0,00 |
|
|
III. Long-term debts with Group companies and
associates: 31300 |
0,00 |
0,00 |
0,00 |
0,00 |
0,00 |
|
|
IV. Liabilities for deferred tax: 31400 |
119.577,00 |
159.480,00 |
317.739,00 |
482.911,00 |
529.776,00 |
|
|
V. Long-term accruals: 31500 |
0,00 |
0,00 |
0,00 |
0,00 |
0,00 |
|
|
VI. Non-current trade creditors : 31600 |
0,00 |
0,00 |
0,00 |
0,00 |
0,00 |
|
|
VII. Special long-term debts : 31700 |
0,00 |
0,00 |
0,00 |
0,00 |
0,00 |
|
|
C) CURRENT LIABILITIES : 32000 |
17.492.258,00 |
18.449.901,00 |
24.387.078,00 |
20.567.837,00 |
18.581.735,00 |
|
|
I. Liabilities linked to non-current assets held
for sale: 32100 |
0,00 |
0,00 |
0,00 |
0,00 |
0,00 |
|
|
II. Short-term provisions: 32200 |
0,00 |
0,00 |
0,00 |
0,00 |
0,00 |
|
|
III. Short-term creditors : 32300 |
706.764,00 |
1.249.780,00 |
2.355.285,00 |
5.795.187,00 |
2.122.969,00 |
|
|
1. Liabilities and other
securities: 32310 |
0,00 |
0,00 |
0,00 |
0,00 |
0,00 |
|
|
2. Amounts owed to credit
institutions: 32320 |
406.764,00 |
949.780,00 |
2.055.285,00 |
2.995.187,00 |
912.789,00 |
|
|
3. Creditors from financial
leasing: 32330 |
0,00 |
0,00 |
300.000,00 |
0,00 |
0,00 |
|
|
4. Derivatives : 32340 |
0,00 |
0,00 |
0,00 |
0,00 |
0,00 |
|
|
5. Other financial
liabilities : 32350 |
300.000,00 |
300.000,00 |
0,00 |
2.800.000,00 |
1.210.180,00 |
|
|
IV. Short-term debts with Group companies and
associates: 32400 |
2.812.559,00 |
4.816.721,00 |
3.703.445,00 |
0,00 |
2.813.580,00 |
|
|
V. Trade creditors and other accounts payable:
32500 |
13.969.827,00 |
12.383.400,00 |
18.328.348,00 |
14.772.650,00 |
13.645.186,00 |
|
|
1. Suppliers: 32510 |
10.485.484,00 |
7.139.559,00 |
12.174.633,00 |
9.845.457,00 |
6.034.396,00 |
|
|
a)
Long-term debts : 32511 |
0,00 |
0,00 |
0,00 |
0,00 |
0,00 |
|
|
b)
Short-term debts : 32512 |
10.485.484,00 |
7.139.559,00 |
12.174.633,00 |
9.845.457,00 |
6.034.396,00 |
|
|
2. Suppliers, Group
companies and associates: 32520 |
2.046.412,00 |
4.265.247,00 |
4.272.425,00 |
3.733.437,00 |
6.164.147,00 |
|
|
3. Other creditors:
32530 |
921.647,00 |
564.966,00 |
1.419.287,00 |
841.245,00 |
1.127.611,00 |
|
|
4. Personnel (remuneration
due): 32540 |
262.897,00 |
200.110,00 |
269.528,00 |
174.251,00 |
142.196,00 |
|
|
5. Liabilities for current
tax: 32550 |
0,00 |
0,00 |
0,00 |
0,00 |
0,00 |
|
|
6. Otras deudas con las
Administraciones Públicas. : 32560 |
253.387,00 |
213.518,00 |
192.475,00 |
178.260,00 |
176.836,00 |
|
|
7. Advances from clients:
32570 |
0,00 |
0,00 |
0,00 |
0,00 |
0,00 |
|
|
VI. Short-term accruals: 32600 |
3.108,00 |
0,00 |
0,00 |
0,00 |
0,00 |
|
|
VII. Special short-term debts : 32700 |
0,00 |
0,00 |
0,00 |
0,00 |
0,00 |
|
|
TOTAL NET WORTH AND LIABILITIES (A + B + C) : 30000 |
36.754.701,00 |
38.074.741,00 |
42.252.479,00 |
38.272.676,00 |
35.593.147,00 |
|
|
|
ORIGINAL |
ORIGINAL |
ORIGINAL |
ORIGINAL |
ORIGINAL |
|
|
Profit and Loss |
2012 |
2011 |
2010 |
2009 |
2008 |
|
|
1. Net turnover: 40100 |
154.788.104,00 |
121.058.121,00 |
122.645.553,00 |
120.765.061,00 |
128.154.162,00 |
|
|
a) Sales: 40110 |
154.493.647,00 |
120.716.538,00 |
122.079.730,00 |
120.376.443,00 |
127.996.091,00 |
|
|
b) Rendering of services: 40120 |
294.457,00 |
341.583,00 |
565.823,00 |
388.618,00 |
158.071,00 |
|
|
2. Changes in stocks of finished goods and work in progress:
40200 |
-163.344,00 |
197.810,00 |
-248.227,00 |
28.328,00 |
-163.277,00 |
|
|
3. Works carried out by the company for its assets: 40300 |
0,00 |
0,00 |
0,00 |
0,00 |
0,00 |
|
|
4. Supplies : 40400 |
-141.217.763,00 |
-109.643.097,00 |
-108.658.535,00 |
-105.706.935,00 |
-113.909.969,00 |
|
|
a) Stock consumption: 40410 |
-32.388,00 |
-7.792,00 |
633.909,00 |
-161.125,00 |
-247.885,00 |
|
|
b) Consumption of raw materials and miscellaneous
consumable ones: 40420 |
-140.516.325,00 |
-109.825.597,00 |
-109.156.586,00 |
-105.361.526,00 |
-113.708.526,00 |
|
|
c) Works carried out by other companies:
40430 |
-314.050,00 |
-95.507,00 |
-111.034,00 |
-116.360,00 |
-71.308,00 |
|
|
d) Impairment of stock, primary material and
other supplies: 40440 |
-355.000,00 |
285.799,00 |
-24.824,00 |
-67.924,00 |
117.750,00 |
|
|
5. Other operating income: 40500 |
182.250,00 |
52.622,00 |
63.226,00 |
0,00 |
0,00 |
|
|
a) Auxiliary income and other from current
management: 40510 |
166.341,00 |
52.622,00 |
61.107,00 |
0,00 |
0,00 |
|
|
b) Operation subsidies included in the
Period's result: 40520 |
15.909,00 |
0,00 |
2.119,00 |
0,00 |
0,00 |
|
|
6. Personnel costs: 40600 |
-7.043.995,00 |
-6.162.966,00 |
-6.161.142,00 |
-5.265.593,00 |
-5.139.692,00 |
|
|
a) Wages, salaries et al.: 40610 |
-5.339.820,00 |
-4.681.206,00 |
-4.668.321,00 |
-4.008.091,00 |
-3.839.321,00 |
|
|
b) Social security costs: 40620 |
-1.704.175,00 |
-1.481.760,00 |
-1.492.821,00 |
-1.257.502,00 |
-1.300.371,00 |
|
|
c) Provisions : 40630 |
0,00 |
0,00 |
0,00 |
0,00 |
0,00 |
|
|
7. Other operating costs: 40700 |
-5.147.488,00 |
-3.967.217,00 |
-4.475.573,00 |
-4.162.478,00 |
-4.957.458,00 |
|
|
a) External services: 40710 |
-5.055.196,00 |
-4.602.173,00 |
-4.388.279,00 |
-3.861.193,00 |
-4.235.048,00 |
|
|
b) Taxes: 40720 |
-39.582,00 |
-34.087,00 |
-75.420,00 |
-20.389,00 |
-22.410,00 |
|
|
c) Losses, impairments and variation in
provisions from trade operations : 40730 |
-52.710,00 |
665.653,00 |
0,00 |
-280.896,00 |
-700.000,00 |
|
|
d) Other current management expenditure :
40740 |
0,00 |
3.390,00 |
-11.874,00 |
0,00 |
0,00 |
|
|
8. Amortisation of fixed assets: 40800 |
-661.437,00 |
-677.494,00 |
-687.823,00 |
-633.914,00 |
-1.149.071,00 |
|
|
9. Allocation of subsidies of non-financial fixed assets and other:
40900 |
138.833,00 |
228.715,00 |
251.754,00 |
313.751,00 |
455.859,00 |
|
|
10. Excess provisions : 41000 |
0,00 |
0,00 |
0,00 |
0,00 |
0,00 |
|
|
11. Impairment and result of transfers of fixed assets: 41100 |
0,00 |
-162.008,00 |
-160.000,00 |
0,00 |
0,00 |
|
|
a) Impairment and losses : 41110 |
0,00 |
-162.008,00 |
-160.000,00 |
0,00 |
0,00 |
|
|
b) Results for transfers and other : 41120 |
0,00 |
0,00 |
0,00 |
0,00 |
0,00 |
|
|
12. Negative difference in combined businesses: 41200 |
0,00 |
0,00 |
0,00 |
0,00 |
0,00 |
|
|
13. Other results : 41300 |
-816,00 |
-10.290,00 |
12.031,00 |
-77.799,00 |
219.035,00 |
|
|
A.1) OPERATING INCOME (1 + 2 + 3 + 4 + 5 + 6 + 7 + 8 + 9 + 10 + 11 +
12 + 13) : 49100 |
874.344,00 |
914.196,00 |
2.581.264,00 |
5.260.421,00 |
3.509.589,00 |
|
|
14. Financial income : 41400 |
359.013,00 |
509.167,00 |
624.272,00 |
144.049,00 |
2.155,00 |
|
|
a) Of shares in equity instruments : 41410 |
359.013,00 |
0,00 |
0,00 |
0,00 |
0,00 |
|
|
a 1) In Group companies and
associates: 41411 |
358.963,00 |
0,00 |
0,00 |
0,00 |
0,00 |
|
|
a 2) In third parties:
41412 |
50,00 |
0,00 |
0,00 |
0,00 |
0,00 |
|
|
b) From negotiable securities and other financial
instruments : 41420 |
0,00 |
509.167,00 |
624.272,00 |
144.049,00 |
2.155,00 |
|
|
b 1) From Group companies
and associates : 41421 |
0,00 |
509.101,00 |
624.260,00 |
144.028,00 |
0,00 |
|
|
b 2) From third parties :
41422 |
0,00 |
66,00 |
12,00 |
21,00 |
2.155,00 |
|
|
c) Allocation of financial subsidies, donations
and legacies : 41430 |
0,00 |
0,00 |
0,00 |
0,00 |
0,00 |
|
|
15. Financial expenditure: 41500 |
-495.442,00 |
-399.500,00 |
-198.104,00 |
-97.166,00 |
-347.476,00 |
|
|
a) Amounts owed to Group companies and associates
: 41510 |
-328.271,00 |
-261.983,00 |
-192.009,00 |
-71.128,00 |
-282.245,00 |
|
|
b) For debts with third parties : 41520 |
-167.171,00 |
-137.517,00 |
-6.095,00 |
-26.038,00 |
-65.231,00 |
|
|
c) Stock renewal : 41530 |
0,00 |
0,00 |
0,00 |
0,00 |
0,00 |
|
|
16. Changes in fair value of financial instruments : 41600 |
0,00 |
0,00 |
0,00 |
0,00 |
0,00 |
|
|
a) Trading book and other : 41610 |
0,00 |
0,00 |
0,00 |
0,00 |
0,00 |
|
|
b) Allocation of financial assets held for sale
to the result for the period: 41620 |
0,00 |
0,00 |
0,00 |
0,00 |
0,00 |
|
|
17. Exchange rate differences : 41700 |
-493.556,00 |
-75.153,00 |
-996.841,00 |
-388.524,00 |
531.636,00 |
|
|
18. Impairment and result for transfers of financial instruments:
41800 |
0,00 |
0,00 |
0,00 |
0,00 |
0,00 |
|
|
a) Impairment and losses : 41810 |
0,00 |
0,00 |
0,00 |
0,00 |
0,00 |
|
|
b) Results for transfers and other : 41820 |
0,00 |
0,00 |
0,00 |
0,00 |
0,00 |
|
|
19. Other financial income and expenditure: 42100 |
0,00 |
0,00 |
0,00 |
0,00 |
0,00 |
|
|
a) Incorporation of financial expenditure to
assets: 42110 |
0,00 |
0,00 |
0,00 |
0,00 |
0,00 |
|
|
b) Financial income from arrangement with
creditors: 42120 |
0,00 |
0,00 |
0,00 |
0,00 |
0,00 |
|
|
c) Other income and expenditure: 42130 |
0,00 |
0,00 |
0,00 |
0,00 |
0,00 |
|
|
A.2) FINANCIAL REVENUE (14+15+16+17+18+19) : 49200 |
-629.985,00 |
34.514,00 |
-570.673,00 |
-341.641,00 |
186.315,00 |
|
|
A.3) NET RESULT BEFORE TAXES (A.1+A.2) : 49300 |
244.359,00 |
948.710,00 |
2.010.591,00 |
4.918.780,00 |
3.695.904,00 |
|
|
20. Income taxes: 41900 |
-73.627,00 |
-284.789,00 |
-608.629,00 |
-1.478.307,00 |
-1.108.772,00 |
|
|
A.4) PROFIT AFTER TAXES (A.3+20) : 49400 |
170.732,00 |
663.921,00 |
1.401.962,00 |
3.440.473,00 |
2.587.132,00 |
|
|
21. Result of the year coming from interrupted operations :
42000 |
0,00 |
0,00 |
0,00 |
0,00 |
0,00 |
|
|
A.5) RESULT OF THE PERIOD (A.4+21) : 49500 |
170.732,00 |
663.921,00 |
1.401.962,00 |
3.440.473,00 |
2.587.132,00 |
|
> Normal Balance Sheet under the rules of the 1990 General Accounting
Plan (repealed since 1st January of 2008)
Information corresponding to the fiscal year
2012 2011 2010 2009 2008 has been compiled based on
the equivalence criteria stipulated in Act JUS/206/2009. Where the provisions
of the Act did not establish relevant equivalence criteria, To view details on
the methodology 2012 2011 2010 2009 2008 is taken
from information submitted to the TRADE REGISTER.
|
|
EQUIVALENCIA |
EQUIVALENCIA |
EQUIVALENCIA |
EQUIVALENCIA |
EQUIVALENCIA |
|
|
ASSETS |
2012 |
2011 |
2010 |
2009 |
2008 |
|
|
A) SHAREHOLDERS (PARTNERS) BY UNCALLED SUSCRIBED CAPITAL: |
0,00 |
0,00 |
0,00 |
0,00 |
0,00 |
|
|
B) FIXED ASSETS: |
6.603.139,00 |
6.477.175,00 |
6.736.737,00 |
5.781.104,00 |
5.579.322,00 |
|
|
I. Formation expenses: |
0,00 |
0,00 |
0,00 |
0,00 |
0,00 |
|
|
II. Intangible fixed assets: |
422.909,00 |
469.188,00 |
381.616,00 |
258.699,00 |
0,00 |
|
|
1. Research and development
costs: |
0,00 |
0,00 |
0,00 |
0,00 |
0,00 |
|
|
2. Concessions, patents,
licences, trademarks et al.: |
0,00 |
0,00 |
0,00 |
0,00 |
0,00 |
|
|
3. Goodwill: |
0,00 |
0,00 |
0,00 |
0,00 |
0,00 |
|
|
4. Key money paid for
premises: |
0,00 |
0,00 |
0,00 |
0,00 |
0,00 |
|
|
5. Software: |
422.909,00 |
469.188,00 |
381.616,00 |
258.699,00 |
0,00 |
|
|
6. Assets under capital
leases: |
0,00 |
0,00 |
0,00 |
0,00 |
0,00 |
|
|
7. Payments on account:
|
0,00 |
0,00 |
0,00 |
0,00 |
0,00 |
|
|
8. Provisions: |
0,00 |
0,00 |
0,00 |
0,00 |
0,00 |
|
|
9. Accumulated depreciation:
|
0,00 |
0,00 |
0,00 |
0,00 |
0,00 |
|
|
III. Tangible fixed assets: |
5.671.491,00 |
5.499.193,00 |
5.846.327,00 |
5.522.224,00 |
5.579.141,00 |
|
|
1. Land and construction:
|
3.606.195,00 |
3.429.435,00 |
3.687.992,00 |
3.248.585,00 |
3.687.871,00 |
|
|
2. Technical installations
and machinery: |
1.884.710,00 |
1.986.866,00 |
2.071.895,00 |
1.497.321,00 |
1.815.526,00 |
|
|
3. Other installations,
tools and furniture: |
65.380,00 |
68.923,00 |
71.873,00 |
51.941,00 |
62.980,00 |
|
|
4. Payments on account and
tangible fixed assets under construction: |
101.956,00 |
0,00 |
0,00 |
713.849,00 |
0,00 |
|
|
5. Other tangible assets:
|
13.251,00 |
13.969,00 |
14.567,00 |
10.527,00 |
12.764,00 |
|
|
6. Provisions: |
0,00 |
0,00 |
0,00 |
0,00 |
0,00 |
|
|
7. Accumulated depreciation:
|
0,00 |
0,00 |
0,00 |
0,00 |
0,00 |
|
|
IV. Financial investments: |
508.739,00 |
508.794,00 |
508.794,00 |
181,00 |
181,00 |
|
|
1. Equity investments in
group companies: |
141,00 |
141,00 |
141,00 |
141,00 |
141,00 |
|
|
2. Receivables from group companies:
|
507.549,00 |
507.549,00 |
507.549,00 |
0,00 |
0,00 |
|
|
3. Equity investment in
associated companies: |
0,00 |
0,00 |
0,00 |
0,00 |
0,00 |
|
|
4. Credits to associated
companies: |
0,00 |
0,00 |
0,00 |
0,00 |
0,00 |
|
|
5. Long-term securities
portfolio: |
1.049,00 |
1.104,00 |
1.104,00 |
40,00 |
40,00 |
|
|
6. Other receivables: |
0,00 |
0,00 |
0,00 |
0,00 |
0,00 |
|
|
7. Long term guarantees and
deposits: |
0,00 |
0,00 |
0,00 |
0,00 |
0,00 |
|
|
8. Provisions: |
0,00 |
0,00 |
0,00 |
0,00 |
0,00 |
|
|
9. Long-term receivables
from public bodies: |
0,00 |
0,00 |
0,00 |
0,00 |
0,00 |
|
|
V. Own shares: |
0,00 |
0,00 |
0,00 |
0,00 |
0,00 |
|
|
VI. Long-term trade receivables: |
0,00 |
0,00 |
0,00 |
0,00 |
0,00 |
|
|
C) Deferred expenses: |
0,00 |
0,00 |
0,00 |
0,00 |
0,00 |
|
|
D) CURRENT ASSETS: |
30.151.562,00 |
31.597.566,00 |
35.515.742,00 |
32.491.572,00 |
30.013.825,00 |
|
|
I. Called-up share capital (not paid): |
0,00 |
0,00 |
0,00 |
0,00 |
0,00 |
|
|
II. Stocks: |
18.311.583,00 |
10.151.064,00 |
15.057.067,00 |
10.878.393,00 |
23.326.452,00 |
|
|
1. Goods for resale: |
0,00 |
0,00 |
0,00 |
0,00 |
0,00 |
|
|
2. Raw materials and other
consumables: |
17.648.142,00 |
9.919.571,00 |
13.075.129,00 |
10.412.626,00 |
23.014.041,00 |
|
|
3. Goods in process and
semifinished ones: |
0,00 |
0,00 |
0,00 |
0,00 |
0,00 |
|
|
4. Finished products: |
64.086,00 |
227.430,00 |
29.620,00 |
277.847,00 |
249.519,00 |
|
|
5. Byproducts, scrap and
recovered materials: |
0,00 |
0,00 |
0,00 |
0,00 |
0,00 |
|
|
6. Payments on account:
|
599.355,00 |
4.063,00 |
1.952.318,00 |
187.920,00 |
62.892,00 |
|
|
7. Provisions: |
0,00 |
0,00 |
0,00 |
0,00 |
0,00 |
|
|
III. Debtors: |
10.123.211,00 |
8.765.852,00 |
7.118.513,00 |
5.487.022,00 |
6.398.087,00 |
|
|
1. Trade debtors / accounts
receivable: |
5.147.383,00 |
3.162.995,00 |
3.193.438,00 |
1.441.269,00 |
1.335.515,00 |
|
|
2. Accounts receivable,
Group companies: |
4.214.356,00 |
4.643.174,00 |
3.168.633,00 |
3.529.765,00 |
3.496.495,00 |
|
|
3. Accounts receivable,
associated companies: |
0,00 |
0,00 |
0,00 |
0,00 |
0,00 |
|
|
4. Other debtors: |
28.278,00 |
14.797,00 |
30.124,00 |
28.278,00 |
1.009.243,00 |
|
|
5. Staff: |
5.664,00 |
15.043,00 |
9.350,00 |
2.179,00 |
4.534,00 |
|
|
6. Public bodies: |
727.530,00 |
929.843,00 |
716.968,00 |
485.531,00 |
552.300,00 |
|
|
7. Provisions: |
0,00 |
0,00 |
0,00 |
0,00 |
0,00 |
|
|
IV. Short-term investments: |
1.425.269,00 |
12.240.076,00 |
13.145.925,00 |
15.928.535,00 |
82.851,00 |
|
|
1. Equity investments in
group companies: |
0,00 |
0,00 |
0,00 |
0,00 |
0,00 |
|
|
2. Receivables from group
companies: |
1.029.673,00 |
11.857.000,00 |
12.749.647,00 |
0,00 |
0,00 |
|
|
3. Equity investment in
associated companies: |
0,00 |
0,00 |
0,00 |
0,00 |
0,00 |
|
|
4. Credits to associated
companies: |
0,00 |
0,00 |
0,00 |
0,00 |
0,00 |
|
|
5. Short term securities
portfolio: |
0,00 |
0,00 |
396.278,00 |
0,00 |
0,00 |
|
|
6. Other receivables: |
0,00 |
0,00 |
0,00 |
15.928.535,00 |
82.851,00 |
|
|
7. Shor term guarantees and
deposits: |
395.596,00 |
383.076,00 |
0,00 |
0,00 |
0,00 |
|
|
8. Provisions: |
0,00 |
0,00 |
0,00 |
0,00 |
0,00 |
|
|
V. Short-term treasury shares: |
0,00 |
0,00 |
0,00 |
0,00 |
0,00 |
|
|
VI. Cash at bank and in hand: |
119.414,00 |
256.516,00 |
2.361,00 |
0,00 |
2.116,00 |
|
|
VII. Prepayments and accrued income: |
172.085,00 |
184.058,00 |
191.876,00 |
197.622,00 |
204.319,00 |
|
|
GENERAL TOTAL (A + B + C + D): |
36.754.701,00 |
38.074.741,00 |
42.252.479,00 |
38.272.676,00 |
35.593.147,00 |
|
MERCANTILE REGISTRY.
|
|
EQUIVALENCIA |
EQUIVALENCIA |
EQUIVALENCIA |
EQUIVALENCIA |
EQUIVALENCIA |
|
|
LIABILITIES |
2012 |
2011 |
2010 |
2009 |
2008 |
|
|
A) EQUITY: |
17.950.411,00 |
17.804.877,00 |
17.175.108,00 |
16.726.014,00 |
16.055.596,00 |
|
|
I. Subscribed capital: |
4.865.954,00 |
4.865.954,00 |
4.865.954,00 |
4.865.954,00 |
4.865.954,00 |
|
|
II. Share premium: |
0,00 |
0,00 |
0,00 |
0,00 |
0,00 |
|
|
III. Revaluation reserves: |
1.927.859,00 |
1.840.194,00 |
1.783.835,00 |
1.712.320,00 |
1.506.760,00 |
|
|
IV. Reserves: |
10.985.866,00 |
10.434.808,00 |
10.023.357,00 |
9.507.268,00 |
8.295.750,00 |
|
|
1. Legal reserve: |
973.191,00 |
973.191,00 |
973.191,00 |
973.191,00 |
973.191,00 |
|
|
2. Reserves for own shares:
|
0,00 |
0,00 |
0,00 |
0,00 |
0,00 |
|
|
3. Reserves for shares of
the controlling company: |
0,00 |
0,00 |
0,00 |
0,00 |
0,00 |
|
|
4. Statutory reserves:
|
0,00 |
0,00 |
0,00 |
0,00 |
0,00 |
|
|
5. Miscellaneous reserves:
|
10.012.536,00 |
9.461.484,00 |
9.050.038,00 |
8.533.954,00 |
7.322.451,00 |
|
|
Differences due to capital
adjustement to euros: |
139,00 |
132,00 |
128,00 |
123,00 |
108,00 |
|
|
V. Profit or loss brought forward: |
0,00 |
0,00 |
0,00 |
0,00 |
0,00 |
|
|
1. Retained earnings: |
0,00 |
0,00 |
0,00 |
0,00 |
0,00 |
|
|
2. Prior year losses: |
0,00 |
0,00 |
0,00 |
0,00 |
0,00 |
|
|
3. Partners'
contributions so as to compensate losses: |
0,00 |
0,00 |
0,00 |
0,00 |
0,00 |
|
|
VI. Profit or loss for the financial year: |
170.732,00 |
663.921,00 |
1.401.962,00 |
3.440.473,00 |
2.587.132,00 |
|
|
VII. Interim dividend paid: |
0,00 |
0,00 |
-900.000,00 |
-2.800.000,00 |
-1.200.000,00 |
|
|
VIII. Own shares for capital reduction: |
0,00 |
0,00 |
0,00 |
0,00 |
0,00 |
|
|
B) Deferred income: |
192.455,00 |
260.483,00 |
372.554,00 |
495.914,00 |
426.040,00 |
|
|
1. Capital grants: |
192.455,00 |
260.483,00 |
372.554,00 |
495.914,00 |
426.040,00 |
|
|
2. Unrealised exchange
gains: |
0,00 |
0,00 |
0,00 |
0,00 |
0,00 |
|
|
3. Other deferred income:
|
0,00 |
0,00 |
0,00 |
0,00 |
0,00 |
|
|
4. Public revenues to
distribute in several financial years: |
0,00 |
0,00 |
0,00 |
0,00 |
0,00 |
|
|
C) PROVISIONS FOR LIABILITIES AND CHARGES: |
0,00 |
0,00 |
0,00 |
0,00 |
0,00 |
|
|
1. Provisions for pension
fund and other similar obligations: |
0,00 |
0,00 |
0,00 |
0,00 |
0,00 |
|
|
2. Provisions for taxes:
|
0,00 |
0,00 |
0,00 |
0,00 |
0,00 |
|
|
3. Other provisions: |
0,00 |
0,00 |
0,00 |
0,00 |
0,00 |
|
|
4. Reversion fund: |
0,00 |
0,00 |
0,00 |
0,00 |
0,00 |
|
|
D) LONG TERM LIABILITIES: |
1.119.577,00 |
1.559.480,00 |
317.739,00 |
482.911,00 |
529.776,00 |
|
|
I. Issued debentures and other marketable
securities: |
0,00 |
0,00 |
0,00 |
0,00 |
0,00 |
|
|
1. Non-convertible
debentures: |
0,00 |
0,00 |
0,00 |
0,00 |
0,00 |
|
|
2. Convertible debentures:
|
0,00 |
0,00 |
0,00 |
0,00 |
0,00 |
|
|
3. Other debt securities:
|
0,00 |
0,00 |
0,00 |
0,00 |
0,00 |
|
|
II. Amounts owed to credit institutions: |
1.000.000,00 |
1.400.000,00 |
0,00 |
0,00 |
0,00 |
|
|
1. Loans and other
liabilities: |
1.000.000,00 |
1.400.000,00 |
0,00 |
0,00 |
0,00 |
|
|
2. Long-term liabilities
from capital leases: |
0,00 |
0,00 |
0,00 |
0,00 |
0,00 |
|
|
III. Debts with companies of the group and
affiliated ones: |
0,00 |
0,00 |
0,00 |
0,00 |
0,00 |
|
|
1. Amounts owed to group companies:
|
0,00 |
0,00 |
0,00 |
0,00 |
0,00 |
|
|
2. Amounts owed to
associated companies: |
0,00 |
0,00 |
0,00 |
0,00 |
0,00 |
|
|
IV. Other creditors: |
119.577,00 |
159.480,00 |
317.739,00 |
482.911,00 |
529.776,00 |
|
|
1. Long-term bills of
exchange payable: |
0,00 |
0,00 |
0,00 |
0,00 |
0,00 |
|
|
2. Other creditors: |
0,00 |
0,00 |
0,00 |
0,00 |
0,00 |
|
|
3. Long term guarantees and
deposits received: |
0,00 |
0,00 |
0,00 |
0,00 |
0,00 |
|
|
4. Long term payables to public
bodies: |
119.577,00 |
159.480,00 |
317.739,00 |
482.911,00 |
529.776,00 |
|
|
V. Unpaid portion of equity investment: |
0,00 |
0,00 |
0,00 |
0,00 |
0,00 |
|
|
1. Group companies: |
0,00 |
0,00 |
0,00 |
0,00 |
0,00 |
|
|
2. Associated companies:
|
0,00 |
0,00 |
0,00 |
0,00 |
0,00 |
|
|
3. Third parties: |
0,00 |
0,00 |
0,00 |
0,00 |
0,00 |
|
|
VI. Long term trade creditors: |
0,00 |
0,00 |
0,00 |
0,00 |
0,00 |
|
|
E) SHORT TERM CREDITORS: |
17.492.258,00 |
18.449.901,00 |
24.387.078,00 |
20.567.837,00 |
18.581.735,00 |
|
|
I. Issued debentures and other marketable
securities: |
0,00 |
0,00 |
0,00 |
0,00 |
0,00 |
|
|
1. Non-convertible
debentures: |
0,00 |
0,00 |
0,00 |
0,00 |
0,00 |
|
|
2. Convertible debentures:
|
0,00 |
0,00 |
0,00 |
0,00 |
0,00 |
|
|
3. Other debt securities:
|
0,00 |
0,00 |
0,00 |
0,00 |
0,00 |
|
|
4. Accrued interest on
debentures and other debt securities: |
0,00 |
0,00 |
0,00 |
0,00 |
0,00 |
|
|
II. Amounts owed to credit institutions: |
406.764,00 |
949.780,00 |
2.355.285,00 |
2.995.187,00 |
912.789,00 |
|
|
1. Loans and other
liabilities: |
406.764,00 |
949.780,00 |
2.055.285,00 |
2.995.187,00 |
912.789,00 |
|
|
2. Accrued interest on
liabilities with credit institutions: |
0,00 |
0,00 |
0,00 |
0,00 |
0,00 |
|
|
3. Short-term liabilities
from capital leases: |
0,00 |
0,00 |
300.000,00 |
0,00 |
0,00 |
|
|
III. Short-term amounts owed to group and
associated companies: |
4.858.971,00 |
9.081.968,00 |
7.975.870,00 |
3.733.437,00 |
8.977.727,00 |
|
|
1. Amounts owed to group
companies: |
4.858.971,00 |
9.081.968,00 |
7.975.870,00 |
3.733.437,00 |
8.977.727,00 |
|
|
2. Amounts owed to
associated companies: |
0,00 |
0,00 |
0,00 |
0,00 |
0,00 |
|
|
IV. Trade creditors: |
11.407.131,00 |
7.704.525,00 |
13.593.920,00 |
10.686.702,00 |
7.162.007,00 |
|
|
1. Advanced payments from
customers: |
0,00 |
0,00 |
0,00 |
0,00 |
0,00 |
|
|
2. Amounts owed for
purchases of goods or services: |
11.407.131,00 |
7.704.525,00 |
13.593.920,00 |
10.686.702,00 |
7.162.007,00 |
|
|
3. Debts represented by
notes payable: |
0,00 |
0,00 |
0,00 |
0,00 |
0,00 |
|
|
V. Other creditors: |
816.284,00 |
713.628,00 |
462.003,00 |
3.152.511,00 |
1.529.212,00 |
|
|
1. Public bodies: |
253.387,00 |
213.518,00 |
192.475,00 |
178.260,00 |
176.836,00 |
|
|
2. Bills of exchange
payable: |
0,00 |
0,00 |
0,00 |
0,00 |
0,00 |
|
|
3. Miscellaneous debts:
|
300.000,00 |
300.000,00 |
0,00 |
2.800.000,00 |
1.210.180,00 |
|
|
4. Wages and salaries
payable: |
262.897,00 |
200.110,00 |
269.528,00 |
174.251,00 |
142.196,00 |
|
|
5. Guarantees and deposits
received at short term: |
0,00 |
0,00 |
0,00 |
0,00 |
0,00 |
|
|
VI. Provisions: |
0,00 |
0,00 |
0,00 |
0,00 |
0,00 |
|
|
VII. Prepayments and accrued income: |
3.108,00 |
0,00 |
0,00 |
0,00 |
0,00 |
|
|
F) SHORT-TERM PROVISIONS FOR LIABILITIES AND CHARGES: |
0,00 |
0,00 |
0,00 |
0,00 |
0,00 |
|
|
GENERAL TOTAL (A + B + C + D + E + F): |
36.754.701,00 |
38.074.741,00 |
42.252.479,00 |
38.272.676,00 |
35.593.147,00 |
|
MERCANTILE REGISTRY.
|
|
EQUIVALENCIA |
EQUIVALENCIA |
EQUIVALENCIA |
EQUIVALENCIA |
EQUIVALENCIA |
|
|
DEBIT |
2012 |
2011 |
2010 |
2009 |
2008 |
|
|
A) CHARGES (A.1 to A.15): |
155.297.468,00 |
121.382.514,00 |
122.194.874,00 |
117.810.716,00 |
126.775.715,00 |
|
|
A.1. Stock reduction of both
manufactured goods and the ones in process: |
163.344,00 |
0,00 |
248.227,00 |
0,00 |
163.277,00 |
|
|
A.2. Supplies: |
140.862.763,00 |
109.928.896,00 |
108.633.711,00 |
105.639.011,00 |
114.027.719,00 |
|
|
a)
Stock consumption: |
32.388,00 |
7.792,00 |
-633.909,00 |
161.125,00 |
247.885,00 |
|
|
b)
Consumption of raw materials and miscellaneous consumable ones: |
140.516.325,00 |
109.825.597,00 |
109.156.586,00 |
105.361.526,00 |
113.708.526,00 |
|
|
c)
Miscellaneous external expenditure: |
314.050,00 |
95.507,00 |
111.034,00 |
116.360,00 |
71.308,00 |
|
|
A.3. Staff costs: |
7.043.995,00 |
6.162.966,00 |
6.161.142,00 |
5.265.593,00 |
5.139.692,00 |
|
|
a)
Wages, salaries et al.: |
5.339.820,00 |
4.681.206,00 |
4.668.321,00 |
4.008.091,00 |
3.839.321,00 |
|
|
b)
Social security costs: |
1.704.175,00 |
1.481.760,00 |
1.492.821,00 |
1.257.502,00 |
1.300.371,00 |
|
|
A.4. Depreciation expense:
|
661.437,00 |
677.494,00 |
687.823,00 |
633.914,00 |
1.149.071,00 |
|
|
A.5. Variation of trade
provisions and losses of unrecovered receivables: |
407.710,00 |
-951.452,00 |
24.824,00 |
348.820,00 |
582.250,00 |
|
|
a)
Stock provision variation: |
355.000,00 |
-285.799,00 |
24.824,00 |
67.924,00 |
-117.750,00 |
|
|
b)
Variation in provision and bad debt losses: |
0,00 |
0,00 |
0,00 |
0,00 |
0,00 |
|
|
c)
Variation of other trade provisions: |
52.710,00 |
-665.653,00 |
0,00 |
280.896,00 |
700.000,00 |
|
|
A.6. Other operating
charges: |
5.094.778,00 |
4.632.870,00 |
4.475.573,00 |
3.881.582,00 |
4.257.458,00 |
|
|
a)
External services: |
5.055.196,00 |
4.602.173,00 |
4.388.279,00 |
3.861.193,00 |
4.235.048,00 |
|
|
b)
Taxes: |
39.582,00 |
34.087,00 |
75.420,00 |
20.389,00 |
22.410,00 |
|
|
c)
Other operating expenses: |
0,00 |
-3.390,00 |
11.874,00 |
0,00 |
0,00 |
|
|
d)
Allocation to revision fund: |
0,00 |
0,00 |
0,00 |
0,00 |
0,00 |
|
|
A.I. OPERATING BENEFITS
(B.1+B.2+B.3+B.4-A.1-A.2-A.3-A.4-A.5-A.6): |
736.327,00 |
857.779,00 |
2.477.479,00 |
5.024.469,00 |
2.834.695,00 |
|
|
A.7. Financial and similar
charges: |
495.442,00 |
399.500,00 |
198.104,00 |
97.166,00 |
347.476,00 |
|
|
a) Due
to liabilities with companies of the group: |
328.271,00 |
261.983,00 |
192.009,00 |
71.128,00 |
282.245,00 |
|
|
b) Due
to liabilities with associated companies: |
0,00 |
0,00 |
0,00 |
0,00 |
0,00 |
|
|
c) Due
to other debts.: |
167.171,00 |
137.517,00 |
6.095,00 |
26.038,00 |
65.231,00 |
|
|
d)
Losses from financial investments: |
0,00 |
0,00 |
0,00 |
0,00 |
0,00 |
|
|
A.8. Changes in financial
investment provisions: |
0,00 |
0,00 |
0,00 |
0,00 |
0,00 |
|
|
A.9. Exchange losses: |
493.556,00 |
75.153,00 |
996.841,00 |
388.524,00 |
0,00 |
|
|
A.II. NET FINANCIAL INCOME
(B.5+B.6+B.7+B.8-A.7-A.8-A.9): |
0,00 |
34.514,00 |
0,00 |
0,00 |
186.315,00 |
|
|
A.III. PROFIT FROM ORDINARY ACTIVITIES
(A.I+A.II-B.I-B.II): |
106.342,00 |
892.293,00 |
1.906.806,00 |
4.682.828,00 |
3.021.010,00 |
|
|
A.10. Changes in provisions
for intangible, tangible and securities portfolio: |
0,00 |
162.008,00 |
160.000,00 |
0,00 |
0,00 |
|
|
A.11. Losses from tangible
and intangible fixed assets and securities portfolio: |
0,00 |
0,00 |
0,00 |
0,00 |
0,00 |
|
|
A.12. Losses from
transactions with own shares and debentures: |
0,00 |
0,00 |
0,00 |
0,00 |
0,00 |
|
|
A.13. Extraordinary
expenses: |
816,00 |
10.290,00 |
0,00 |
77.799,00 |
0,00 |
|
|
A.14. Expenses and losses of
former financial years: |
0,00 |
0,00 |
0,00 |
0,00 |
0,00 |
|
|
A.IV. EXTRAORDINARY PROFIT
(B.9+B.10+B.11+B.12+B.13-A.10-A.11-A.12-A.13-A.14): |
138.017,00 |
56.417,00 |
103.785,00 |
235.952,00 |
674.894,00 |
|
|
A.V. PROFIT BEFORE TAXES (A.III+A.IV-B.III-B.IV):
|
244.359,00 |
948.710,00 |
2.010.591,00 |
4.918.780,00 |
3.695.904,00 |
|
|
A.15. Corporation tax:
|
73.627,00 |
284.789,00 |
608.629,00 |
1.478.307,00 |
1.108.772,00 |
|
|
A.16. Miscellaneous taxes:
|
0,00 |
0,00 |
0,00 |
0,00 |
0,00 |
|
|
A.VI. FINANCIAL YEAR RESULTS (PROFIT)
(A.V-A.15-A.16): |
170.732,00 |
663.921,00 |
1.401.962,00 |
3.440.473,00 |
2.587.132,00 |
|
MERCANTILE REGISTRY.
|
|
EQUIVALENCIA |
EQUIVALENCIA |
EQUIVALENCIA |
EQUIVALENCIA |
EQUIVALENCIA |
|
|
CREDIT |
2012 |
2011 |
2010 |
2009 |
2008 |
|
|
B) INCOME ( B.1 to B.13): |
155.468.200,00 |
122.046.435,00 |
123.596.836,00 |
121.251.189,00 |
129.362.847,00 |
|
|
B.1. Net total sales: |
154.788.104,00 |
121.058.121,00 |
122.645.553,00 |
120.765.061,00 |
128.154.162,00 |
|
|
a)
Sales: |
154.498.024,00 |
120.719.958,00 |
122.083.189,00 |
120.379.854,00 |
127.999.718,00 |
|
|
b) Rendering
of services: |
294.457,00 |
341.583,00 |
565.823,00 |
388.618,00 |
158.071,00 |
|
|
Returns
and Rappel on sales: |
-4.377,00 |
-3.420,00 |
-3.459,00 |
-3.411,00 |
-3.627,00 |
|
|
B.2. Stock increase of
manufactured goods and products in process: |
0,00 |
197.810,00 |
0,00 |
28.328,00 |
0,00 |
|
|
B.3. Works performed by the
company for fixed assets: |
0,00 |
0,00 |
0,00 |
0,00 |
0,00 |
|
|
B.4. Miscellaneous operating
income: |
182.250,00 |
52.622,00 |
63.226,00 |
0,00 |
0,00 |
|
|
a)
Auxiliary income and other from current management: |
166.341,00 |
52.622,00 |
61.107,00 |
0,00 |
0,00 |
|
|
b)
Grants: |
15.909,00 |
0,00 |
2.119,00 |
0,00 |
0,00 |
|
|
c)
Liabilities and charges provisions surplus: |
0,00 |
0,00 |
0,00 |
0,00 |
0,00 |
|
|
B.I. PÉRDIDAS DE EXPLOTACIÓN
(A.1+A.2+A.3+A.4+A.5-A.6-B.1-B.2-B.3-B.4): |
0,00 |
0,00 |
0,00 |
0,00 |
0,00 |
|
|
B.5. Income from equity
investment: |
359.013,00 |
0,00 |
0,00 |
0,00 |
0,00 |
|
|
a) In
companies of the group: |
358.963,00 |
0,00 |
0,00 |
0,00 |
0,00 |
|
|
b) In
associated companies: |
0,00 |
0,00 |
0,00 |
0,00 |
0,00 |
|
|
c)
Third parties: |
50,00 |
0,00 |
0,00 |
0,00 |
0,00 |
|
|
B.6. Income from other
marketable securities and long-term receivables: |
0,00 |
0,00 |
0,00 |
0,00 |
0,00 |
|
|
a) From
companies of the group: |
0,00 |
0,00 |
0,00 |
0,00 |
0,00 |
|
|
b) From
associated companies: |
0,00 |
0,00 |
0,00 |
0,00 |
0,00 |
|
|
c) From
companies out of the group: |
0,00 |
0,00 |
0,00 |
0,00 |
0,00 |
|
|
B.7. Miscellaneous interests
or similar income: |
0,00 |
509.167,00 |
624.272,00 |
144.049,00 |
2.155,00 |
|
|
a) From
companies of the group: |
0,00 |
509.101,00 |
624.260,00 |
144.028,00 |
0,00 |
|
|
b) From
associated companies: |
0,00 |
0,00 |
0,00 |
0,00 |
0,00 |
|
|
c)
Miscellaneous interests: |
0,00 |
66,00 |
12,00 |
21,00 |
2.155,00 |
|
|
d) Profit
on financial investment: |
0,00 |
0,00 |
0,00 |
0,00 |
0,00 |
|
|
B.8. Exchange positive
differences: |
0,00 |
0,00 |
0,00 |
0,00 |
531.636,00 |
|
|
B.II. NEGATIVE FINANCIAL RESULTS
(A.7+A.8+A.9-B.5-B.6-B.7-B.8): |
629.985,00 |
0,00 |
570.673,00 |
341.641,00 |
0,00 |
|
|
B.III. LOSSES ON ORDINARY ACTIVITIES ( B.I + B.II
- A.I - A.II ): |
0,00 |
0,00 |
0,00 |
0,00 |
0,00 |
|
|
B.9.Profit on disposal of
both tangible and intangible fixed assets and securities portfolio: |
0,00 |
0,00 |
0,00 |
0,00 |
0,00 |
|
|
B.10. Profit on transactions
with own shares and debentures: |
0,00 |
0,00 |
0,00 |
0,00 |
0,00 |
|
|
B.11. Capital grants
transferred to profit and loss: |
138.833,00 |
228.715,00 |
251.754,00 |
313.751,00 |
455.859,00 |
|
|
B.12. Extraordinary income:
|
0,00 |
0,00 |
12.031,00 |
0,00 |
219.035,00 |
|
|
B.13. Income and profit of
former financial years: |
0,00 |
0,00 |
0,00 |
0,00 |
0,00 |
|
|
B.IV. NEGATIVE EXTRAORDINARY RESULTS
(A.10+A.11+A.12+A.13+A.14-B.9-B.10-B.11-B.12-B.13): |
0,00 |
0,00 |
0,00 |
0,00 |
0,00 |
|
|
B.V. LOSSES BEFORE TAXES (B.III+B.IV-A.III-A.IV):
|
0,00 |
0,00 |
0,00 |
0,00 |
0,00 |
|
|
B.VI. RESULT OF THE PERIOD (LOSSES)
(B.V+A.15+A.16): |
0,00 |
0,00 |
0,00 |
0,00 |
0,00 |
|
MERCANTILE REGISTRY.
CASHFLOW STATEMENT
Model: Normal
> Source of information: Data contained in this section is taken from
the information declared in the Annual Accounts submitted to the Trade
Register.
|
|
2012 |
2011 |
2010 |
2009 |
2008 |
|
|
1. Fiscal year result before taxes.: 61100 |
244.359,00 |
948.710,00 |
2.010.591,00 |
4.918.780,00 |
3.695.904,00 |
|
|
2. Results adjustments.: 61200 |
1.560.299,00 |
-375.179,00 |
1.191.566,00 |
1.010.624,00 |
225.831,00 |
|
|
a) Fixed Assets Amortization (+).: 61201 |
661.437,00 |
677.494,00 |
687.823,00 |
633.914,00 |
1.149.071,00 |
|
|
b) Obsolescence Allowances (+/-). : 61202 |
407.710,00 |
-951.452,00 |
0,00 |
0,00 |
0,00 |
|
|
c) Variation in Provision (+/-). : 61203 |
0,00 |
168.149,00 |
184.824,00 |
348.820,00 |
-117.750,00 |
|
|
d) Allocation of grants (-).: 61204 |
-138.833,00 |
-228.715,00 |
-251.754,00 |
-313.751,00 |
-455.859,00 |
|
|
e) Results on disposal of fixed assets (+/-). :
61205 |
0,00 |
-6.141,00 |
0,00 |
0,00 |
0,00 |
|
|
g) Financial income (-).: 61207 |
-359.013,00 |
-509.167,00 |
-624.272,00 |
-144.049,00 |
-2.155,00 |
|
|
h) Financial Expenses (+). : 61208 |
495.442,00 |
399.500,00 |
198.104,00 |
97.166,00 |
-347.476,00 |
|
|
i) Exchange differences (+/-). : 61209 |
493.556,00 |
75.153,00 |
996.841,00 |
388.524,00 |
0,00 |
|
|
3. Changes in current capital equity.: 61300 |
-8.217.931,00 |
-1.577.055,00 |
6.899.307,00 |
-4.368.942,00 |
-3.160.628,00 |
|
|
a) Stock (+/-).: 61301 |
-8.515.519,00 |
5.191.802,00 |
-4.203.497,00 |
12.380.135,00 |
-2.984.378,00 |
|
|
d) Debtors and other accounts receivable (+/-). :
61302 |
-1.303.920,00 |
-970.169,00 |
-2.038.315,00 |
-15.051.110,00 |
929.427,00 |
|
|
c) Other current assets (+/-). : 61303 |
11.973,00 |
7.818,00 |
3.412.615,00 |
6.697,00 |
-25.177,00 |
|
|
d) Creditors and other accounts payable (+/-). :
61304 |
1.586.427,00 |
-5.806.506,00 |
9.728.504,00 |
-1.704.664,00 |
-1.080.500,00 |
|
|
e) Other current liabilities (+/-).: 61305 |
3.108,00 |
0,00 |
0,00 |
0,00 |
0,00 |
|
|
4. Other cash flows for operating activities.: 61400 |
-170.300,00 |
-500.470,00 |
-1.594.412,00 |
-1.686.539,00 |
-882.598,00 |
|
|
a) Interest payments (-). : 61401 |
-169.461,00 |
-128.463,00 |
-6.095,00 |
-98.231,00 |
346.396,00 |
|
|
c) Interest collection (+). : 61403 |
50,00 |
66,00 |
12,00 |
21,00 |
2.155,00 |
|
|
d) Income tax payment collection (payments)
(+/-).: 61404 |
-889,00 |
-372.073,00 |
-1.588.329,00 |
-1.588.329,00 |
-1.231.149,00 |
|
|
5. Operating activity cash flows (1 + 2 + 3 + 4) : 61500 |
-6.583.573,00 |
-1.503.994,00 |
8.507.052,00 |
-126.077,00 |
-121.491,00 |
|
|
6. Payments for investment (-).: 62100 |
-799.976,00 |
-650.833,00 |
-4.086.836,00 |
-1.153.237,00 |
-758.597,00 |
|
|
a) Companies of the group and affiliates. :
62101 |
0,00 |
0,00 |
-2.671.339,00 |
0,00 |
0,00 |
|
|
b) Intangible fixed assets. : 62102 |
-84.000,00 |
-163.288,00 |
-198.633,00 |
-258.699,00 |
0,00 |
|
|
c) Fixed assets. : 62103 |
-408.876,00 |
-487.545,00 |
-1.215.800,00 |
-894.538,00 |
-39.158,00 |
|
|
e) Other financial assets. : 62105 |
-12.520,00 |
0,00 |
-1.064,00 |
0,00 |
0,00 |
|
|
f) Non-current assets kept for sale. :
62106 |
-294.580,00 |
0,00 |
0,00 |
0,00 |
-719.439,00 |
|
|
7. Divestment payment collection (+). : 62200 |
11.186.345,00 |
2.118.773,00 |
73.549,00 |
317.541,00 |
0,00 |
|
|
a) Companies of the group and affiliates. :
62201 |
11.186.290,00 |
2.093.376,00 |
0,00 |
0,00 |
0,00 |
|
|
c) Fixed assets. : 62203 |
0,00 |
12.195,00 |
0,00 |
0,00 |
0,00 |
|
|
e) Other financial assets. : 62205 |
55,00 |
13.202,00 |
0,00 |
0,00 |
0,00 |
|
|
f) Non-current assets kept for sale. :
62206 |
0,00 |
0,00 |
73.549,00 |
317.541,00 |
0,00 |
|
|
8. Investment activity cash flows (6 + 7) minus Amortization:
62300 |
10.386.369,00 |
1.467.940,00 |
-4.013.287,00 |
-835.696,00 |
-758.597,00 |
|
|
9. Payment collection and payments for equity instruments. :
63100 |
0,00 |
0,00 |
0,00 |
456.350,00 |
0,00 |
|
|
a) Issuance of equity instruments (+). :
63101 |
0,00 |
0,00 |
0,00 |
0,00 |
222.713,00 |
|
|
e) Grants, donations and bequests received (+). :
63105 |
0,00 |
0,00 |
0,00 |
456.350,00 |
0,00 |
|
|
10. Payment collection and payments for financial liabilities
instruments.: 63200 |
-3.446.342,00 |
205.697,00 |
-639.902,00 |
2.083.463,00 |
877.218,00 |
|
|
a) Issuance : 63201 |
0,00 |
2.000.000,00 |
0,00 |
2.083.463,00 |
877.218,00 |
|
|
2. Debts incurred with credit institutions (+). :
63203 |
0,00 |
2.000.000,00 |
0,00 |
2.083.463,00 |
877.218,00 |
|
|
b) Repayment and amortization of : 63207 |
-3.446.342,00 |
-1.794.303,00 |
-639.902,00 |
0,00 |
0,00 |
|
|
2. Debts incurred with credit institutions (-).:
63209 |
-940.726,00 |
-1.794.303,00 |
-939.902,00 |
0,00 |
0,00 |
|
|
3. Debts incurred with companies of the group and
affiliates (-). : 63210 |
-2.505.616,00 |
0,00 |
0,00 |
0,00 |
0,00 |
|
|
5. Other debts (-). : 63212 |
0,00 |
0,00 |
300.000,00 |
0,00 |
0,00 |
|
|
11. Payments from dividends and remunerations from other assets
instruments. : 63300 |
0,00 |
0,00 |
-2.800.000,00 |
-1.200.000,00 |
0,00 |
|
|
a) Dividends (-).: 63301 |
0,00 |
0,00 |
-2.800.000,00 |
-1.200.000,00 |
0,00 |
|
|
12. Cash flows for financing activities (9+10+11).: 63400 |
-3.446.342,00 |
205.697,00 |
-3.439.902,00 |
1.339.813,00 |
877.218,00 |
|
|
D) EFECTO DE LAS VARIACIONES DE LOS TIPOS DE CAMBIO: 64000 |
-493.556,00 |
84.512,00 |
-1.051.502,00 |
-380.156,00 |
0,00 |
|
|
E) NET INCREASE/DECREASE OF CASH OR EQUIVALENT ASSETS (+/-5+/-8+/12+/-D)
: 65000 |
-137.102,00 |
254.155,00 |
2.361,00 |
-2.116,00 |
-2.870,00 |
|
|
Cash or equivalent assets as of beginning of the
fiscal year.: 65100 |
256.516,00 |
2.361,00 |
0,00 |
2.116,00 |
4.986,00 |
|
|
Cash or equivalent assets as of end of the fiscal
year.: 65200 |
119.414,00 |
256.516,00 |
2.361,00 |
0,00 |
2.116,00 |
|
FINANCIAL DIAGNOSIS
> Economic-Financial Comparative Analysis
Data used in the following ratios and indicators is taken from the
Annual Accounts submitted by the company to the TRADE REGISTER.
> Comparison within the Sector
|
Cash Flow |
2012 |
2011 |
Variación 2012 - 2011 |
|
|||
|
|
Empresa |
Sector |
Empresa |
Sector |
Empresa |
Sector |
|
|
Cash Flow over Sales: |
0,00 % |
0,01 % |
0,00 % |
0,00 % |
|
|
|
|
EBITDA over Sales: |
0,90 % |
9,69 % |
1,27 % |
10,07 % |
-28,80 % |
-3,83 % |
|
|
Cash Flow Yield: |
0,00 % |
0,01 % |
0,01 % |
0,00 % |
-155,88 % |
|
|
|
Profitability |
2012 |
2011 |
Variación 2012 - 2011 |
|
|||
|
|
Empresa |
Sector |
Empresa |
Sector |
Empresa |
Sector |
|
|
Operating economic profitability: |
2,51 % |
5,80 % |
3,65 % |
6,99 % |
-31,15 % |
-17,03 % |
|
|
Total economic profitability: |
2,01 % |
2,94 % |
3,54 % |
4,21 % |
-43,16 % |
-30,20 % |
|
|
Financial profitability: |
0,96 % |
2,53 % |
3,76 % |
5,93 % |
-74,53 % |
-57,29 % |
|
|
Margin: |
0,56 % |
5,27 % |
0,76 % |
6,35 % |
-26,02 % |
-17,00 % |
|
|
Mark-up: |
0,16 % |
2,24 % |
0,79 % |
4,76 % |
-80,02 % |
-52,91 % |
|
|
Solvency |
2012 |
2011 |
Variación 2012 - 2011 |
|
|||
|
|
Empresa |
Sector |
Empresa |
Sector |
Empresa |
Sector |
|
|
Liquidity: |
0,01 |
0,13 |
0,01 |
0,11 |
-50,90 |
20,41 |
|
|
Acid Test: |
0,65 |
0,87 |
1,14 |
0,83 |
-43,03 |
4,64 |
|
|
Working Capital / Investment: |
0,34 |
0,03 |
0,34 |
0,03 |
1,20 |
26,40 |
|
|
Solvency: |
1,72 |
1,22 |
1,71 |
1,16 |
0,65 |
4,91 |
|
|
Indebtedness |
2012 |
2011 |
Variación 2012 - 2011 |
|
|||
|
|
Empresa |
Sector |
Empresa |
Sector |
Empresa |
Sector |
|
|
Indebtedness level: |
1,03 |
1,50 |
1,11 |
1,60 |
-7,28 |
-6,30 |
|
|
Borrowing Composition: |
0,07 |
1,14 |
0,09 |
1,01 |
-22,55 |
13,00 |
|
|
Repayment Ability: |
-136,19 |
84,80 |
78,91 |
474,45 |
-272,58 |
-82,13 |
|
|
Warranty: |
1,97 |
1,68 |
1,90 |
1,63 |
3,69 |
2,69 |
|
|
Generated resources / Total creditors: |
0,06 |
0,08 |
0,05 |
0,07 |
20,80 |
4,46 |
|
|
Efficiency |
2012 |
2011 |
Variación 2012 - 2011 |
|
|||
|
|
Empresa |
Sector |
Empresa |
Sector |
Empresa |
Sector |
|
|
Productivity: |
1,20 |
1,75 |
1,25 |
1,72 |
-4,06 |
1,59 |
|
|
Turnover of Collection Rights : |
15,73 |
4,94 |
14,09 |
4,48 |
11,70 |
10,12 |
|
|
Turnover of Payment Entitlements: |
10,47 |
3,55 |
9,19 |
3,26 |
13,88 |
8,81 |
|
|
Stock rotation: |
8,42 |
7,10 |
11,85 |
6,15 |
-28,90 |
15,30 |
|
|
Assets turnover: |
4,45 |
1,10 |
4,78 |
1,10 |
-6,93 |
-0,04 |
|
|
Borrowing Cost: |
2,65 |
3,09 |
1,99 |
2,91 |
33,21 |
6,09 |
|
> Trend of indicators under the General Accounting Plan of 2007
(2012, 2011, 2010, 2009, 2008)
|
Cash Flow |
2012 |
2011 |
2010 |
2009 |
2008 |
|
|
Cash Flow over Sales: |
0,00 % |
0,00 % |
0,00 % |
0,00 % |
0,00 % |
|
|
EBITDA over Sales: |
0,90 % |
1,27 % |
2,58 % |
4,69 % |
3,11 % |
|
|
Cash Flow Yield: |
0,00 % |
0,01 % |
0,00 % |
-0,01 % |
-0,01 % |
|
|
Profitability |
2012 |
2011 |
2010 |
2009 |
2008 |
|
|
Operating economic profitability: |
2,51 % |
3,65 % |
8,98 % |
23,89 % |
9,27 % |
|
|
Total economic profitability: |
2,01 % |
3,54 % |
5,23 % |
13,11 % |
11,36 % |
|
|
Financial profitability: |
0,96 % |
3,76 % |
8,24 % |
20,83 % |
16,30 % |
|
|
Margin: |
0,56 % |
0,76 % |
2,09 % |
4,42 % |
2,57 % |
|
|
Mark-up: |
0,16 % |
0,79 % |
1,63 % |
4,14 % |
-0,03 % |
|
|
Solvency |
2012 |
2011 |
2010 |
2009 |
2008 |
|
|
Liquidity: |
0,01 |
0,01 |
0,00 |
0,00 |
0,00 |
|
|
Acid Test: |
0,65 |
1,14 |
0,82 |
1,04 |
0,34 |
|
|
Working Capital / Investment: |
0,34 |
0,34 |
0,26 |
0,32 |
0,32 |
|
|
Solvency: |
1,72 |
1,71 |
1,46 |
1,58 |
1,62 |
|
|
Indebtedness |
2012 |
2011 |
2010 |
2009 |
2008 |
|
|
Indebtedness level: |
1,03 |
1,11 |
1,41 |
1,22 |
1,16 |
|
|
Borrowing Composition: |
0,07 |
0,09 |
0,01 |
0,02 |
0,03 |
|
|
Repayment Ability: |
-136,19 |
78,91 |
10.463,71 |
3,55 |
8,39 |
|
|
Warranty: |
1,97 |
1,90 |
1,71 |
1,82 |
1,86 |
|
|
Generated resources / Total creditors: |
0,06 |
0,05 |
0,09 |
0,20 |
0,19 |
|
|
Efficiency |
2012 |
2011 |
2010 |
2009 |
2008 |
|
|
Productivity: |
1,20 |
1,25 |
1,51 |
2,07 |
1,78 |
|
|
Turnover of Collection Rights : |
15,73 |
14,09 |
17,62 |
22,42 |
20,28 |
|
|
Turnover of Payment Entitlements: |
10,47 |
9,19 |
6,16 |
7,44 |
8,70 |
|
|
Stock rotation: |
8,42 |
11,85 |
7,99 |
10,64 |
5,37 |
|
|
Assets turnover: |
4,45 |
4,78 |
4,29 |
5,40 |
3,61 |
|
|
Borrowing Cost: |
2,65 |
1,99 |
0,80 |
0,46 |
1,82 |
|
COMPARATIVE
SECTORIAL BALANCE
|
|
|
Sector-based Comparison under the rules of the New General Accounting
Plan.
|
|
Variación - |
|
|
|
Empresa |
Sector |
|
|
Variación - |
|
|
|
Empresa |
Sector |
|
|
Variación - |
|
|
|
Empresa |
Sector |
News
|
Farodevigo.es |
19/10/2012 |
|
Calvo compra Eureka y una firma de los Lago con
Peña |
|
|
Companies related |
|
|
COSWINGA SL |
|
Public
Tenders and Works Won
No Public Tenders assigned to the name of the company.
Detail of Subsidies appearing in Balances Memories
|
Entity |
ORGANISMO NO ESPECIFICADO |
|
Subsidy Concept |
Subvención de capital. |
|
Status |
CONCEDIDA |
|
Amount Granted |
7.113.202,00 |
|
Notes |
El importe es el concedido. Se imputan a resultados 138.833 euros y el
saldo al cierre es de 392.766 euros. |
|
Entity |
ORGANISMO NO ESPECIFICADO |
|
Subsidy Concept |
Subvención de capital. |
|
Status |
CONCEDIDA |
|
Amount Granted |
68.614,00 |
|
Notes |
Efecto impositivo. |
|
Entity |
ORGANISMO NO ESPECIFICADO |
|
Subsidy Concept |
Subvención de capital. |
|
Status |
CONCEDIDA |
|
Amount Granted |
75.526,00 |
|
Notes |
. |
|
Entity |
ORGANISMO NO ESPECIFICADO |
|
Subsidy Concept |
Subvención de capital. |
|
Status |
CONCEDIDA |
|
Amount Granted |
313.751,00 |
|
Notes |
Dicho importe corresponde al traspasado a resultados del ejercicio,
quedando a fecha de cierre pendiente de imputar 708.448,00 euros. En el
ejercicio actual se ha concedido una subvención por parte de CONSELLERIA DO
MAR DE LA XUNTA DE GALICIA por importe de 456.350,00 euros. |
|
Entity |
XUNTA DE GALICIA |
|
Subsidy Concept |
Subvención de capital |
|
Status |
CONCEDIDA |
|
Amount Granted |
6.656.852,00 |
|
Notes |
El importe imputado a resultados en el ejercicio es de 664.711 euros
quedando un saldo pendiente de imputar de 1.942.213 euros. Las subvenciones
recibidas proceden de distintos organismos públicos tanto nacionales como
comunitarios y financian la adquisición de determinados bienes de
inmovilizado, estando a 31/12/2006 pendiente de cobro subvenciones de capital
por importe de 449.024 euros. |
|
Entity |
XUNTA DE GALICIA |
|
Status |
CONCEDIDA |
|
Amount Granted |
2.089.042,00 |
Research
Summary
|
The company was incorporated in Coruña in 1997.
It is engaged in the manufacture and sale of preserved fish and other
prepared food products. Its incomes have been increased by 27% during 2012,
however this commercial effort has reduced margins significantly, as it has
not been possible to transfer to the market the significant increase
experienced by the main raw material (tuna) It has a very good scope for
action, so that the guarantees of its current creditors are well covered and
therefore the company can comply with its short-term payment obligations. It
has an optimum level of debt, plus the favorable relation between its fixed
assets and external funding that allows the company to comply with its
payment obligations. |
FOREIGN EXCHANGE RATES
|
Currency |
Unit
|
Indian Rupees |
|
US Dollar |
1 |
Rs.62.58 |
|
|
1 |
Rs.101.42 |
|
Euro |
1 |
Rs.84.70 |
INFORMATION DETAILS
|
Report Prepared
by : |
SDA |
RATING EXPLANATIONS
|
RATING |
STATUS |
PROPOSED CREDIT LINE |
|
|
>86 |
Aaa |
Possesses an extremely sound financial base with the strongest
capability for timely payment of interest and principal sums |
Unlimited |
|
71-85 |
Aa |
Possesses adequate working capital. No caution needed for credit
transaction. It has above average (strong) capability for payment of interest
and principal sums |
Large |
|
56-70 |
A |
Financial & operational base are regarded healthy. General
unfavourable factors will not cause fatal effect. Satisfactory capability for
payment of interest and principal sums |
Fairly Large |
|
41-55 |
Ba |
Overall
operation is considered normal. Capable to meet normal commitments. |
Satisfactory |
|
26-40 |
B |
Capability to overcome financial difficulties seems comparatively
below average. |
Small |
|
11-25 |
Ca |
Adverse factors are apparent. Repayment of interest and principal sums
in default or expected to be in default upon maturity |
Limited with
full security |
|
<10 |
C |
Absolute credit risk exists. Caution needed to be exercised |
Credit not
recommended |
|
---- |
NB |
New Business |
---- |
This score serves as a reference to assess SC’s credit risk
and to set the amount of credit to be extended. It is calculated from a
composite of weighted scores obtained from each of the major sections of this
report. The assessed factors and their relative weights (as indicated through
%) are as follows:
Financial
condition (40%) Ownership
background (20%) Payment
record (10%)
Credit history
(10%) Market trend
(10%) Operational
size (10%)
This report is issued at your request without any
risk and responsibility on the part of MIRA INFORM PRIVATE LIMITED (MIPL)
or its officials.