MIRA
INFORM REPORT
|
Report Date : |
04.10.2013 |
IDENTIFICATION DETAILS
|
Name : |
PROXY MARKET |
|
|
|
|
Registered Office : |
28 Rue Le Titien ‑ Val Fleuri, Maarif, Casablanca |
|
|
|
|
Country : |
Morocco |
|
|
|
|
Financials (as on) : |
31.12.2011 |
|
|
|
|
Date of Incorporation : |
18.01.2007 |
|
|
|
|
Com. Reg. No.: |
159527 |
|
|
|
|
Legal Form : |
Societe A Responsibilite Limitee |
|
|
|
|
Line of Business : |
importer and distributor of catering disposable products, food and drink packaging and hygiene products |
|
|
|
|
No. of Employees : |
20 |
RATING & COMMENTS
|
MIRA’s Rating : |
B |
|
RATING |
STATUS |
PROPOSED CREDIT LINE |
|
|
26-40 |
B |
Capability to overcome financial difficulties seems comparatively
below average. |
Small |
|
Status : |
Moderate |
|
|
|
|
Payment Behaviour : |
No Complaints |
|
|
|
|
Litigation : |
Clear |
NOTES :
Any query related to this report can be made
on e-mail: infodept@mirainform.com
while quoting report number, name and date.
ECGC Country Risk Classification List – March 31st, 2013
|
Country Name |
Previous Rating (31.12.2012) |
Current Rating (31.03.2013) |
|
Morocco |
A2 |
A2 |
|
Risk Category |
ECGC
Classification |
|
Insignificant |
A1 |
|
Low |
A2 |
|
Moderate |
B1 |
|
High |
B2 |
|
Very High |
C1 |
|
Restricted |
C2 |
|
Off-credit |
D |
morocco ECONOMIC OVERVIEW
Morocco has
capitalized on its proximity to Europe and relatively low labor costs to build
a diverse, open, market-oriented economy. In the 1980s Morocco was a heavily
indebted country before pursuing austerity measures and pro-market reforms,
overseen by the IMF. Since taking the throne in 1999, King MOHAMMED VI has
presided over a stable economy marked by steady growth, low inflation, and
gradually falling unemployment, although a poor harvest and economic
difficulties in Europe contributed to an economic slowdown in 2012. Industrial
development strategies and infrastructure improvements - most visibly
illustrated by a new port and free trade zone near Tangier - are improving
Morocco's competitiveness. Morocco also seeks to expand its renewable energy
capacity with a goal of making renewable 40% of electricity output by 2020. Key
sectors of the economy include agriculture, tourism, phosphates, textiles,
apparel, and subcomponents. To boost exports, Morocco entered into a bilateral
Free Trade Agreement with the United States in 2006 and an Advanced Status
agreement with the European Union in 2008. Despite Morocco's economic progress,
the country suffers from high unemployment, poverty, and illiteracy,
particularly in rural areas. In 2011 and 2012, high prices on fuel - which is
subsidized and almost entirely imported - strained the government''s budget and
widened the country''s current account deficit. Key economic challenges for
Morocco include fighting corruption and reforming the education system, the
judiciary, and the government''s costly subsidy program.
|
Source : CIA |
Company name
PROXY MARKET
Rating Briefing
Payment Record: UNDETERMINED
This rating is based on available data. In the event of additional
information a possibility for a different rating applies.
Registration Briefing
Registration Number: 159527
Registration Date: 18/01/2007
Legal Form: SOCIETE A RESPONSIBILITE LIMITEE
Latest Financials: December 31, 2011
Financial Briefing
Nominal Capital: 1,000,000 Moroccan Dirham
Issued Capital: N/A
Turnover: 14,552,263 Moroccan Dirham
Net Profit: 190,403 Moroccan Dirham
Net Worth: 1,299,136 Moroccan Dirham
Company Details
Company Name: PROXY
MARKET
Headquarter Address: 28
Rue Le Titien ‑ Val Fleuri,
Maarif,
Casablanca,
Morocco
Telephone: +212522
361385
+212522 951854
Fax: +212522
365272
E‑Mail: proxymarket@menara.ma
Web Site: www.proxymarketmaroc.com
Company was originally started on 18/01/2007
Registration & Legal Details
Current Legal Form: SOCIETE
A RESPONSIBILITE LIMITEE
Registration Address: 14
Rue Abou Omar El Harit N° 1,
Casablanca
Registration Number: 159527
Registration Date: 18/01/2007
Year/Date Company Established: 18/01/2007
Registration Town: Casablanca
Tax Registration Number: 02203871
Capital
Currency: Moroccan
Dirham
Authorized Capital: 1,000,000
Paid Up Capital: 1,000,000
Start up Capital:
100,000
Capital to increase to:
900,000
Capital increase on 09/2009 to 900,000
Authorized Capital Breakdown
Number
of Shares: 10,000 Type
of Shares: None Selected
Issued
Shares: 10,000 Value
per share: MDH 100.00
Value
of this type: 1,000,000.00
Shareholders / Owners
Shareholders:
Name/Other Information Shares Held % of
Voting/Non‑Voting
capital
Mr. Amine Bennis, 3,334 33.34%
(VOTING)
Casablanca,
Morocco
Mr. Youssef Bennis, 3,333 33.33%
(VOTING)
Casablanca,
Morocco
Ms. Nouha Bennis, 3,333 33.33%
(VOTING)
Casablanca,
Morocco
Principals
Name: Mr
Saad Bennis
Position within the company: General Manager
Date of Birth: 18/06/1964
Country of Birth: Morocco
Nationality: Moroccan
Can fluently speak: Arabic,
French & English
Name: Mr
Lahcen Bouchghoul
Position within the company: Purchasing Manager
Country of Birth: Morocco
Nationality: Moroccan
Can fluently speak: Arabic
& French
Name: Ms
Zina Mechkour
Position within the company: Accountant
Country of Birth: Morocco
Nationality: Moroccan
Can fluently speak: Arabic
& French
Company Activities
NACE
Codes: 4676 Wholesale of other intermediate
products
The Company
PROXY MARKET is specialized in importing and distribution of catering
disposable products, food and drink packaging and hygiene products.
Local Reporters
consider the investigated company to be MEDIUM in their field of concern.
Operations
Employees Company Employs: 20
HQ Premises Operates from: Owned
Offices , Showroom
Premises Size: 480
square meters
Location: Central
Business Area
Branches 7 Rue Belaamane,
Hay Erraha,
Casablanca,
Morocco
Branch is: Rented
Description of branch: Warehouse
Branch premises size: 280.00 sq.mtrs.
Imports
Import % and type of product: 90% Finished Goods
Imports From: United
Arab Emirates, Egypt, France,
Turkey,
Tunisia
Importing Terms: Cash
against documents
Exports
Export
% and type of product: Subject
does not export
Trading
& Selling
Territory: 100%
Nationally
Type of Customer: Caterers,
Fast Food, Hotels,
Restaurants
Number of accounts:
500
Vehicles: Total
number of vehicles: 10
3 vans
7 cars
Related Companies
Subsidiaries
Affiliates
Information
on Related Companies is not available/applicable
Bankers
Société
Générale,
Branch: 2
Mars
Rue Abdeslam
Khattabi Angle Avenue 2 Mars,
Casablanca,
Morocco
Charges Registered
Date of charge Beneficiary
of the charge Amount secured Description of
Registered
by the charge Charge
01/10/2012 Société Générale MDH 1,300,000 Mortgage
09/09/2011 Crédit Agricole MDH 4,000,000 Mortgage
Financial Information
Source: Companies
Registry
Figures
are: Official
Figures
Currency: Moroccan
Dirham
Months Sales Figures Sales Gross
Profit/Loss Net
Profit/Loss
12 31/12/2011 14,552,263 299,546 190,403
12 31/12/2010 11,724,792 195,823 133,653
12 31/12/2009 10,854,047 59,292 29,362
12 31/12/2008 6,954,862 (12,936) (12,936)
Balance Sheet & Profit &
Loss
BALANCE
SHEET
As at: 31‑Dec‑2011 As at: 31‑Dec‑2010 As at: 31‑Dec‑2009
Fixed Assets
Land
& Buildings 2,020,833 2,145,833 2,270,833
Plant & Machinery
Furniture
& Equipment 52,245 41,187 20,020
Motor
Vehicles 353,889 500,718 400,504
Misc. Fixed Assets
Total Fixed Assets 2,426,967 2,687,738 2,691,357
Financial Assets
Shares in Related Companies
Loans to related companies
Investments
Deposits
Misc. Financial Assets
Total Financial Assets 0 0 0
Intangibles
Goodwill
Organisational Expenses
Patents
Misc. Intangible Assets
Total Intangible Assets 0 0 0
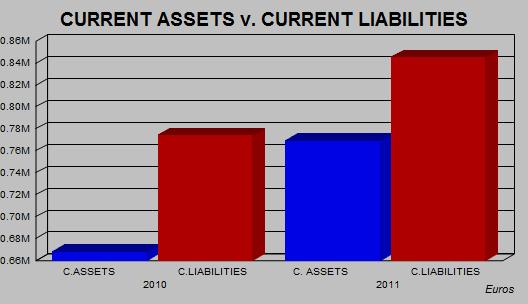
Current Assets
Stock 1,012,490 1,013,698 386,459
Stock & Work in Progress
Trade
Debtors & receivables 6,199,120 5,119,836 4,292,474
Provision for bad debs
Other
receivables 1,183,136 1,139,785 635,378
Due from related companies
Owed by shareholders
Prepaid expenses
Cash 361,001 326,662 56,508
Tax recoverable
Marketable Securities
Misc. Current Assets 2,120,464
Total Current Assets 8,755,747 7,599,981 7,491,283
Total Assets 11,182,714 10,287,719 10,182,640
Owner's Equity & Liabilities
Issued
and paid up capital 1,000,000 1,000,000 1,000,000
Share premium account
Retained
earnings 108,733 ‑24,920 ‑54,283
Net
profit/Loss for the year 190,403 133,653 29,362
Revaluation reserves
Legal Reserves
Other reserves
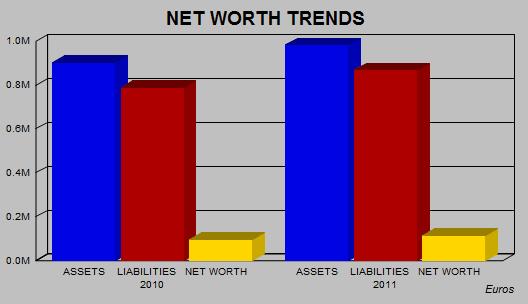
Net
Worth 1,299,136 1,108,733 975,079
Deffered Taxation
Provisions/allowances
Mortgages/Loans 264,345 369,481 349,006
Hire purchase
Due to group of companies
Minority interest
Misc. deferred liabilities
Total Long Term Liabilities 264,345 369,481 349,006
Current Liabilities
Creditors 1,036,981 268,429 820,891
Other
creditors 1,518,690 1,434,106 861,167
Accruals
Bank
overdrafts/Loans 7,056,034 6,996,573 6,999,079
Misc. Loans
Directors accounts
Owing
to shareholders 7,528 110,397 177,418
Owing to related companies
Proposed dividend
Long Term‑due 1 year
Hire Purchase‑under 1 year
Taxation
Advance receipts
Misc. Current Liabilities
Total Current Liabilities 9,619,233 8,809,505 8,858,555
Owner's Equity & Liabilities 11,182,714 10,287,719 10,182,640
PROFIT &
LOSS
Figures are: Figures are: Figures
are:
Fiscal Year Fiscal
Year Fiscal
Year
01/01/2011 to 31/12/2011 01/01/2010 to 31/12/2010 01/01/2009 to 31/12/2009
Total
Income/Turnover 14,552,263 11,724,792 10,854,047
Cost
of sales 12,653,446 10,184,913 8,913,768
Gross
Profit/(Loss) 1,898,817 1,539,879 1,940,279
Admin/selling
expenses 134,697 172,637 178,798
Services 768,598 587,942 539,079
Salaries 369,370 217,300 132,956
Auditors
Fee 571 7 33,600
Stock Depreciation
Depreciation 278,021 240,594 195,959
Misc. Operating Expenses
Misc. Operating Income
Net Operating Profit/(Loss) 347,560 321,399 859,887
Interest Receivable/Finance Income
Group related income
Misc.
Financial Income 754 111,487
Total
Financial Income 0 754 111,487
Interest
Payable/Finance costs 48,009 126,220 833,335
Misc.
financial expenses 5 110 78,747
Total
Financial Expenses 48,014 126,330 912,082
Profit/(Loss)
before taxes 299,546 195,823 59,292
Income
Tax 109,143 62,170 29,930
Other Tax
Profit/(Loss)
after taxes 190,403 133,653 29,362
Extraordinary items
Exceptional items
Misc. Items
Net
Profit/(Loss) 190,403 133,653 29,362
Previous years retained earnings
Current
years net income 190,403 133,653 29,362
Misc. additions in current year
Current years net loss
Dividends in current year
Withdrawals in current year
Misc. deductions in current year
Retained earnings at end of 190,403 133,653 29,362
financial period
Average employees
Directors fee
Earnings per share
Earnings per share‑previous year
Auditors Comments
Accounts
obtained from: Companies registry
Auditors
Opinion: The audited financial statement gives a true and fair view
of the state of
affairs
of the subject
Financial Statements have been prepared on an on‑going
basis.
Assuming support of: shareholders
FINANCIAL RATIOS / COMPARATIVE
DATA
Actual Company Industrial Averages Actual
Company Industrial Averages
Results (2011) (2011) Results
(2010) (2010)
Liquidity Ratios
Current
Ratio 0.91 1.64 0.86 1.52
Acid
Test Ratio 0.80 1.05 0.75 1.00
Accounts
0.07 0.37 0.02 0.41
Payable/Sales Ratio
Current
Liabilities/Net 7.40 2.27 7.95 4.28
Worth
Total
Liabilities/Net 7.61 1.86 8.28 4.44
Worth
Fixed
Assets/Net 186.81 17.67 242.42 41.18
Worth (%)
Profitability Ratios
Gross
Profit Ratio (%) 13.05 26.24 13.13 25.85
Return
on Capital 19.16 20.54 13.25 22.84
Employed (ROCE)(%)
Net
Profit/Sales (%) 2.06 3.60 1.67 ‑1.16
Return
on Assets (%) 2.68 5.06 1.90 3.93
Efficiency Ratios
Sales/Working
Capital ‑16.85 8.49 ‑9.69 7.42
Assets/Sales(%) 76.85 128.74 87.74 123.47
Shareholders
23.06 32.81 17.66 21.97
Return(%)
Average
Inventory 29.22 190.55 25.09 264.26
Period
Average
Collection 141.95 212.00 146.51 139.22
Period
Leverage Ratios
Capital
Employed 11.20 5.43 10.57 6.83
Capital
Structure (%) 16.91 37.64 25.00 0.50
Number
of 762 762
Companies within the
industry (NACE G)
Statistics based on Wholesale
and retail Wholesale
and retail
NACE(G) trade;repair
of motor trade;repair
of motor
vehicles and vehicles
and
motorcycles motorcycles
The statistical
Industrial Average results are calculated against companies within the database
for the specific country.
INDUSTRY SECTOR COMPARATIVE DATA
Elements Taken Result
for specific RANKING Total Companies Used
company
DATE
OF REGISTRATION 18/01/2007 1247 1482
TOTAL
EMPLOYEES 20 452 1293
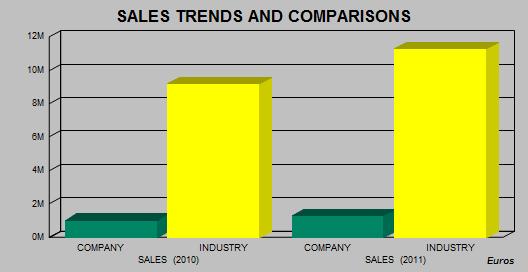
SALES
(2011) 1,279,435 283 493
SALES
(2010) 1,030,844 394 699
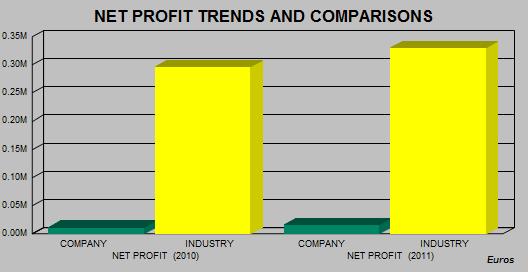
NET
PROFIT (2011) 16,740 293 472
NET
PROFIT (2010) 11,751 456 716
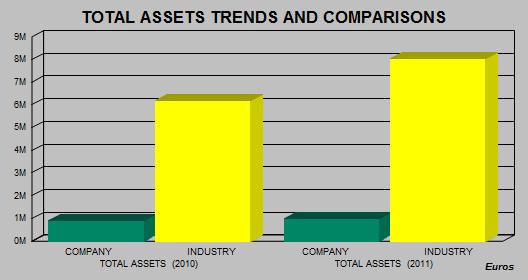
TOTAL
ASSETS (2011) 983,184 272 465
TOTAL
ASSETS (2010) 904,496 394 716
Currency: EUROS
Rankings:
The results given below are
calculated against companies with the Database for the specific country.
Scale: 1 is the highest result
found in our database.
Example: Ranking 5: Total
Companies used to generate the Ranking : 20
This means that this company is
the 5th largest company out of 20 found in our database in the specific
industry
Charts of Financial Trends and Industry Comparisons
PLEASE
NOTE THAT CHARTS ARE SHOWN IN EUROS FOR TREND AND COMPARISON PURPOSES
The statistical
Industrial Average results are calculated against companies within the database
for the specific country.
Payments
Subject's
payments reported to be: UNDETERMINED
Representation
Other Comments
Other Comments: Patent : 37917066
Interview & Reporter Comments
Name/Title: Ms.
Zina Mechkour Accountant
Comment: Latest
Financial Statements are not currently available.
Subject has confirmed the general details provided in the
report but has
declined
to provide any Financial Data.
Reporter
Comment: All legal forms
in Morocco are obliged by law to be registered with the Registry Office
(OMPIC:
Office
Marocain de la Propriete Industrielle et Commerciale) which is publicly
available.
Subject was found registered and Information obtained from
above official source is as
follows
:
Registered
name / registration number / date of registration / registered address / legal
form / capital / main principals – administrators / shareholders / shareholders
% / financial information.
According
to the Morocco Commercial Law, all legal forms except for proprietorship
entities are obliged to file their financial accounts to the OMPIC. However,
the subject latest financial statements are not yet available.
Any other
data stated in the report was obtained directly from the subject company and/or
other publicly available information. Therefore it should be used as a point of
reference as it is not possible to verify such data with official sources.
Conclusions
Local Reputation: The company
being investigated is considered by local reporters to be a Fair /
Normal Trade Risk.
Owner/Shareholders Comments: The owners / shareholders do not have an active
role in the running of the
business.
Financial Results Trend: Financial Information
indicates that the business activities of the company are
showing an upward turn.
Age of Business: The company
is a long established family run business.
Country Intelligence Information
Country: Morocco
Date: 20/08/2013 00:00:00
Source: "Economist
Intelligence Unit" ‑ The Economist
Risk: Last
Updated: 07/08/2013
Sovereign risk
Morocco’s fiscal account will remain deeply in deficit,
owing to high recurrent expenditure on
subsidies and wages. With new lending available on
reasonable terms, much of it concessional,
and a slight
improvement in the country's external position, debt‑service payments
will remain
manageable.
Currency risk
The
current exchange‑rate system—a managed float—will be maintained, with the
Moroccan dirham weakening slightly in 2013 against a stronger euro. A
US$6.2bn precautionary credit line from the IMF in 2012 and a US$1.5bn bond
issuance in December 2012, which has boosted foreign reserves, will increase
confidence in the dirham.
Banking sector risk
The banking sector has benefited from prudential
regulation, relatively low levels of
non‑performing
loans and limited direct foreign exposure. But heavy government borrowing from
the banks to fund a large fiscal deficit will remain a concern. The government
is keen to widen Islamic finance options.
Political risk
The government will maintain high public spending in the
short term to quell political and social
protests
over unemployment, corruption and poverty. Tensions over the disputed territory
of Western Sahara may also lead to violent demonstrations, but a military
conflict is unlikely.
Economic structure risk
A
reliance on agriculture leaves the economy vulnerable to adverse weather conditions.
The fiscal and external deficits fluctuate in line with movements in commodity
prices and external performance is heavily dependent on European demand.
FOREIGN EXCHANGE RATES
|
Currency |
Unit
|
Indian Rupees |
|
US Dollar |
1 |
Rs.61.93 |
|
|
1 |
Rs.100.44 |
|
Euro |
1 |
Rs.84.24 |
INFORMATION DETAILS
|
Report
Prepared by : |
MNL |
RATING EXPLANATIONS
|
RATING |
STATUS |
PROPOSED CREDIT LINE |
|
|
>86 |
Aaa |
Possesses an extremely sound financial base with the strongest capability
for timely payment of interest and principal sums |
Unlimited |
|
71-85 |
Aa |
Possesses adequate working capital. No caution needed for credit
transaction. It has above average (strong) capability for payment of interest
and principal sums |
Large |
|
56-70 |
A |
Financial & operational base are regarded healthy. General
unfavourable factors will not cause fatal effect. Satisfactory capability for
payment of interest and principal sums |
Fairly Large |
|
41-55 |
Ba |
Overall operation is considered normal. Capable to meet normal
commitments. |
Satisfactory |
|
26-40 |
B |
Capability to
overcome financial difficulties seems comparatively below average. |
Small |
|
11-25 |
Ca |
Adverse factors are apparent. Repayment of interest and principal sums
in default or expected to be in default upon maturity |
Limited with
full security |
|
<10 |
C |
Absolute credit risk exists. Caution needed to be exercised |
Credit not
recommended |
|
-- |
NB |
New Business |
-- |
This score serves as a reference to assess SC’s credit risk
and to set the amount of credit to be extended. It is calculated from a
composite of weighted scores obtained from each of the major sections of this
report. The assessed factors and their relative weights (as indicated through
%) are as follows:
Financial
condition (40%) Ownership
background (20%) Payment
record (10%)
Credit history (10%) Market trend (10%) Operational size
(10%)
This report is issued at your request without any
risk and responsibility on the part of MIRA INFORM PRIVATE LIMITED (MIPL)
or its officials.