MIRA
INFORM REPORT
|
Report Date : |
09.10.2013 |
IDENTIFICATION DETAILS
|
Name : |
BIGDIL SARL |
|
|
|
|
Registered Office : |
149 Avenue Mohamed V ‑ Gueliz,
Marrakech |
|
|
|
|
Country : |
Morocco |
|
|
|
|
Financials (as on) : |
31.12.2012 |
|
|
|
|
Date of Incorporation : |
2000 |
|
|
|
|
Com. Reg. No.: |
14537 |
|
|
|
|
Legal Form : |
Societe A Responsibilite Limitee |
|
|
|
|
Line of Business : |
Wholesale of watches and jewellery |
|
|
|
|
No. of Employees : |
135 |
RATING & COMMENTS
|
MIRA’s Rating : |
Ba |
|
RATING |
STATUS |
PROPOSED CREDIT LINE |
|
|
41-55 |
Ba |
Overall operation is considered normal. Capable to meet normal
commitments. |
Satisfactory |
|
Status : |
Satisfactory |
|
|
|
|
Payment Behaviour : |
No Complaints |
|
|
|
|
Litigation : |
Clear |
NOTES:
Any query related to this report can be made
on e-mail: infodept@mirainform.com
while quoting report number, name and date.
ECGC Country Risk Classification List – March, 31st, 2013
|
Country Name |
Previous Rating (31.12.2012) |
Current Rating (31.03.2013) |
|
Morocco |
A2 |
A2 |
|
Risk Category |
ECGC
Classification |
|
Insignificant |
A1 |
|
Low |
A2 |
|
Moderate |
B1 |
|
High |
B2 |
|
Very High |
C1 |
|
Restricted |
C2 |
|
Off-credit |
D |
MOROCCO - ECONOMIC OVERVIEW
Morocco has capitalized on its proximity to Europe and
relatively low labor costs to build a diverse, open, market-oriented economy.
In the 1980s Morocco was a heavily indebted country before pursuing austerity
measures and pro-market reforms, overseen by the IMF. Since taking the throne
in 1999, King MOHAMMED VI has presided over a stable economy marked by steady
growth, low inflation, and gradually falling unemployment, although a poor
harvest and economic difficulties in Europe contributed to an economic slowdown
in 2012. Industrial development strategies and infrastructure improvements - most
visibly illustrated by a new port and free trade zone near Tangier - are
improving Morocco's competitiveness. Morocco also seeks to expand its renewable
energy capacity with a goal of making renewable 40% of electricity output by
2020. Key sectors of the economy include agriculture, tourism, phosphates,
textiles, apparel, and subcomponents. To boost exports, Morocco entered into a
bilateral Free Trade Agreement with the United States in 2006 and an Advanced
Status agreement with the European Union in 2008. Despite Morocco's economic
progress, the country suffers from high unemployment, poverty, and illiteracy,
particularly in rural areas. In 2011 and 2012, high prices on fuel - which is
subsidized and almost entirely imported - strained the government''s budget and
widened the country''s current account deficit. Key economic challenges for
Morocco include fighting corruption and reforming the education system, the
judiciary, and the government''s costly subsidy program.
|
Source
: CIA |
company name
BIGDIL SARL
Rating Briefing
Definition: FAIR CREDIT QUALITY
Payment Record: UNDETERMINED
This rating is based on available data. In
the event of additional information a possibility for a different rating
applies.
Registration
Briefing
Registration Number: 14537
Registration Date: 15/07/2002
Legal Form: SOCIETE A
RESPONSIBILITE LIMITEE
Latest Financials: December 31, 2012
Financial Briefing
Nominal Capital: 4,501,000 Moroccan Dirham
Issued Capital: N/A
Turnover: 33,631,468
Moroccan Dirham
Net Profit: 1,200,033 Moroccan
Dirham
Net Worth: 10,537,699
Moroccan Dirham
Original Investigation Details
Company Name: BIGDIL SARL
Country: MO
Street Name: 75 QU INDUATRIEL SIDIL GHANEM
City Code: CASABLANCA
Company Details
Company Name: BIGDIL SARL
Headquarter Address: 75 Quartier Industriel Sidi Ghanem,
Marrakech,
Morocco
Telephone: +212524 336158
+212524 336159
+212524 420854
Fax: +212524 336189
+212524 336935
E‑Mail: contact@bigdilmaroc.com
Web Site: www.bigdilmaroc.com
Company was
originally started on 2000
Registration & Legal Details
Current Legal Form: SOCIETE A
RESPONSIBILITE LIMITEE
Registration Address: 149 Avenue
Mohamed V ‑ Gueliz,
Marrakech
Registration Number: 14537
Registration Date: 15/07/2002
Year/Date Company Established:2000
Registration Town: Marrakech
Tax Registration Number: 01005010
Capital
Currency: Moroccan Dirham
Authorized Capital: 4,501,000
Paid Up Capital: 4,501,000
Authorized Capital Breakdown
Number of Shares: 45,010 Type of
Shares: None Selected
Issued Shares: 45,010 Value per
share: MDH 100.00 Value of this type:
4,501,000.00
Shareholders / Owners
Parent Company: Groupe SAHAM,
16, Rue Ali Abderrazak ‑ Ex Mirabeau,
Casablanca,
Morocco
% Shares Held: 83.00%
Shareholders:
Name/Other Information Shares Held %
of Voting/Non‑Voting capital
Other
Shareholders, 17.00% (VOTING)
Morocco
Principals
Name: Mr
Mohamed Mouhyi
Position within the company: General Manager
Date of Birth: 30/08/1960
Country of Birth: Morocco
Nationality: Moroccan
Can fluently speak: Arabic &
French
Name: Mr
Abdelkarim Belhaou
Position within the company: Administration & Financial Manager
Additional Information: Email
: a.belhaou@gmail.com
Country of Birth: Morocco
Nationality: Moroccan
Can fluently speak: Arabic &
French
Company Activities
NACE Codes: 4648 Wholesale of watches and jewellery
BIGDIL is a jewelry & accessories
franchise which specialises in sale of fashion accessories including necklaces,
earrings, bracelets, rings, watches, hair accessories, sunglasses...
Local Reporters consider the investigated
company to be MEDIUM in their field of concern.
Operations
Employees Company Employs: 135
HQ Premises Operates from: Offices
Location: Central
Business Area
Other Branches
Subject has numerous other branches
nationally.
Number of Branches: 29
Additional Information: Shops
Imports
Import % and type of product: 100% Finished Goods
Imports From: India,
China, France
Importing Terms: Bank
transfer
Additional Information: Letters
of credit
Brands: BIGDIL
‑
Exports
Export % and type of product: Subject does not export
Trading & Selling
Territory: 100% Nationally
Type of Customer: General Public
Vehicles: Total number of vehicles:
5 cars
Related Companies
Subsidiaries
Affiliates
Information on Related Companies is not
available/applicable
Bankers
Attijariwafa Bank,
Branch: Marrakech
Marjane
Boulevard Abdelkarim El Khattabi, Route de
Casablanca,
Marrakech,
Morocco
Société Générale,
Branch: Principale
Marrakech
238 Avenue Mohamed V,
Marrakech,
Morocco
Banque Populaire,
Branch: Centre
Toubkal
Résidence Les Jardins d'Ocre,
Avenue Mohamed VI,
Marrakech,
Morocco
Financial Information
Financial Interview Date: 07/10/2013
Source: Mr.
Abdelkarim Belhaou Financial Manager
Figures are: Official Figures
Currency: Moroccan Dirham
Months Sales
Figures Sales Gross Profit/Loss Net Profit/Loss
12 31/12/2012 33,631,468 1,369,347 1,200,033
12 31/12/2011 38,786,502 1,676,803 1,440,188
12 31/12/2010 48,767,935 (23,041,767) (23,340,106)
12 31/12/2009 52,797,474 382,527 105,562
Balance Sheet & Profit &
Loss
BALANCE SHEET
|
|
As at: 31‑Dec‑2012 |
As at: 31‑Dec‑2011 |
As at: 31‑Dec‑2010 |
|
Fixed
Assets |
|
|
|
|
Land &
Buildings |
|
|
|
|
Plant &
Machinery |
81,442 |
36,078 |
153,769 |
|
Furniture
& Equipment |
4,225,952 |
4,736,113 |
6,551,059 |
|
Motor Vehicles |
430 |
3,827 |
7,848 |
|
Misc. Fixed
Assets |
775,926 |
169,782 |
236,419 |
|
Total Fixed
Assets |
5,083,750 |
4,945,800 |
6,949,095 |
|
Financial
Assets |
|
|
|
|
Shares in
Related Companies |
67,500 |
37,500 |
3,837,400 |
|
Loans to related
companies |
|
|
|
|
Investments |
|
|
|
|
Deposits |
|
|
|
|
Misc.
Financial Assets |
598,467 |
199,063 |
280,963 |
|
Total
Financial Assets |
665,967 |
236,563 |
4,118,363 |
|
Intangibles |
|
|
|
|
Goodwill |
8,167,101 |
8,767,101 |
16,149,601 |
|
Organisational
Expenses |
46,637 |
82,126 |
193,367 |
|
Patents |
63,177 |
219,506 |
470,493 |
|
Misc.
Intangible Assets |
|
|
|
|
Total
Intangible Assets |
8,276,915 |
9,068,733 |
16,813,461 |
|
Current
Assets |
|
|
|
|
Stock |
23,569,804 |
19,237,097 |
12,252,587 |
|
Stock &
Work in Progress |
|
|
|
|
Trade Debtors
& receivables |
2,038,442 |
9,295,607 |
16,502,432 |
|
Provision for
bad debs |
|
|
|
|
Other
receivables |
7,078,147 |
8,413,591 |
16,589,263 |
|
Due from
related companies |
|
|
|
|
Owed by
shareholders |
|
|
|
|
Prepaid
expenses |
784,486 |
1,221,185 |
429,297 |
|
Cash |
951,338 |
5,219,279 |
3,431,147 |
|
Tax
recoverable |
2,005,617 |
4,226,804 |
5,100,752 |
|
Marketable
Securities |
|
|
|
|
Misc. Current
Assets |
423,950 |
404,202 |
204,132 |
|
Total
Current Assets |
36,851,784 |
48,017,765 |
54,509,610 |
|
Total
Assets |
50,878,416 |
62,268,861 |
82,390,529 |
|
Owner's
Equity & Liabilities |
|
|
|
|
Issued and
paid up capital |
4,501,000 |
3,472,200 |
13,888,800 |
|
Share premium
account |
286,752 |
4,916,352 |
4,916,352 |
|
Retained
earnings |
1,087,639 |
‑3,953,350 |
9,132,416 |
|
Net
profit/Loss for the year |
1,200,033 |
1,440,188 |
‑23,340,106 |
|
Revaluation
reserves |
|
|
|
|
Legal Reserves |
816,182 |
816,182 |
816,182 |
|
Other reserves |
2,646,093 |
2,646,093 |
2,483,834 |
|
Net Worth |
10,537,699 |
9,337,665 |
7,897,478 |
|
Deffered
Taxation |
|
|
|
|
Provisions/allowances |
|
|
|
|
Mortgages/Loans |
17,447,744 |
13,541,667 |
17,708,333 |
|
Hire purchase |
|
|
|
|
Due to group
of companies |
|
|
|
|
Minority
interest |
|
|
|
|
Misc. deferred
liabilities |
|
|
|
|
Total Long
Term Liabilities |
17,447,744 |
13,541,667 |
17,708,333 |
|
Current
Liabilities |
|
|
|
|
Creditors |
9,619,548 |
18,009,183 |
18,034,507 |
|
Other
creditors |
145,198 |
79,103 |
2,493 |
|
Accruals |
412,783 |
|
|
|
Bank
overdrafts/Loans |
10,647,536 |
16,145,698 |
25,073,274 |
|
Misc. Loans |
|
|
|
|
Directors
accounts |
|
|
|
|
Owing to
shareholders |
1,650,000 |
2,000,000 |
9,722,595 |
|
Owing to
related companies |
|
|
|
|
Proposed
dividend |
|
|
|
|
Long Term‑due
1 year |
|
|
|
|
Hire Purchase‑under
1 year |
|
|
|
|
Taxation |
426,344 |
2,548,202 |
3,101,350 |
|
Advance receipts |
2,281 |
4,916 |
|
|
Misc. Current
Liabilities |
402,066 |
602,427 |
437,716 |
|
Total
Current Liabilities |
22,892,973 |
39,389,529 |
56,784,718 |
|
Owner's
Equity & Liabilities |
50,878,416 |
62,268,861 |
82,390,529 |
PROFIT &
LOSS
|
|
Figures are: Fiscal Year 01/01/2012 to 31/12/2012 |
Figures are: Fiscal Year 01/01/2011 to 31/12/2011 |
Figures are: Fiscal Year 01/01/2010 to 31/12/2010 |
|
Total Income/Turnover |
33,631,468 |
38,786,502 |
48,767,935 |
|
Cost of sales |
12,227,835 |
14,464,278 |
27,922,605 |
|
|
|
|
|
|
Gross Profit/(Loss) |
21,403,633 |
24,322,224 |
20,845,330 |
|
Admin/selling expenses |
1,852,123 |
1,887,926 |
2,974,629 |
|
Services |
7,256,030 |
9,614,674 |
15,330,090 |
|
Salaries |
7,146,801 |
9,566,525 |
13,706,504 |
|
Auditors Fee |
767,539 |
793,730 |
566,393 |
|
Stock Depreciation |
|
|
|
|
Depreciation |
1,421,709 |
2,061,906 |
2,602,489 |
|
Misc. Operating Expenses |
193 |
211 |
|
|
Misc. Operating Income |
97,614 |
233,863 |
3,359,507 |
|
Net Operating Profit/(Loss) |
3,057,045 |
631,133 |
‑10,975,479 |
|
Interest Receivable/Finance Income |
|
|
|
|
Group related income |
|
|
|
|
Misc. Financial Income |
1,752,713 |
26,195,995 |
11,549,579 |
|
Total Financial Income |
1,752,713 |
26,195,995 |
11,549,579 |
|
Interest Payable/Finance costs |
2,280,703 |
2,549,174 |
3,627,574 |
|
Misc. financial expenses |
1,159,708 |
22,601,151 |
19,988,293 |
|
Total Financial Expenses |
3,440,411 |
25,150,325 |
23,615,867 |
|
Profit/(Loss) before taxes |
1,369,347 |
1,676,803 |
‑23,041,767 |
|
Income Tax |
169,314 |
236,615 |
298,339 |
|
Other Tax |
|
|
|
|
Profit/(Loss) after taxes |
1,200,033 |
1,440,188 |
‑23,340,106 |
|
Extraordinary items |
|
|
|
|
Exceptional items |
|
|
|
|
Misc. Items |
|
|
|
|
|
|
|
|
|
Net Profit/(Loss) |
1,200,033 |
1,440,188 |
‑23,340,106 |
|
|
|
|
|
|
Previous years retained earnings |
|
|
|
|
Current years net income |
1,200,033 |
1,440,188 |
|
|
Misc. additions in current year |
|
|
|
|
Current years net loss |
‑23,340,106 |
|
|
|
Dividends in current year |
|
|
|
|
Withdrawals in current year |
|
|
|
|
Misc. deductions in current year |
|
|
|
|
|
|
|
|
|
Retained earnings at end of |
1,200,033 |
1,440,188 |
‑23,340,106 |
|
financial period |
|
|
|
Average employees
Directors fee
Earnings per share
Earnings per share‑previous year
Auditors Comments
Date accounts
obtained: 07/10/2013
Accounts obtained
from: Subject
Auditors Opinion: The audited
financial statement gives a true and fair view of the state of affairs of the subject
Financial Statements have been prepared on an on‑going basis.
Assuming support of: shareholders
FINANCIAL RATIOS / COMPARATIVE
DATA
Actual Company Industrial Averages Actual
Company Industrial Averages
Results (2012) (2012) Results
(2011) (2011)
Liquidity Ratios
Current
Ratio 1.61 1.43 1.22 1.63
Acid
Test Ratio 0.58 0.96 0.73 1.05
Accounts
0.29 0.45 0.46 0.38
Payable/Sales Ratio
Current
Liabilities/Net 2.17 2.80 4.22 2.27
Worth
Total
Liabilities/Net 3.83 2.92 5.67 1.88
Worth
Fixed
Assets/Net 48.24 13.26 52.97 18.00
Worth (%)
Profitability Ratios
Gross
Profit Ratio (%) 63.64 24.93 62.71 26.42
Return
on Capital 4.89 13.80 7.33 20.26
Employed (ROCE)(%)
Net
Profit/Sales (%) 4.07 4.24 4.32 3.60
Return
on Assets (%) 2.69 5.51 2.69 5.03
Efficiency Ratios
Sales/Working
Capital 2.41 9.75 4.50 8.42
Assets/Sales(%) 151.28 161.57 160.54 131.73
Shareholders
12.99 15.03 17.96 32.32
Return(%)
Average
Inventory 638.89 144.96 397.31 196.34
Period
Average
Collection 61.50 139.89 121.39 211.32
Period
Leverage Ratios
Capital
Employed 14.88 5.33 144.22 5.69
Capital
Structure (%) 62.35 21.33 59.19 37.18
Number
of 477 477
Companies within the
industry (NACE G)
Statistics based on Wholesale
and retail Wholesale
and retail
NACE(G) trade;repair
of motor trade;repair
of motor
vehicles and vehicles
and
motorcycles motorcycles
The statistical
Industrial Average results are calculated against companies within the Rime
database for the specific country.
INDUSTRY SECTOR COMPARATIVE DATA
Elements Taken Result
for specific RANKING Total Companies Used
company
DATE OF REGISTRATION 15/07/2002 916 1486
TOTAL EMPLOYEES 135 60 1296
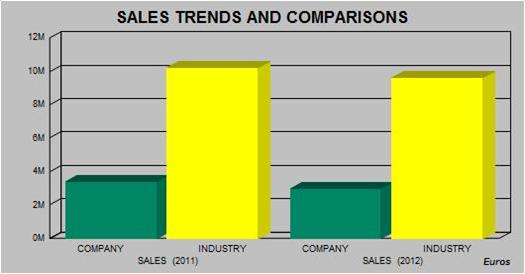
SALES (2012) 2,956,879 66 128
SALES (2011) 3,410,109 166 465
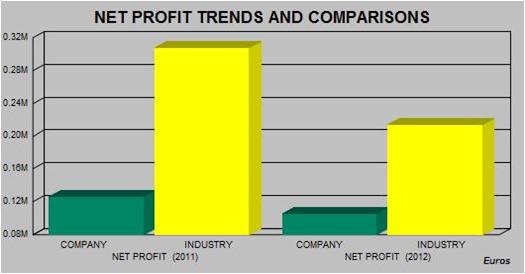
NET PROFIT (2012) 105,507 32 90
NET PROFIT (2011) 126,621 128 473
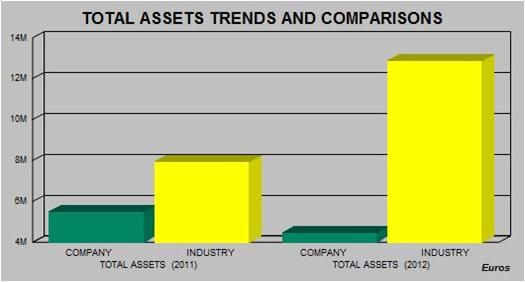
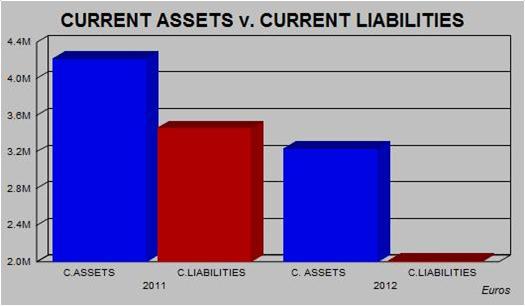
TOTAL ASSETS (2012) 4,473,230 29 82
TOTAL ASSETS (2011) 5,474,678 109 476
Currency: EUROS
Rankings:
The results given below are calculated
against companies with the Rime Database for the specific country.
Scale: 1 is the highest result found in our
database.
Example: Ranking 5: Total Companies used to
generate the Ranking : 20
This means that this company is the 5th
largest company out of 20 found in our database in the specific industry
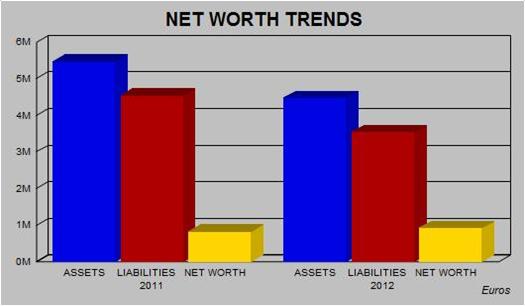
Charts of Financial Trends and
Industry Comparisons
PLEASE NOTE THAT
CHARTS ARE SHOWN IN EUROS FOR TREND AND COMPARISON PURPOSES
The statistical
Industrial Average results are calculated against companies within the Rime
database for the
specific country.
Payments
Subject's payments reported to be: UNDETERMINED
Representation
Other Comments
Other Comments: Patent : 46235752
Interview & Reporter Comments
Name/Title: Mr. Abdelkarim Belhaou Financial
Manager
Comment: Subject has confirmed the general
details shown in the report.
Reporter Comment: All legal
forms in Morocco are obliged by law to be registered with the Registry Office
(OMPIC :Office Marocain De La Propriete Industrielle Et Commerciale) which is
publicly available.
Subject was found
registered and Information obtained from above official source is as follows :
Registered name /
registration number / date of registration
/ registered address / legal form / capital / main principals –
administrators.
Any other data
stated in the report was obtained directly from the subject company and/or
other publicly available information. Therefore it should be used as a point of
reference as it is not possible to verify such data with official sources.
Conclusions
Local Reputation: The company being investigated is considered by local
reporters to be a Fair / Normal
Trade Risk.
General Conclusion: Local informants consider granting of credit to be a fair
trade risk.
Financial Results Trend: Financial Information indicates that the
business activities of the company are
declining in strength.
Age of Business: The company is long established in the local market.
Country Intelligence Information
Country: Morocco
Date: 20/08/2013 00:00:00
Source: "Economist Intelligence
Unit" ‑ The Economist
Risk: Last Updated:
07/08/2013
Sovereign
risk
Morocco’s fiscal account will remain deeply
in deficit, owing to high recurrent expenditure on subsidies and wages. With
new lending available on reasonable terms, much of it concessional, and a
slight improvement in the country's external position, debt‑service
payments will remain manageable.
Currency
risk
The current exchange‑rate system—a
managed float—will be maintained, with the Moroccan dirham weakening slightly
in 2013 against a stronger euro. A US$6.2bn precautionary credit line from the IMF
in 2012 and a US$1.5bn bond issuance in December 2012, which has boosted foreign
reserves, will increase confidence in the dirham.
Banking
sector risk
The banking sector has benefited from
prudential regulation, relatively low levels of non‑performing loans and
limited direct foreign exposure. But heavy government borrowing from the banks
to fund a large fiscal deficit will remain a concern. The government is keen to
widen Islamic finance options.
Political
risk
The government will maintain high public
spending in the short term to quell political and social protests over unemployment,
corruption and poverty. Tensions over the disputed territory of Western Sahara
may also lead to violent demonstrations, but a military conflict is unlikely.
Economic
structure risk
A reliance on agriculture leaves the economy
vulnerable to adverse weather conditions. The fiscal and external deficits
fluctuate in line with movements in commodity prices and external performance
is heavily dependent on European demand.
DIAMOND INDUSTRY – INDIA
-
From time immemorial, India is well known in the world as the birthplace
for diamonds. It is difficult to trace the origin of diamonds but history
says that in the remote past, diamonds were mined only in India. Diamond
production in India can be traced back to almost 8th Century B.C.
India, in fact, remained undisputed leader till 18th Century
when Brazilian fields were discovered in 1725 followed by emergence of S.
Africa, Russia and Australia.
-
The achievement of the Indian diamond industry was possible only due to
combination of the manufacturing skills of the Indian workforce and the
untiring and unflagging efforts of the Indian diamantaires, supported by
progressive Government policies.
-
The area of study of family owned diamond businesses derives its
importance from the huge conglomerate of family run organizations which operate
in the diamond industry since many generations.
-
Some of the basic traits of family run business enterprises include
spirit of entrepreneurship, mutual trust lowers transaction costs, small,
nimble and quick to react, information as a source of advantage and
philanthropy.
-
Family owned diamond businesses need to improve on many fronts including
higher standard of corporate governance, long-term performance – focused
strategies, modern management and technology.
-
Utmost caution is to be exercised while dealing with some medium and
large diamond traders which are usually engaged in fictitious import – export,
inter-company transactions, financially assisted by banks. In the process,
several public sector banks lost several hundred million rupees. They mostly
diverted borrowed money for diamond business into real estate and capital
markets.
-
Excerpts from Times of India dated 30th October 2010 is as
under –
-
Gem & Jewellery Export Promotion Council in its statistical data has
shown the export of polished diamonds to have increase by 28 % in February
2013. Compared to $ 1.4 bn worth of polished diamond export in February, 2012,
India exported $ 1.84 billion worth of polished diamonds in February 2013. A
senior executive of GJEPC said, “Export of cut and polished diamonds started
falling month-wise after the imposition of 2 % of import duty on the polished
diamonds. But February, 2013 has given a new ray of hope to the industry as the
export of polished diamonds has actually increased by 28 %. It means the
industry is on the track of recovery and round tripping of diamonds has
stopped completely.” Demand has started coming from the US, the UK, Japan and
China. India’s polished diamond export is expected to cross $ 21 bn in 2013-14.
-
The banking sector has started exercising restraint while following
prudent risk management norms when lending money to gems and jewellery sector.
This follows the implementation of Basel III accord – a global voluntary
regulatory standard on bank capital adequacy, stress testing and market
liquidity.
FOREIGN EXCHANGE RATES
|
Currency |
Unit
|
Indian Rupees |
|
US Dollar |
1 |
Rs.61.69 |
|
|
1 |
Rs.99.20 |
|
Euro |
1 |
Rs.83.69 |
INFORMATION DETAILS
|
Report Prepared
by : |
SDA |
RATING EXPLANATIONS
|
RATING |
STATUS |
PROPOSED CREDIT LINE |
|
|
>86 |
Aaa |
Possesses an extremely sound financial base with the strongest
capability for timely payment of interest and principal sums |
Unlimited |
|
71-85 |
Aa |
Possesses adequate working capital. No caution needed for credit
transaction. It has above average (strong) capability for payment of interest
and principal sums |
Large |
|
56-70 |
A |
Financial & operational base are regarded healthy. General
unfavourable factors will not cause fatal effect. Satisfactory capability for
payment of interest and principal sums |
Fairly Large |
|
41-55 |
Ba |
Overall
operation is considered normal. Capable to meet normal commitments. |
Satisfactory |
|
26-40 |
B |
Capability to overcome financial difficulties seems comparatively
below average. |
Small |
|
11-25 |
Ca |
Adverse factors are apparent. Repayment of interest and principal sums
in default or expected to be in default upon maturity |
Limited with
full security |
|
<10 |
C |
Absolute credit risk exists. Caution needed to be exercised |
Credit not
recommended |
|
---- |
NB |
New Business |
---- |
This score serves as a reference to assess SC’s credit risk
and to set the amount of credit to be extended. It is calculated from a
composite of weighted scores obtained from each of the major sections of this
report. The assessed factors and their relative weights (as indicated through
%) are as follows:
Financial
condition (40%) Ownership
background (20%) Payment
record (10%)
Credit history
(10%) Market trend
(10%) Operational
size (10%)
This report is issued at your request without any
risk and responsibility on the part of MIRA INFORM PRIVATE LIMITED (MIPL)
or its officials.