MIRA INFORM REPORT
|
Report Date : |
28.10.2013 |
IDENTIFICATION DETAILS
|
Name : |
ASIAN TRAILS LTD. |
|
|
|
|
Registered Office : |
9th Floor, Sg Tower, 161/1 Soi Mahadlek Luang 3, Rajdamri Road, Lumpini, Pathumwan, Bangkok 10330 |
|
|
|
|
Country : |
|
|
|
|
|
Financials (as on) : |
31.12.2012 |
|
|
|
|
Date of Incorporation : |
28.04.1999 |
|
|
|
|
Com. Reg. No.: |
0105542030326 |
|
|
|
|
Legal Form : |
Private Limited Company |
|
|
|
|
Line of Business : |
The subject is
engaged in providing
wide range of
inbound-outbound tours and
travel services. |
|
|
|
|
No. of Employees : |
280 |
RATING & COMMENTS
|
MIRA’s Rating : |
Ba |
|
RATING |
STATUS |
PROPOSED CREDIT LINE |
|
|
41-55 |
Ba |
Overall operation is considered normal. Capable to meet normal
commitments. |
Satisfactory |
|
Status : |
Satisfactory |
|
Payment Behaviour : |
No Complaints |
|
Litigation : |
Clear |
NOTES:
Any query related to this report can be made
on e-mail: infodept@mirainform.com
while quoting report number, name and date.
ECGC Country Risk Classification List – March, 31st, 2013
|
Country Name |
Previous Rating (31.12.2012) |
Current Rating (31.03.2013) |
|
|
B1 |
B1 |
|
Risk Category |
ECGC
Classification |
|
Insignificant |
A1 |
|
Low |
A2 |
|
Moderate |
B1 |
|
High |
B2 |
|
Very High |
C1 |
|
Restricted |
C2 |
|
Off-credit |
D |
With a well-developed infrastructure, a free-enterprise
economy, generally pro-investment policies, and strong export industries,
Thailand achieved steady growth due largely to industrial and agriculture exports
- mostly electronics, agricultural commodities, automobiles and parts, and
processed foods. Thailand is trying to maintain growth by encouraging domestic
consumption and public investment to offset weak exports in 2012. Unemployment,
at less than 1% of the labor force, stands as one of the lowest levels in the
world, which puts upward pressure on wages in some industries. Thailand also
attracts nearly 2.5 million migrant workers from neighboring countries. The
Thai government is implementing a nation-wide 300 baht ($10) per day minimum
wage policy and deploying new tax reforms designed to lower rates on
middle-income earners. The Thai economy has weathered internal and external
economic shocks in recent years. The global economic crisis severely cut Thailand's
exports, with most sectors experiencing double-digit drops. In 2009, the
economy contracted 2.3%. However, in 2010, Thailand's economy expanded 7.8%,
its fastest pace since 1995, as exports rebounded. In late 2011 growth was
interrupted by historic flooding in the industrial areas in Bangkok and its
five surrounding provinces, crippling the manufacturing sector. Industry
recovered from the second quarter of 2012 onward with GDP growth at 5.5% in
2012. The government has approved flood mitigation projects worth $11.7
billion, which were started in 2012, to prevent similar economic damage, and an
additional $75 billion for infrastructure over the next seven years with a plan
to start in 2013.
|
Source
: CIA |
company name
ASIAN TRAILS LTD.
SUMMARY
BUSINESS ADDRESS : 9th
FLOOR, SG TOWER,
161/1
SOI MAHADLEK LUANG
3, RAJDAMRI ROAD,
LUMPINI,
PATHUMWAN,
BANGKOK
10330, THAILAND
TELEPHONE : [66] 2626-2000,
2626-2019
FAX : [66] 2651-8111
E-MAIL ADDRESS : res@asiantrails.org
REGISTRATION ADDRESS : SAME AS BUSINESS
ADDRESS
ESTABLISHED : 1999
REGISTRATION NO. : 0105542030326
TAX ID NO. : 3021009014
CAPITAL REGISTERED : BHT.
24,000,000
CAPITAL PAID-UP : BHT.
24,000,000
SHAREHOLDER’S PROPORTION : THAI
: 51.00%
MAURITIUS :
49.00%
FISCAL YEAR CLOSING DATE : DECEMBER 31
LEGAL STATUS : PRIVATE LIMITED
COMPANY
EXECUTIVE : MR.
LERSAN MISITSAKUL THAI
MANAGING DIRECTOR
NO. OF STAFF : 280
LINES OF BUSINESS : TOURS
AND TRAVEL SERVICES
CORPORATE PROFILE
OPERATING TREND : STABLE
PRESENT SITUATION : OPERATING NORMALLY
REPUTATION : GOOD
WITH NORMAL BUSINESS
ENGAGEMENT
MANAGEMENT STANDARD : MANAGEMENT
WITH GOOD PERFORMANCE
HISTORY
The subject was
established on April
28, 1999 as
a private limited
company under the
registered name ASIAN TRAILS LTD.,
by Thai and
Mauritius groups, with the
business objective to provide
inbound-outbound tours and
travel services both in
Thailand and South
East Asian countries.
It currently employs
approximately 280 staff.
Asian Trails has
the head office
in Bangkok, Thailand
and other network
offices located in
Cambodia, Republic of
China, Indonesia, Laos,
Malaysia, Vietnam and
Myanmar, with over
30 representative offices
in 8 countries
in Asia, operating under
the brand of
“Asian Trails”.
The subject’s registered
address is 9th Floor,
SG Tower, 161/1
Soi Mahadlek Luang
3, Rajdamri Road, Lumpini, Pathumwan, Bangkok 10330, and
this is the
subject’s current operation
address.
THE BOARD OF DIRECTOR
|
Name |
|
Nationality |
Age |
|
|
|
|
|
|
Mr. Lersan Misitsakul |
[-] [x] |
Thai |
64 |
|
Mrs. Sirichit Pruksanubal |
[-] [x] |
Thai |
65 |
|
Mr. Kitti Thongyoo |
|
Thai |
57 |
|
Mr. Stefan Roland Leser |
[x] |
German |
46 |
|
Mr. Christian Markus Akeret |
|
Swiss |
39 |
AUTHORIZED PERSON
Any two of
the mentioned directors
[x] can jointly
sign or both
of the directors
[-] can jointly
sign on behalf
of the subject
with company’s affixed.
MANAGEMENT
Mr. Lersan Misitsakul
is the Managing
Director.
He is Thai
nationality with the
age of 64
years old.
Mr. Sajith Krishnan is
the Manager, Indian
Department.
He is Indian
nationality.
BUSINESS OPERATIONS
The subject is
engaged in providing
wide range of
inbound-outbound tours and
travel services. Range
of services includes
package tours, half
and full day
excursions, transfer online
reservation, air/train ticket
booking, travel visa,
hotel reservation &
other services.
PURCHASE
100% of purchasing is from local supplier.
SALES/SERVICES
Sales/services are for
clients both Thai and foreign
mainly in South
East Asian countries.
NAME OF INDIAN AGENCIES
Royal Indian Voyages
[P] Ltd. :
India
Alhind Tours and
Travels Pvt. Ltd. : India
Travelite [India] Pvt.
Ltd. : India
SUBSIDIARY AND AFFILIATED COMPANY
The subject is
not found to
have any subsidiary
or affiliated company
here in Thailand.
LITIGATION
Bankruptcy and Receivership
There are no
litigation on bankruptcy
and receivership cases
filed against the
subject found at
Legal Execution Department for
the past five
years.
Others
There are no
legal suits filed against the subject
for the past
two years.
CREDIT
Sales/services are by
cash or on
the credit term
of 30 days.
Local bills are
paid by cash
or on the
credits term of
30-60 days.
BANKING
Bangkok Bank Public
Co., Ltd.
Kasikornbank Public Co.,
Ltd.
EMPLOYMENT
The subject currently
employs approximately 280
staff.
LOCATION DETAILS
The premise is
rented for administrative office
at the heading
address. Premise is
located in prime
commercial area.
Branches office :
4/128 Moo 2, T.
Borpud, A. Koh Samui,
Suratthani province.
67/137 Moo 5, T.
Kuk Kak,
A. Takuapa, Pang-Nga province.
9/9 Moo 1, T.
Kuk Kak,
A. Takuapa, Pang-Nga province.
100/368 Moo 5,
Pracha-uthit Road, T. Rasada,
A. Muang, Phuket province.
376/16 Moo 2, T.
Aow-Nang, A. Muang, Krabi
province.
69/7 Petchkasem Road,
T. Hua Hin, A. Hua
Hin, Prachuabkirikhan province.
164/9 Moo 2, T.
Aow-Nang, A. Muang, Krabi
province.
98/64 Kata Road,
T. Karon, A. Muang, Phuket
province.
19 Soi Sukhumvit
18, Klongtoey, Bangkok.
683 Patak Road,
A. Karon, A. Muang, Phuket
province.
38/2 Moo 3, T.
Bo-Pud, A. Koh Samui,
Suratthani province.
5/3 Moo 8,
Aowyon-Khaokad Road, T. Vichit,
A. Muang, Phuket province.
65 Moo 4, T.
Maikhao, A. Thalang, Phuket
province.
COMMENT
The subject operates
as tour and
travel services. Its
operating performance in
2012 was satisfactory
with an increase
in both service
revenue and net
profit comparing to
the same period
of the previous year. This
was mainly due to
an increase in
number of tourists
in 2012 particularly
from Asian countries
like Republic of
China, India and Korea
which contributed to the
subject’s high revenue.
The subject also
expects a growth
in the tourist
business this year
as well.
FINANCIAL INFORMATION
The capital was
registered at Bht. 12,000,000 divided
into 120,000 shares of Bht.
100 each with
fully paid.
On August 31,
2001, the registered
capital was increased
to Bht. 24,000,000
divided into 240,000
shares of Bht. 100
each with fully
paid.
THE SHAREHOLDERS LISTED
WERE
[as at April 5,
2013]
|
NAME |
HOLDING |
% |
|
|
|
|
|
Mr. Lersan Misitsakul Nationality: Thai Address : 1/109
Soi Mahadlek Luang 3,
Rajdamri Road, Lumpini,
Pathumwan, Bangkok |
122,399 |
51.00 |
|
Asian Trails Holding
Ltd. Nationality: Mauritius Address : Mauritius |
117,600 |
49.00 |
|
Mrs. Sirichit Pruksanubal Nationality: Thai Address : 22/29
Soi Sribumphen, Thungmahamek, Sathorn,
Bangkok |
1 |
- |
Total Shareholders : 3
Share Structure
[as at April
5, 2013]
|
Nationality |
Shareholders |
No. of Share |
% Shares |
|
|
|
|
|
|
Thai |
2 |
122,400 |
51.00 |
|
Foreign-Mauritius |
1 |
117,600 |
49.00 |
|
Total |
3 |
240,000 |
100.00 |
NAME OF AUDITOR
& CERTIFIED PUBLIC
ACCOUNTANT NO.
Ms. Patamawan Wattanakul No.
9832
BALANCE SHEET [BAHT]
The latest financial figures published
as at December
31, 2012, 2011
& 2010 were:
ASSETS
|
Current Assets |
2012 |
2011 |
2010 [Adjusted] |
|
|
|
|
|
|
Cash and Cash Equivalents |
185,123,053 |
98,552,886 |
74,078,534 |
|
Trade Accounts Receivable
|
146,137,113 |
96,751,411 |
125,251,146 |
|
Other Receivable |
6,521,808 |
7,165,078 |
6,057,286 |
|
Other Current Assets
|
18,484,280 |
23,899,669 |
27,312,434 |
|
|
|
|
|
|
Total Current Assets
|
356,266,254 |
226,369,044 |
232,699,400 |
|
Investment in Subsidiaries |
3,960,100 |
3,960,100 |
3,960,100 |
|
Fixed Assets |
5,091,978 |
5,331,570 |
5,268,123 |
|
Intangible Assets |
793,047 |
1,363,038 |
537,516 |
|
Deferred Income Tax |
9,675,090 |
9,287,577 |
7,800,355 |
|
Other Non-current Assets |
4,086,718 |
3,989,568 |
3,301,602 |
|
Total Assets |
379,873,187 |
250,300,897 |
253,567,096 |
LIABILITIES &
SHAREHOLDERS’ EQUITY [BAHT]
|
Current
Liabilities |
2012 |
2011 |
2010 [Adjusted] |
|
|
|
|
|
|
Bank Overdraft |
48,262,131 |
2,215,769 |
7,019,807 |
|
Trade Accounts Payable
|
127,846,097 |
80,965,542 |
98,106,919 |
|
Other Payable-Related Company |
2,506,852 |
3,727,692 |
9,201,188 |
|
Accrued Income Tax |
3,009,878 |
197,706 |
- |
|
Advance Received from Customer |
84,858,463 |
81,484,045 |
62,490,011 |
|
Other Current Liabilities |
27,194,981 |
20,463,886 |
21,731,102 |
|
|
|
|
|
|
Total Current Liabilities |
293,678,402 |
189,054,640 |
198,549,027 |
|
Advance Received from Customer |
2,287,706 |
2,462,553 |
2,754,062 |
|
Estimated Liabilities for Employee
Benefits Obligation |
22,329,819 |
20,292,485 |
- |
|
Total Liabilities |
318,295,927 |
211,809,678 |
201,303,089 |
|
|
|
|
|
|
Shareholders' Equity |
|
|
|
|
|
|
|
|
|
Share capital : Baht 100
par value authorized, issued
and fully paid share
capital 240,000 shares |
24,000,000 |
24,000,000 |
24,000,000 |
|
|
|
|
|
|
Capital Paid |
24,000,000 |
24,000,000 |
24,000,000 |
|
Retained Earnings: Appropriated for Statutory Reserve |
2,400,000 |
2,400,000 |
2,400,000 |
|
Unappropriated |
35,177,260 |
12,091,219 |
25,864,007 |
|
Total Shareholders' Equity |
61,577,260 |
38,491,219 |
52,264,007 |
|
Total Liabilities & Shareholders' Equity |
379,873,187 |
250,300,897 |
253,567,096 |
PROFIT & LOSS ACCOUNT
|
Revenue |
2012 |
2011 |
2010 [Adjusted] |
|
|
|
|
|
|
Service Income |
1,288,082,372 |
1,087,925,213 |
1,062,919,533 |
|
Interest Income |
121,570 |
114,135 |
390,928 |
|
Gain on Exchange Rate |
- |
6,160,600 |
- |
|
Other Income |
52,958,979 |
32,607,230 |
24,887,951 |
|
Total Revenues |
1,341,162,921 |
1,126,807,178 |
1,088,198,412 |
|
Expenses |
|
|
|
|
|
|
|
|
|
Cost of Service |
1,096,569,439 |
933,486,936 |
908,086,657 |
|
Selling Expenses |
40,994,113 |
33,650,501 |
30,533,209 |
|
Administrative Expenses |
167,026,657 |
172,439,344 |
161,366,898 |
|
Loss on Exchange Rate |
5,256,909 |
- |
231,116 |
|
Total Expenses |
1,309,847,118 |
1,139,576,781 |
1,100,217,880 |
|
|
|
|
|
|
Profit / [Loss] before Financial Cost & Income
Tax |
31,315,803 |
[12,769,603] |
[12,019,468] |
|
Financial Cost |
[698,047] |
[93,892] |
[61,715] |
|
Profit / [Loss] before Income Tax |
30,617,756 |
[12,863,495] |
[12,081,183] |
|
Income Tax |
[7,531,715] |
[909,293] |
[781,061] |
|
|
|
|
|
|
Net Profit / [Loss] |
23,086,041 |
[13,772,788] |
[11,300,122] |
FINANCIAL ANALYSIS
|
ITEM |
UNIT |
2012 |
2011 |
2010 |
|
|
|
|
|
|
|
LIQUIDITY RATIO |
|
|
|
|
|
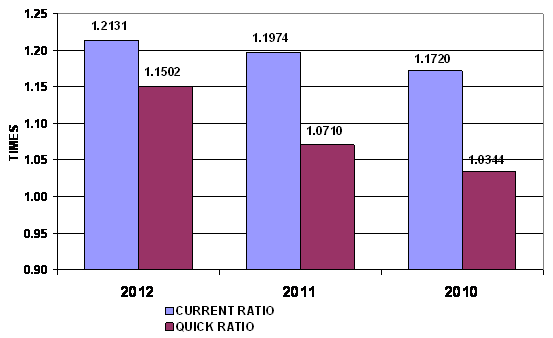
CURRENT RATIO |
TIMES |
1.21 |
1.20 |
1.17 |
|
QUICK RATIO |
TIMES |
1.15 |
1.07 |
1.03 |
|
|
|
|
|
|
|
ACTIVITY RATIO |
|
|
|
|
|
FIXED ASSETS TURNOVER |
TIMES |
252.96 |
204.05 |
201.76 |
|
TOTAL ASSETS TURNOVER |
TIMES |
3.39 |
4.35 |
4.19 |
|
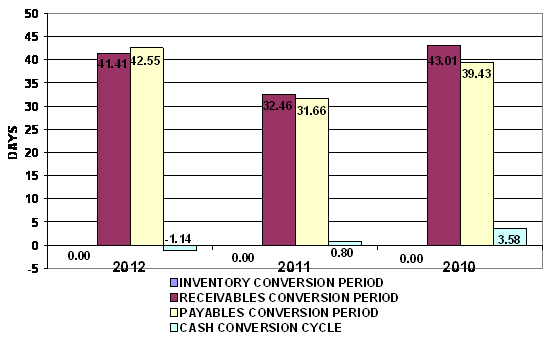
INVENTORY CONVERSION PERIOD |
DAYS |
- |
- |
- |
|
INVENTORY TURNOVER |
TIMES |
- |
- |
- |
|
RECEIVABLES CONVERSION PERIOD |
DAYS |
41.41 |
32.46 |
43.01 |
|
RECEIVABLES TURNOVER |
TIMES |
8.81 |
11.24 |
8.49 |
|
PAYABLES CONVERSION PERIOD |
DAYS |
42.55 |
31.66 |
39.43 |
|
CASH CONVERSION CYCLE |
DAYS |
(1.14) |
0.80 |
3.58 |
|
|
|
|
|
|
|
PROFITABILITY RATIO |
|
|
|
|
|
COST OF GOODS SOLD |
% |
85.13 |
85.80 |
85.43 |
|
SELLING & ADMINISTRATION |
% |
16.15 |
18.94 |
18.05 |
|
INTEREST |
% |
0.05 |
0.01 |
0.01 |
|
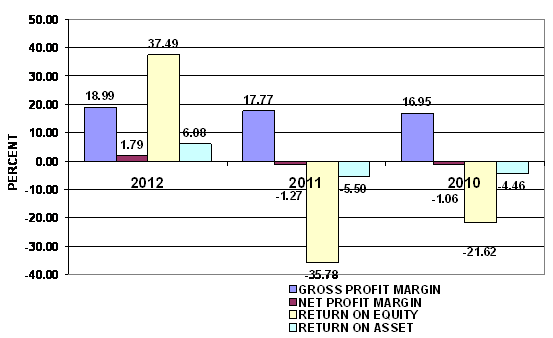
GROSS PROFIT MARGIN |
% |
18.99 |
17.77 |
16.95 |
|
NET PROFIT MARGIN BEFORE EX. ITEM |
% |
2.43 |
(1.17) |
(1.13) |
|
NET PROFIT MARGIN |
% |
1.79 |
(1.27) |
(1.06) |
|
RETURN ON EQUITY |
% |
37.49 |
(35.78) |
(21.62) |
|
RETURN ON ASSET |
% |
6.08 |
(5.50) |
(4.46) |
|
EARNING PER SHARE |
BAHT |
96.19 |
(57.39) |
(47.08) |
|
|
|
|
|
|
|
LEVERAGE RATIO |
|
|
|
|
|
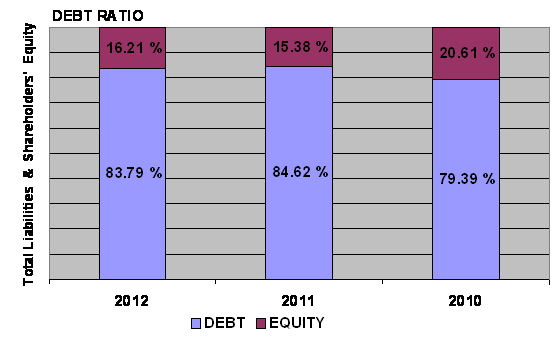
DEBT RATIO |
TIMES |
0.84 |
0.85 |
0.79 |
|
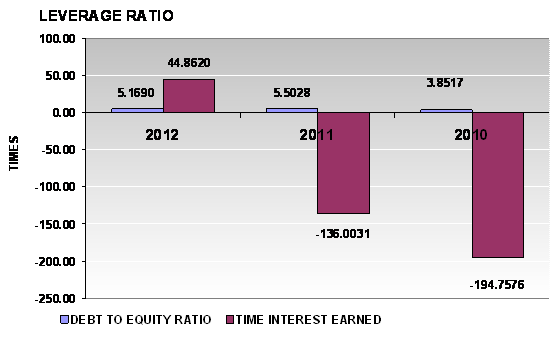
DEBT TO EQUITY RATIO |
TIMES |
5.17 |
5.50 |
3.85 |
|
TIME INTEREST EARNED |
TIMES |
44.86 |
(136.00) |
(194.76) |
|
|
|
|
|
|
|
ANNUAL GROWTH |
|
|
|
|
|
SALES GROWTH |
% |
18.40 |
2.35 |
|
|
OPERATING PROFIT |
% |
(345.24) |
6.24 |
|
|
NET PROFIT |
% |
267.62 |
(21.88) |
|
|
FIXED ASSETS |
% |
(4.49) |
1.20 |
|
|
TOTAL ASSETS |
% |
51.77 |
(1.29) |
|
ANNUAL GROWTH : SATISFACTORY
An annual sales growth is 18.4%. Turnover has increased from THB 1,087,925,213.00
in 2011 to THB 1,288,082,372.00 in 2012. While net profit has increased from
THB -13,772,788.00 in 2011 to THB 23,086,041.00 in 2012. And total assets has
increased from THB 250,300,897.00 in 2011 to THB 379,873,187.00 in 2012.
PROFITABILITY : IMPRESSIVE
PROFITABILITY RATIO
|
Gross Profit Margin |
18.99 |
Deteriorated |
Industrial Average |
46.36 |
|
Net Profit Margin |
1.79 |
Impressive |
Industrial Average |
1.70 |
|
Return on Assets |
6.08 |
Impressive |
Industrial Average |
3.61 |
|
Return on Equity |
37.49 |
Impressive |
Industrial Average |
9.43 |
Gross Profit Margin used to assess a firm's financial health by revealing
the proportion of money left over from revenues after accounting for the cost
of goods sold. Gross profit margin serves as the source for paying additional
expenses and future savings. The company's figure is 18.99%. When compared with
the industry average, the ratio of the company was lower. This indicated that
company may have problems with control over its costs.
Net Profit Margin is the indicator of the company's efficiency in that
net profit takes into consideration all expenses of the company. A low profit
margin indicates a low margin of safety, higher risk that a decline in sales
will erase profits and result in a net loss. Net Profit Margin ratio is 1.79%,
higher figure when compared with those of its average competitors in the same
industry, indicated that business was an efficient operators in a dominant
position within its industry.
Return on Assets measures how efficiently profits are being generated
from the assets employed in the business when compared with the ratios of firms
in a similar business. A low ratio in comparison with industry averages
indicates an inefficient use of business assets. Return on Assets ratio is
6.08%, higher figure when compared with those of its average competitors in the
same industry, indicated that business was an efficient profit in a dominant position within its industry.
Return on Equity indicates how profitable a company is by comparing its
net income to its average shareholders' equity, ROE measures how much the
shareholders earned for their investment in the company. Return on Equity ratio
is 37.49%, higher figure when compared with those of its average competitors in
the same industry, indicated that business was an efficient profit in a dominant position within its industry.
Trend of the average competitors in the same industry for last 5 years
Return on Assets Uptrend
Return on Equity Uptrend
LIQUIDITY : SATISFACTORY
LIQUIDITY RATIO
|
Current Ratio |
1.21 |
Satisfactory |
Industrial Average |
1.38 |
|
Quick Ratio |
1.15 |
|
|
|
|
Cash Conversion Cycle |
(1.14) |
|
|
|
The Current Ratio is to ascertain whether a company's short-term assets are
readily available to pay off its short-term liabilities. The company's figure
is 1.21 times in 2012, increase from 1.2 times, then it is generally considered
to have good short-term financial strength. When compared with the industry
average, the ratio of the company was lower.
The Quick Ratio is a liquidity indicator that further refines the
current ratio by measuring the amount of the most liquid current assets there
are to cover current liabilities. The company's figure is 1.15 times in 2012,
increase from 1.07 times, although excluding inventory so the company still
have good short-term financial strength.
The Cash Conversion Cycle measures the number of days a company's cash
is tied up in the production and sales process of its operations and the benefit
from payment terms from its creditors. It meant the company could survive when
no cash inflow was received from sale for -2 days.
Trend of the average competitors in the same industry for last 5 years
Current Ratio Downtrend
LEVERAGE : ACCEPTABLE
LEVERAGE RATIO
|
Debt Ratio |
0.84 |
Acceptable |
Industrial Average |
0.64 |
|
Debt to Equity Ratio |
5.17 |
Risky |
Industrial Average |
1.77 |
|
Times Interest Earned |
44.86 |
Impressive |
Industrial Average |
(0.20) |
Debt to Equity Ratio a measurement of how much suppliers, lenders, creditors
and obligors have committed to the company versus what the shareholders have
committed. A lower the percentage means that the company is using less leverage
and has a stronger equity position.
Times Interest Earned measuring a company's ability to meet its debt
obligations. Ratio is 44.87 higher than 1, so the company can pay interest
expenses on outstanding debt.
Debt Ratio shows the proportion of a company's assets which are financed
through debt. The company's figure is 0.84 greater than 0.5, most of the
company's assets are financed through debt.
Trend of the average competitors in the same industry for last 5 years
Debt Ratio Uptrend
Times Interest Earned Downtrend
ACTIVITY : EXCELLENT
ACTIVITY RATIO
|
Fixed Assets Turnover |
252.96 |
Impressive |
Industrial Average |
(1.62) |
|
Total Assets Turnover |
3.39 |
Impressive |
Industrial Average |
1.74 |
|
Inventory Conversion Period |
- |
|
|
|
|
Inventory Turnover |
- |
|
Industrial Average |
(12.18) |
|
Receivables Conversion Period |
41.41 |
|
|
|
|
Receivables Turnover |
8.81 |
Impressive |
Industrial Average |
2.83 |
|
Payables Conversion Period |
42.55 |
|
|
|
The company's Account Receivable Ratio is calculated as 8.81 and 11.24
in 2012 and 2011 respectively. This ratio measures the efficiency of the
company in managing its trade debtors to generate revenue. A lower ratio may
indicate over extension and collection problems. Conversely, a higher ratio may
indicate an overtly stringent policy. In this case, the company's A/R ratio in
2012 decreased from 2011. This would suggest the company had deteriorated in
the management of its debt collections.
The company's Total Asset Turnover is calculated as 3.39 times and 4.35
times in 2012 and 2011 respectively. This ratio is determined by dividing total
assets into total sales turnover. The ratio measures the activity of the assets
and the ability of the firm to generate sales through the use of the assets.
Trend of the average competitors in the same industry for last 5 years
Fixed Assets Turnover Downtrend
Total Assets Turnover Downtrend
Inventory Turnover Downtrend
Receivables Turnover Downtrend
FOREIGN EXCHANGE RATES
|
Currency |
Unit
|
Indian Rupees |
|
US Dollar |
1 |
Rs.61.63 |
|
|
1 |
Rs.99.94 |
|
Euro |
1 |
Rs.85.14 |
INFORMATION DETAILS
|
Report Prepared
by : |
SDA |
RATING EXPLANATIONS
|
RATING |
STATUS |
PROPOSED CREDIT LINE |
|
|
>86 |
Aaa |
Possesses an extremely sound financial base with the strongest
capability for timely payment of interest and principal sums |
Unlimited |
|
71-85 |
Aa |
Possesses adequate working capital. No caution needed for credit transaction.
It has above average (strong) capability for payment of interest and
principal sums |
Large |
|
56-70 |
A |
Financial & operational base are regarded healthy. General unfavourable
factors will not cause fatal effect. Satisfactory capability for payment of
interest and principal sums |
Fairly Large |
|
41-55 |
Ba |
Overall
operation is considered normal. Capable to meet normal commitments. |
Satisfactory |
|
26-40 |
B |
Capability to overcome financial difficulties seems comparatively
below average. |
Small |
|
11-25 |
Ca |
Adverse factors are apparent. Repayment of interest and principal sums
in default or expected to be in default upon maturity |
Limited with full
security |
|
<10 |
C |
Absolute credit risk exists. Caution needed to be exercised |
Credit not
recommended |
|
---- |
NB |
New Business |
---- |
This score serves as a reference to assess
SC’s credit risk and to set the amount of credit to be extended. It is
calculated from a composite of weighted scores obtained from each of the major
sections of this report. The assessed factors and their relative weights (as
indicated through %) are as follows:
Financial
condition (40%) Ownership
background (20%) Payment
record (10%)
Credit history
(10%) Market trend (10%) Operational size
(10%)
This report is issued at your request without any
risk and responsibility on the part of MIRA INFORM PRIVATE LIMITED (MIPL)
or its officials.