MIRA
INFORM REPORT
|
Report Date : |
30.10.2013 |
IDENTIFICATION DETAILS
|
Name : |
DEXON CORPORATION LIMITED |
|
|
|
|
Registered Office : |
121/32
Moo 8, Suksawad
74 Road, Bangkru, Phrapradaeng, Samutprakarn 10130 |
|
|
|
|
Country : |
|
|
|
|
|
Financials (as on) : |
31.12.2012 |
|
|
|
|
Date of Incorporation : |
17.12.1997 |
|
|
|
|
Com. Reg. No.: |
0115540006720 |
|
|
|
|
Legal Form : |
Private
Limited Company |
|
|
|
|
Line of Business : |
Manufacturing,
distributing and exporting
of covered elastic
yarns and yarn
covered rubber threads
with various colors
and sizes |
|
|
|
|
No. of Employees : |
150 |
RATING & COMMENTS
|
MIRA’s Rating : |
B |
|
RATING |
STATUS |
PROPOSED CREDIT LINE |
|
|
26-40 |
B |
Capability to overcome financial difficulties seems comparatively
below average. |
Small |
|
Status : |
Moderate |
|
Payment Behaviour : |
Slow |
|
Litigation : |
Clear |
NOTES :
Any query related to this report can be made
on e-mail: infodept@mirainform.com
while quoting report number, name and date.
ECGC Country Risk Classification List – March 31st, 2013
|
Country Name |
Previous Rating (31.12.2012) |
Current Rating (31.03.2013) |
|
|
B1 |
B1 |
|
Risk Category |
ECGC
Classification |
|
Insignificant |
A1 |
|
Low |
A2 |
|
Moderate |
B1 |
|
High |
B2 |
|
Very High |
C1 |
|
Restricted |
C2 |
|
Off-credit |
D |
With a well-developed infrastructure, a free-enterprise
economy, generally pro-investment policies, and strong export industries,
Source
: CIA
Company name
DEXON CORPORATION LIMITED
SUMMARY
BUSINESS
ADDRESS : 121/32 MOO
8, SUKSAWAD 74
ROAD,
BANGKRU, PHRAPRADAENG,
SAMUTPRAKARN 10130, THAILAND
TELEPHONE : [66] 2463-8512,
2463-8518, 2464-0450-2, 081
721-9363
FAX :
[66] 2464-0453
E-MAIL
ADDRESS : sales@dexon.co.th
REGISTRATION
ADDRESS : SAME
AS BUSINESS ADDRESS
ESTABLISHED
: 1997
REGISTRATION
NO. : 0115540006720
TAX
ID NO. : 3271131800
CAPITAL REGISTERED : BHT. 35,000,000
CAPITAL PAID-UP : BHT.
35,000,000
SHAREHOLDER’S PROPORTION : THAI :
100%
FISCAL YEAR CLOSING DATE : DECEMBER 31
LEGAL
STATUS : PRIVATE LIMITED
COMPANY
EXECUTIVE : MRS. PAKSARAN WEI,
THAI
MANAGING DIRECTOR
NO.
OF STAFF : 150
LINES
OF BUSINESS : COVERED ELASTIC
YARN AND YARN
COVERED RUBBER
THREAD
MANUFACTURER, DISTRIBUTOR
AND EXPORTER
CORPORATE PROFILE
OPERATING
TREND : STABLE
PRESENT
SITUATION : OPERATING NORMALLY
REPUTATION : GOOD
WITH NORMAL BUSINESS
ENGAGEMENT
MANAGEMENT
STANDARD : MANAGEMENT WITH
FAIR PERFORMANCE
HISTORY
The
subject was established
on December 17,
1997 as a
private limited company under
the name style
DEXON CORPORATION LIMITED,
by Thai groups, with
the business objective
to manufacture and distribute
covered elastic yarns
and yarn covered
rubber threads to
both domestic and
international markets. It currently
employs approximately 150
staff.
The
subject’s registered address
is 121/32 Moo
8, Suksawad 74
Rd., Bangkru, Phrapradaeng, Samutprakarn
10130, and this
is the subject’s
current operation address.
THE
BOARD OF DIRECTOR
|
Name |
|
Nationality |
Age |
|
|
|
|
|
|
Mr. Lin, Fang Qiong |
|
Thai |
69 |
|
Mrs. Paksaran Wei |
|
Thai |
42 |
|
Mr. Wei Chen Weng |
|
Thai |
43 |
AUTHORIZED PERSON
Anyone of the above
directors can sign
on behalf of
the subject with
company’s affixed.
MANAGEMENT
Mrs. Paksaran Wei is
the Managing Director.
She is Thai
nationality with the
age of 42
years old.
Mr. Wei Chen
Weng is the
Assistant Managing Director.
He is Thai
nationality with the
age of 43
years old.
BUSINESS OPERATIONS
The subject
is engaged in
manufacturing, distributing and
exporting of covered
elastic yarns and
yarn covered rubber
threads with various
colors and sizes,
under its own
brand DEXON. The
products are as
follows:
·
Covered Rubber
Thread
: Extruded rubber
threads, ranging from
No. 20-No. 100 double covered
with texturized
polyester yarn or
texturized nylon yarn
of various dtex/denier
·
Covered Spandex
Yarn
: Spandex yarn
single or double
covered for high-end
application
·
Braided Elastic
Cord
: Extruded rubber
cord braided with
either
polypropylene/polyethylene
and packaged
in rolls of
continuous length
·
Elastic String
: Extruded rubber
threads double covered
for tagging or
packaging application.
PRODUCTION CAPACITY
1,200 metric tons
per annum
PURCHASE
Most of raw materials are purchased from local suppliers, the remaining as well as
machinery are imported
from Taiwan, India
and Republic of
China.
MAJOR SUPPLIER
Longtex Rubber Industry
Co., Ltd. : Thailand
SALES
The products are
sold by wholesale
to customers in
both local and
overseas, mainly Taiwan, Hong
Kong, Singapore, India,
U.S.A., Indonesia, Malaysia,
Vietnam,
Republic of China
and Japan.
MAJOR
CUSTOMER
Global
Trading of Martinsville
Inc. : U.S.A.
RELATED AND
AFFILIATED COMPANY
Longtex Rubber Industry
Co., Ltd.
Business Type :
Manufacturer of extruded
rubber threads.
LITIGATION
Bankruptcy and Receivership
There are no
litigation on bankruptcy
and receivership cases
filed against the
subject found at
Legal Execution Department
for the past
five years.
Others
There are no
legal suits filed
against the subject
for the past
two years.
CREDIT
Sales are by
cash or on
the credits term
of 30-60 days.
Local bills are
paid by cash
or on the
credits term of
30-60 days.
Imports are by
L/C at sight
or T/T.
Exports are against
T/T/.
BANKING
Bangkok
Bank Public Co.,
Ltd.
Kasikornbank
Public Co., Ltd.
EMPLOYMENT
The
subject employs approximately 150 office
staff and factory
workers.
LOCATION DETAILS
The premise
is owned for administrative office and
factory at the heading
address. Premise is located
in industrial area.
COMMENT
The
subject was formed in
1997 as a
manufacturer, distributor and
exporter of covered
elastic yarn and
yarn covered rubber
thread. Its products
are for industrial
used such as
textile and other
industries. Demand of the
products are depending
upon industrial
consumption.
Demand of
the products is depending
upon local industries,
which seems to
slowdown from exports.
FINANCIAL INFORMATION
The
capital was registered
at Bht. 30,000,000
divided into 30,000
shares of Bht.
1,000 each.
On
July 14, 2006,
the capital was
increased to Bht.
35,000,000 divided into
35,000 shares of
Bht. 1,000 each
with fully paid.
THE
SHAREHOLDERS LISTED WERE
: [as at
April 30, 2013]
|
NAME |
HOLDING |
% |
|
|
|
|
|
Mr. Wei Chen Weng Nationality: Thai Address : 365/1199
Puthabucha Rd., Bangmod,
Thungkru, Bangkok |
10,498 |
30.00 |
|
Mrs. Paksaran Wei Nationality: Thai Address : 365/1199
Puthabucha Rd., Bangmod,
Thungkru, Bangkok |
10,000 |
28.57 |
|
Longtex Rubber Industry
Co., Ltd. Nationality: Thai Address : 121/32
Moo 8, Suksawad
74 Rd.,
Bangkru, Phrapradaeng, Samutprakarn |
9,000 |
25.71 |
|
Mr. Chalermpol Wangwithaya Nationality: Thai Address : 171
Pattanakarn 56 Rd.,
Suanluang, Bangkok |
3,000 |
8.57 |
|
Mrs. Weng, Lin Fang
Qiong Nationality: Thai Address : 365/1197
Puthabucha Rd., Bangmod,
Thungkru, Bangkok |
1,500 |
4.29 |
|
Mr. Ta Foo Weng Nationality: Thai Address : 365/1197
Puthabucha Rd., Bangmod,
Thungkru, Bangkok |
1,000 |
2.86 |
|
Mr. Pornchai Wangwithaya Nationality: Thai Address : 171
Pattanakarn 56 Rd.,
Suanluang, Bangkok |
1 |
- |
|
Mrs. Vilai Wangwithaya Nationality: Thai Address : 171
Pattanakarn 56 Rd.,
Suanluang, Bangkok |
1 |
- |
Total Shareholders : 8
Share Structure [as
at April 30,
2013]
|
Nationality |
Shareholders |
No. of Share |
% Shares |
|
|
|
|
|
|
Thai |
8 |
35,000 |
100.00 |
|
Foreign |
- |
- |
- |
|
Total |
8 |
35,000 |
100.00 |
NAME OF AUDITOR
& CERTIFIED PUBLIC
ACCOUNTANT NO. :
Mr. Chaiyuth Suyarnavanitkul No.
3547
BALANCE SHEET [BAHT]
The
latest financial figures
published for December
31, 2012, 2011
& 2010 were:
ASSETS
|
Current Assets |
2012 |
2011 |
2010 |
|
|
|
|
|
|
Cash and Cash
Equivalents |
698,332.22 |
603,750.92 |
822,087.93 |
|
Trade Accounts &
Other Receivable |
23,940,197.09 |
26,869,287.62 |
16,441,800.38 |
|
Short-term Lending to Related
Person |
316,027.92 |
327,106.00 |
311,045.28 |
|
Inventories |
45,250,515.93 |
41,884,145.86 |
39,913,891.37 |
|
Other Current Assets
|
1,349,361.72 |
3,308,478.47 |
1,572,349.51 |
|
Total Current Assets
|
71,554,434.88 |
72,992,768.87 |
59,061,174.47 |
|
Investment accounted for
under Equity Method |
3,107,339.02 |
3,139,295.02 |
3,092,966.02 |
|
Fixed Assets |
26,391,378.33 |
26,132,534.27 |
16,540,102.65 |
|
Other Non-current Assets |
- |
- |
841.11 |
|
Total Assets |
101,053,152.23 |
102,264,598.16 |
78,695,084.25 |
LIABILITIES & SHAREHOLDERS' EQUITY
[BAHT]
|
Current
Liabilities |
2012 |
2011 |
2010 |
|
|
|
|
|
|
Bank Overdraft &
Short-term Loan from Financial Institution |
6,327,696.07 |
18,160,293.54 |
17,518,798.87 |
|
Trade Accounts & Other
Payable |
62,640,978.08 |
53,230,018.44 |
35,216,110.21 |
|
Current Portion of Long-term Liabilities |
109,416.00 |
250,032.00 |
140,616.00 |
|
Accrued Income Tax |
346,969.01 |
1,111,507.56 |
718,899.13 |
|
Total Current Liabilities |
69,425,059.16 |
72,751,851.54 |
53,594,424.21 |
|
|
|
|
|
|
Hire-purchase Payable |
237,068.00 |
756,614.00 |
550,746.00 |
|
Total Liabilities |
69,662,127.16 |
73,508,465.54 |
54,145,170.21 |
|
|
|
|
|
|
Shareholders' Equity |
|
|
|
|
|
|
|
|
|
Share capital : Baht 1,000
value authorized, issued
and fully paid share
capital 35,000 shares |
35,000,000.00 |
35,000,000.00 |
35,000,000.00 |
|
Capital Paid |
35,000,000.00 |
35,000,000.00 |
35,000,000.00 |
|
Retained Earning -
Unappropriated |
[3,608,974.93] |
[6,243,867.38] |
[10,450,085.96] |
|
Total Shareholders' Equity |
31,391,025.07 |
28,756,132.62 |
24,549,914.04 |
|
Total Liabilities &
Shareholders' Equity |
101,053,152.23 |
102,264,598.16 |
78,695,084.25 |
PROFIT &
LOSS ACCOUNT
|
Revenue |
2012 |
2011 |
2010 |
|
|
|
|
|
|
Sales Income |
179,140,123.23 |
198,650,595.67 |
167,759,320.16 |
|
Other Income |
3,584,724.87 |
5,792,950.03 |
3,324,269.81 |
|
Total Revenues |
182,724,848.10 |
204,443,545.70 |
171,083,589.97 |
|
Expenses |
|
|
|
|
|
|
|
|
|
Change in Finished Goods and
Work in Process |
[3,780,385.01] |
581,537.64 |
[10,016,904.75] |
|
Raw Material and Material Supplies |
127,687,399.98 |
142,521,128.68 |
129,726,910.08 |
|
Employees Benefits Expenses |
22,258,634.33 |
23,247,578.20 |
18,785,206.98 |
|
Depreciation and Amortization |
8,099,293.48 |
4,883,257.59 |
2,538,494.55 |
|
Other Expenses |
24,523,939.27 |
26,760,186.87 |
25,445,681.29 |
|
Total Expenses |
178,788,882.05 |
197,993,688.98 |
166,479,388.15 |
|
Profit / [Loss] Before Financial Cost & Income Tax |
3,935,966.05 |
6,449,856.72 |
4,604,201.82 |
|
Financial Cost |
[503,945.69] |
[385,491.23] |
[259,416.30] |
|
Profit / [Loss] before Income
Tax |
3,432,020.36 |
6,064,365.49 |
4,344,785.52 |
|
Income Tax |
[797,127.91] |
[1,858,146.91] |
[1,249,846.88] |
|
Net Profit / [Loss] |
2,634,892.45 |
4,206,218.58 |
3,094,938.64 |
FINANCIAL ANALYSIS
|
ITEM |
UNIT |
2012 |
2011 |
2010 |
|
|
|
|
|
|
|
LIQUIDITY RATIO |
|
|
|
|
|
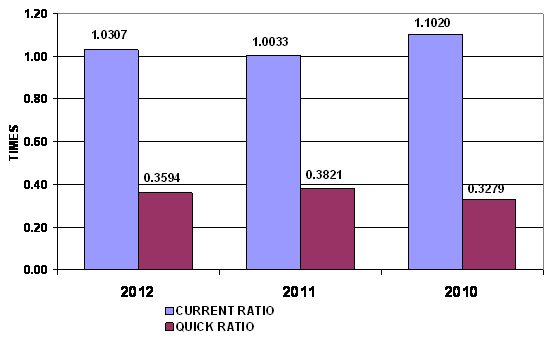
CURRENT RATIO |
TIMES |
1.03 |
1.00 |
1.10 |
|
QUICK RATIO |
TIMES |
0.36 |
0.38 |
0.33 |
|
|
|
|
|
|
|
ACTIVITY RATIO |
|
|
|
|
|
FIXED ASSETS TURNOVER |
TIMES |
6.79 |
7.60 |
10.14 |
|
TOTAL ASSETS TURNOVER |
TIMES |
1.77 |
1.94 |
2.13 |
|
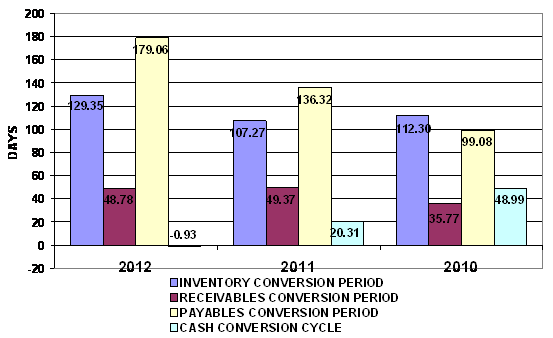
INVENTORY CONVERSION PERIOD |
DAYS |
129.35 |
107.27 |
112.30 |
|
INVENTORY TURNOVER |
TIMES |
2.82 |
3.40 |
3.25 |
|
RECEIVABLES CONVERSION PERIOD |
DAYS |
48.78 |
49.37 |
35.77 |
|
RECEIVABLES TURNOVER |
TIMES |
7.48 |
7.39 |
10.20 |
|
PAYABLES CONVERSION PERIOD |
DAYS |
179.06 |
136.32 |
99.08 |
|
CASH CONVERSION CYCLE |
DAYS |
(0.93) |
20.31 |
48.99 |
|
|
|
|
|
|
|
PROFITABILITY
RATIO |
|
|
|
|
|
COST OF GOODS SOLD |
% |
71.28 |
71.74 |
77.33 |
|
SELLING & ADMINISTRATION |
% |
16.95 |
14.16 |
12.71 |
|
INTEREST |
% |
0.28 |
0.19 |
0.15 |
|
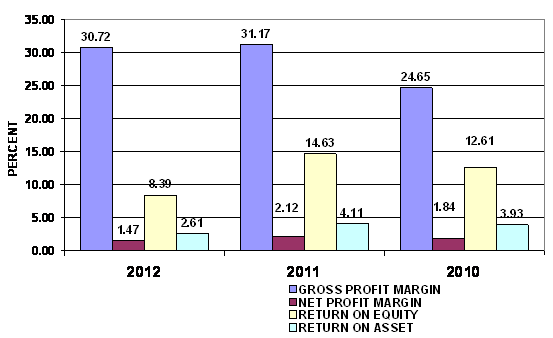
GROSS PROFIT MARGIN |
% |
30.72 |
31.17 |
24.65 |
|
NET PROFIT MARGIN BEFORE EX. ITEM |
% |
2.20 |
3.25 |
2.74 |
|
NET PROFIT MARGIN |
% |
1.47 |
2.12 |
1.84 |
|
RETURN ON EQUITY |
% |
8.39 |
14.63 |
12.61 |
|
RETURN ON ASSET |
% |
2.61 |
4.11 |
3.93 |
|
EARNING PER SHARE |
BAHT |
75.28 |
120.18 |
88.43 |
|
|
|
|
|
|
|
LEVERAGE RATIO |
|
|
|
|
|
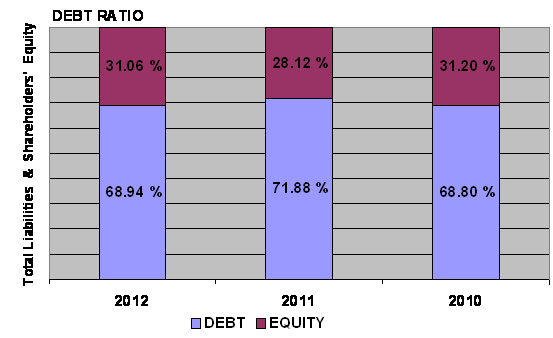
DEBT RATIO |
TIMES |
0.69 |
0.72 |
0.69 |
|
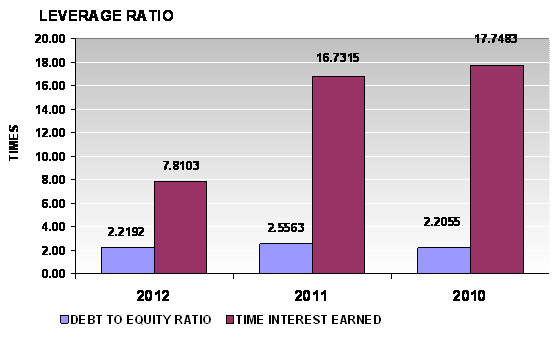
DEBT TO EQUITY RATIO |
TIMES |
2.22 |
2.56 |
2.21 |
|
TIME INTEREST EARNED |
TIMES |
7.81 |
16.73 |
17.75 |
|
|
|
|
|
|
|
ANNUAL GROWTH |
|
|
|
|
|
SALES GROWTH |
% |
(9.82) |
18.41 |
|
|
OPERATING PROFIT |
% |
(38.98) |
40.09 |
|
|
NET PROFIT |
% |
(37.36) |
35.91 |
|
|
FIXED ASSETS |
% |
0.99 |
57.99 |
|
|
TOTAL ASSETS |
% |
(1.18) |
29.95 |
|
ANNUAL GROWTH :
RISKY
An annual sales growth is -9.82%. Turnover has decreased from THB 198,650,595.67
in 2011 to THB 179,140,123.23 in 2012. While net profit has decreased from THB
4,206,218.58 in 2011 to THB 2,634,892.45 in 2012. And total assets has
decreased from THB 102,264,598.16 in 2011 to THB 101,053,152.23 in 2012.
PROFITABILITY :
RISKY
PROFITABILITY
RATIO
|
Gross Profit Margin |
30.72 |
Deteriorated |
Industrial
Average |
71.21 |
|
Net Profit Margin |
1.47 |
Deteriorated |
Industrial
Average |
7.68 |
|
Return on Assets |
2.61 |
Deteriorated |
Industrial
Average |
15.61 |
|
Return on Equity |
8.39 |
Deteriorated |
Industrial
Average |
26.61 |
Gross Profit Margin used to assess a firm's financial health by
revealing the proportion of money left over from revenues after accounting for the
cost of goods sold. Gross profit margin serves as the source for paying
additional expenses and future savings. The company's figure is 30.72%. When
compared with the industry average, the ratio of the company was lower. This
indicated that company may have problems with control over its costs.
Net Profit Margin is the indicator of the company's efficiency in that
net profit takes into consideration all expenses of the company. A low profit
margin indicates a low margin of safety, higher risk that a decline in sales
will erase profits and result in a net loss. The company's figure is 1.47%.
When compared with the industry average, the ratio of the company was lower.
Return on Assets measures how efficiently profits are being generated
from the assets employed in the business when compared with the ratios of firms
in a similar business. A low ratio in comparison with industry averages
indicates an inefficient use of business assets. When compared with the
industry average, it was lower, the company's figure is 2.61%.
Return on Equity indicates how profitable a company is by comparing its
net income to its average shareholders' equity, ROE measures how much the
shareholders earned for their investment in the company. When compared with the
industry average, it was lower, the company's figure is 8.39%.
Trend of the
average competitors in the same industry for last 5 years
Return on Assets Uptrend
Return on Equity Uptrend
LIQUIDITY :
ACCEPTABLE
LIQUIDITY RATIO
|
Current Ratio |
1.03 |
Acceptable |
Industrial
Average |
1.97 |
|
Quick Ratio |
0.36 |
|
|
|
|
Cash Conversion Cycle |
(0.93) |
|
|
|
The Current Ratio is to ascertain whether a company's short-term assets
are readily available to pay off its short-term liabilities. The company's
figure is 1.03 times in 2012, decrease from 1 times, then it is generally
considered to have good short-term financial strength. When compared with the
industry average, the ratio of the company was lower.
The Quick Ratio is a liquidity indicator that further refines the
current ratio by measuring the amount of the most liquid current assets there
are to cover current liabilities. The company's figure is 0.36 times in 2012,
increase from 0.38 times, then the company has not enough current assets that
presumably can be quickly converted to cash for pay financial obligations.
The Cash Conversion Cycle measures the number of days a company's cash
is tied up in the production and sales process of its operations and the
benefit from payment terms from its creditors. It meant the company could
survive when no cash inflow was received from sale for -1 days.
Trend of the
average competitors in the same industry for last 5 years
Current Ratio Uptrend
LEVERAGE :
ACCEPTABLE
LEVERAGE RATIO
|
Debt Ratio |
0.69 |
Acceptable |
Industrial
Average |
0.39 |
|
Debt to Equity Ratio |
2.22 |
Risky |
Industrial
Average |
0.63 |
|
Times Interest Earned |
7.81 |
Impressive |
Industrial
Average |
- |
Debt to Equity Ratio a measurement of how much suppliers, lenders, creditors
and obligors have committed to the company versus what the shareholders have
committed. A lower the percentage means that the company is using less leverage
and has a stronger equity position.
Times Interest Earned measuring a company's ability to meet its debt
obligations. Ratio is 7.82 higher than 1, so the company can pay interest
expenses on outstanding debt.
Debt Ratio shows the proportion of a company's assets which are financed
through debt. The company's figure is 0.69 greater than 0.5, most of the
company's assets are financed through debt.
Trend of the
average competitors in the same industry for last 5 years
Debt Ratio Downtrend
Times Interest Earned Downtrend
ACTIVITY :
SATISFACTORY
ACTIVITY RATIO
|
Fixed Assets Turnover |
6.79 |
Impressive |
Industrial
Average |
- |
|
Total Assets Turnover |
1.77 |
Satisfactory |
Industrial
Average |
2.03 |
|
Inventory Conversion Period |
129.35 |
|
|
|
|
Inventory Turnover |
2.82 |
Deteriorated |
Industrial
Average |
8.58 |
|
Receivables Conversion Period |
48.78 |
|
|
|
|
Receivables Turnover |
7.48 |
Impressive |
Industrial
Average |
4.92 |
|
Payables Conversion Period |
179.06 |
|
|
|
The company's Account Receivable Ratio is calculated as 7.48 and 7.39 in
2012 and 2011 respectively. This ratio measures the efficiency of the company
in managing its trade debtors to generate revenue. A lower ratio may indicate
over extension and collection problems. Conversely, a higher ratio may indicate
an overtly stringent policy. In this case, the company's A/R ratio in 2012
increased from 2011. This would suggest the company had good performance in the
management of its debt collections.
Inventory Turnover in Days Ratio indicates the liquidity of inventory.
It estimates the number of days that it will take to sell the current
inventory. Inventory is particularly sensitive to change in business
activities. The inventory turnover in days has increased from 107 days at the
end of 2011 to 129 days at the end of 2012. This represents a negative trend.
And Inventory turnover has decreased from 3.4 times in year 2011 to 2.82 times
in year 2012.
The company's Total Asset Turnover is calculated as 1.77 times and 1.94
times in 2012 and 2011 respectively. This ratio is determined by dividing total
assets into total sales turnover. The ratio measures the activity of the assets
and the ability of the firm to generate sales through the use of the assets.
Trend of the
average competitors in the same industry for last 5 years
Fixed Assets Turnover Downtrend
Total Assets Turnover Uptrend
Inventory Turnover Uptrend
Receivables Turnover Downtrend
FOREIGN EXCHANGE RATES
|
Currency |
Unit
|
Indian Rupees |
|
US Dollar |
1 |
Rs.61.46 |
|
|
1 |
Rs.98.99 |
|
Euro |
1 |
Rs.84.72 |
INFORMATION DETAILS
|
Report
Prepared by : |
NIS |
RATING EXPLANATIONS
|
RATING |
STATUS |
PROPOSED CREDIT LINE |
|
|
>86 |
Aaa |
Possesses an extremely sound financial base with the strongest
capability for timely payment of interest and principal sums |
Unlimited |
|
71-85 |
Aa |
Possesses adequate working capital. No caution needed for credit
transaction. It has above average (strong) capability for payment of interest
and principal sums |
Large |
|
56-70 |
A |
Financial & operational base are regarded healthy. General
unfavourable factors will not cause fatal effect. Satisfactory capability for
payment of interest and principal sums |
Fairly Large |
|
41-55 |
Ba |
Overall operation is considered normal. Capable to meet normal
commitments. |
Satisfactory |
|
26-40 |
B |
Capability to overcome
financial difficulties seems comparatively below average. |
Small |
|
11-25 |
Ca |
Adverse factors are apparent. Repayment of interest and principal sums
in default or expected to be in default upon maturity |
Limited with
full security |
|
<10 |
C |
Absolute credit risk exists. Caution needed to be exercised |
Credit not
recommended |
|
-- |
NB |
New Business |
-- |
This score serves as a reference to assess SC’s credit risk and
to set the amount of credit to be extended. It is calculated from a composite
of weighted scores obtained from each of the major sections of this report. The
assessed factors and their relative weights (as indicated through %) are as
follows:
Financial
condition (40%) Ownership
background (20%) Payment
record (10%)
Credit history
(10%) Market trend
(10%) Operational
size (10%)
This report is issued at your request without any
risk and responsibility on the part of MIRA INFORM PRIVATE LIMITED (MIPL)
or its officials.