MIRA
INFORM REPORT
|
Report Date : |
31.10.2013 |
IDENTIFICATION DETAILS
|
Name : |
GENEROS
DE PUNTO VICTRIX SL |
|
|
|
|
Registered Office : |
Calle De
L’overlocaire (Pg Ind Les Hortes), 24 - 28 08302 Mataro Barcelona |
|
|
|
|
Country : |
|
|
|
|
|
Financials (as on) : |
31.12.2012 |
|
|
|
|
Date of Incorporation : |
12.05.1976 |
|
|
|
|
Legal Form : |
Limited Liability Company |
|
|
|
|
Line of Business : |
Wholesale of textile, clothing, footwear. |
|
|
|
|
No. of Employees : |
24 |
RATING & COMMENTS
|
MIRA’s Rating : |
B |
|
RATING |
STATUS |
PROPOSED CREDIT LINE |
|
|
26-40 |
B |
Capability to overcome financial difficulties seems comparatively
below average. |
Small |
|
Status : |
Moderate |
|
|
|
|
Payment Behaviour : |
Slow but correct |
|
|
|
|
Litigation : |
Clear |
NOTES :
Any query related to this report can be made
on e-mail: infodept@mirainform.com
while quoting report number, name and date.
ECGC Country Risk Classification List – March 31st, 2013
|
Country Name |
Previous Rating (31.12.2012) |
Current Rating (31.03.2013) |
|
|
A2 |
A2 |
|
Risk Category |
ECGC
Classification |
|
Insignificant |
A1 |
|
Low |
A2 |
|
Moderate |
B1 |
|
High |
B2 |
|
Very High |
C1 |
|
Restricted |
C2 |
|
Off-credit |
D |
After almost 15 years of above average GDP growth, the
Spanish economy began to slow in late 2007 and entered into a recession in the
second quarter of 2008. GDP contracted by 3.7% in 2009, ending a 16-year growth
trend, and by another 0.3% in 2010; GDP expanded 0.4% in 2011, before
contracting 1.4% in 2012. The economy has once again fallen into recession as
deleveraging in the private sector, fiscal consolidation, and continued high
unemployment weigh on domestic demand and investment, even as exports have
shown signs of resiliency. The unemployment rate rose from a low of about 8% in
2007 to 26.0% in 2012. The economic downturn has also hurt
|
Source : CIA |
EXECUTIVE SUMMARY
Identification
Current Business
Name: GENEROS DE PUNTO
VICTRIX SL
Commercial
name: GENEROS DE PUNTO
VICTRIX, S.A.
Other names: YES
Current
Address: CALLE DE L’OVERLOCAIRE (PG IND LES HORTES), 24 -
28
Branches: 2
Telephone
number: 937412080
Fax: 937996500
URL: www.victrix.es
Financial Information
Balance sheet
latest sales (2012): 63.878.147,51 € (Mercantile Register)
Result: -3.369.883,53 €
Total
Assets: 76.946.612,08 €
Share
capital: 858.004,88 €
Employees: 50
Listed on a Stock
Exchange: NO
Commercial Information
Incorporation
date: 12/05/1976
Activity: Wholesale of textile, clothing, footwear , etc.
NACE 2009
CODE: 4642
International
Operations: Imports and Exports
Corporate Structure
President:
Parent Company:
Participations: 8
Other Complementary Information
Latest filed
accounts in the Mercantile Register: 2012
Latest act
published in BORME: 12/08/2013 Appointments
Latest press article: 09/06/2004 EL PERIÓDICO DE CATALUNYA (LEGAL ANNOUNCEMENTS)
Bank
Entities: There are
The date when this report was last updated
is 28/10/2013.
The information contained in this report has
been investigated and contrasted on 28/10/2013
Financial situation
|
Exercise:2012 |
|
||
|
Immediate liquidity |
Very degraded |
|
|
|
Indebtedness |
Slight |
|
|
|
Profitability |
Unfavourable |
|
|
|
Soundness |
Average |
|
|
Performance
|
Incidents |
None or Negligible |
|
Business Trajectory |
Excellent |
Rating Informa Explanation
Financial
situation
The company’s financial situation
is unfavourable.
The sales evolution and results has
been negative.
The auditor’s opinion about the latest
accounts has been favourable.
Company Structure
The company’s capitalization degree determines
that its structure is sound.
The company’s size is
big depending on its sales volume.
The employees evolution has
been positive.
Performance and
Incidences
The available information indicates that the
company does not have payment incidences.
He have detected no recent legal actions or
claims from the Administration against this company.
Accounts Filing
The company files regularly its accounts.
Reasons of the last outstanding calculation in the note
|
DATE |
CHANGE |
RESULTING NOTE |
EVENT |
|
12/09/2013 |
Reduction |
8 |
New financial statements have been
uploaded. |
|
30/11/2012 |
Reduction |
13 |
There has been a change in the formula
version. |
|
05/10/2012 |
Reduction |
16 |
New financial statements have been
uploaded. |
|
09/12/2011 |
Increase |
17 |
New financial statements have been
uploaded. |
Summary
LEGAL
ACTIONS: No legal actions registered
ADMINISTRATIVE
CLAIMS: No administrative claims registered
AFFECTED BY: No significant
element.
EXPERIAN BUREAU EMPRESARIAL
BANK AND MULTI - SECTORIAL DEFAULTS OF PAYMENT ![]()
R.A.I.
COMPANY NOT
REGISTERED IN THE R.A.I.
This company is not registered in the
Disputed Bills register (R.A.I.)
DATE AND TIME OF
THE CONSULTATION
22/10/2013 15:10:44
Information from the Registro de
Aceptaciones Impagados (RAI)- Disputed Bills register.
It can only be used for information
legitimate needs of the consulting party, in accordance with its social or
business activity, in order to grant a credit or the monitoring or control of
the already granted credits and can not be transmitted or communicated to
thirds, nor copied, duplicated, reproduced nor implemented to any database ,
owned or external, or reused it in anyway, direct or indirectly.
FINANCIAL ELEMENTS AND SECTORIAL COMPARATIVE
FINANCIAL ELEMENTS
Figures given in €
|
|
31/12/2012 (12) BALANCE SHEET |
% ASSETS |
31/12/2011 (12) BALANCE SHEET |
% ASSETS |
31/12/2010 (12) BALANCE SHEET |
% ASSETS |
|
ASSETS |
|
|
|
|
|
|
|
A) NON CURRENT ASSETS |
41.356.734,82 |
53,75 |
38.575.080,71 |
51,47 |
14.619.595,45 |
22,71 |
|
B) CURRENT ASSETS |
35.589.877,26 |
46,25 |
36.375.109,93 |
48,53 |
49.751.732,31 |
77,29 |
|
LIABILITIES |
|
|
|
|
|
|
|
A) NET WORTH |
38.231.294,99 |
49,69 |
42.408.165,03 |
56,58 |
36.309.313,02 |
56,41 |
|
B) NON CURRENT LIABILITIES |
4.643.406,75 |
6,03 |
5.122.294,10 |
6,83 |
977.447,59 |
1,52 |
|
C) CURRENT LIABILITIES |
34.071.910,34 |
44,28 |
27.419.731,51 |
36,58 |
27.084.567,15 |
42,08 |
Profit and loss
account analysis ![]()
Figures given in €
|
|
31/12/2012 (12) BALANCE SHEET |
% NET TURNOVER |
31/12/2011 (12) BALANCE SHEET |
% NET TURNOVER |
31/12/2010 (12) BALANCE SHEET |
% NET TURNOVER |
|
SALES |
63.878.147,51 |
|
73.406.564,46 |
|
77.645.755,17 |
|
|
GROSS MARGIN |
4.773.480,96 |
7,47 |
9.651.031,52 |
13,15 |
10.824.523,60 |
13,94 |
|
EBITDA |
-3.893.414,47 |
-6,10 |
1.131.559,29 |
1,54 |
3.037.868,78 |
3,91 |
|
EBIT |
-4.873.275,76 |
-7,63 |
271.676,48 |
0,37 |
2.193.421,82 |
2,82 |
|
NET RESULT |
-3.369.883,53 |
-5,28 |
6.123.287,46 |
8,34 |
5.653.338,60 |
7,28 |
|
EFFECTIVE TAX RATE (%) |
-29,73 |
0,00 |
0,88 |
0,00 |
4,22 |
0,00 |
COMPARATIVE SECTOR
ANALYSIS
Values table
Figures expressed in %
|
|
COMPANY (2012) |
SECTOR |
DIFFERENCE |
|
|
|
|
|
BALANCE SHEET
ANALYSIS: % on the total assets |
|
|
|
|
|
|
|
|
ASSETS |
|
|
|
|
|||
|
A) NON CURRENT ASSETS |
53,75 |
56,72 |
-2,97 |
|
|
|
|
|
A) CURRENT ASSETS |
46,25 |
43,28 |
2,97 |
|
|
|
|
|
LIABILITIES |
|
|
|
|
|||
|
A) NET WORTH |
49,69 |
47,47 |
2,22 |
|
|
|
|
|
B) NON CURRENT LIABILITIES |
6,03 |
11,98 |
-5,95 |
|
|
|
|
|
C) CURRENT LIABILITIES |
44,28 |
40,55 |
3,73 |
|
|
|
|
|
|
|
|
|
|
|
|
|
|
|
COMPANY (2012) |
SECTOR |
DIFFERENCE |
|
|
|
|
|
PROFIT AND LOSS
ACCOUNT ANALYSIS: % on the total operating income |
|
|
|
|
|
|
|
|
SALES |
99,95 |
97,55 |
2,40 |
|
|
|
|
|
GROSS MARGIN |
7,47 |
36,65 |
-29,18 |
|
|
|
|
|
EBITDA |
-6,09 |
16,79 |
-22,88 |
|
|
|
|
|
EBIT |
-7,63 |
15,25 |
-22,88 |
|
|
|
|
|
NET RESULT |
-5,27 |
14,53 |
-19,80 |
|
|
|
|
Sector Composition
Compared sector
(NACE 2009): 4642
Number of
companies: 22
Size (sales
figure): > 40,000,000.00 Euros
OTHER DATA FROM
THE ANNUAL FINANCIAL REPORT
Results Distribution
Source: annual financial
report 2012
Figures given in €
|
DISTRIBUTION
BASE |
APPLICATION A |
||
|
Profit and Loss Account Balance |
-3.369.883,53 |
Legal Reserve |
0,00 |
|
Carry over |
0,00 |
Goodwill reserve |
0,00 |
|
Voluntary reserves |
0,00 |
Special reserves |
0,00 |
|
Other reserves disposable at will |
0,00 |
Voluntary reserves |
0,00 |
|
Total of Amounts
to be distributed |
-3.369.883,53 |
Dividends |
0,00 |
|
|
|
Carry over and others |
0,00 |
|
|
|
Compensation of previous exercises losses |
-3.369.883,53 |
|
|
|
Application
total |
-3.369.883,53 |
Auditing
Source: filing of annual
financial statement 2012
Auditors’
opinion: FAVOURABLE
Auditor: RSM GASSO
AUDITORES S.L.P.
Auditing
fees: 26.000,00 €
Facts subsequent to the closing
Source: Annual
financial report 2012
After the closure no relevant facts
requiring their inclusion in the annual accounts have taken place.
ADDRESSES
Current Legal Seat
Address:
CALLE DE L’OVERLOCAIRE (PG IND LES
HORTES), 24 - 28
08302 MATARO BARCELONA
Previous Seat
Address:
CAMINO RAL 631
08302 MATARO BARCELONA
|
STREET |
POSTAL CODE |
TOWN |
PROVINCE |
|
CAMINO RAL (639 0000), 631 |
08302 |
MATARO |
Barcelona |
|
CALLE VIA SERGIA, 51 |
08302 |
MATARO |
Barcelona |
There are 2 branches registered
|
STREET |
POSTAL CODE |
TOWN |
PROVINCE |
|
RONDA PRESIDENT
MACIA, 14 - VIA SERGIA 51 |
08302 |
MATARO |
Barcelona |
|
CALLE URIA, 21 |
33003 |
OVIEDO |
Asturias |
There are 2 former branches
registered
CORPORATE
STRUCTURE
ADMINISTRATIVE
LINKS
Summary 
|
|
|
|
|
|
Distribution of
the administration board |
|
|
Governing body : 7 members (latest
change: 05/10/2011) Other Positions
: 1 (latest
change: 05/10/2011) Auditor : 3 (latest
change: 04/02/2013) Operative Board
Members : 3 (latest change: 28/10/2013) Non-current
positions : 14 (latest change: 01/08/2013) |
|
|
Main Board members, Directors and Auditor
Governing body
|
POSITION |
NAME AND SURNAME |
DATE APPOINTMENT |
|
PRESIDENT |
GARCIA BLANCHART, CARLOS |
05/10/2011 |
|
VICE-PRESIDENT |
GARCIA BLANCHART, MONTSERRAT |
05/10/2011 |
|
MEMBER OF THE BOARD |
HILARIO RUBERT, LLUIS |
26/03/2008 |
|
MEMBER OF THE BOARD |
BURGUES BASSOLS, LUIS |
26/03/2008 |
|
|
|
|
Auditor
|
POSITION |
NAME AND SURNAME |
DATE APPOINTMENT |
|
AUDITOR |
ADDVERA AUDITORS SLP |
27/01/2010 |
|
AUDITOR |
RSM GASSO AUDITORES SLP |
04/02/2013 |
|
CONSOLIDATED ACCOUNTS AUDITOR |
RSM GASSO AUDITORES SLP |
18/01/2013 |
There are 11 board members,
directors and auditors registered
Board members remuneration
Source: Annual
financial report 2010
Board members
remuneration: 656.840,33 €
|
POSITION |
NAME AND SURNAME |
|
General Manager |
GARCIA LOPEZ, RODRIGO |
|
Financial Manager |
ORTEGA, FRANCISCO |
|
Commercial Director |
GARCIA LOPEZ, RODRIGO |
FINANCIAL LINKS
|
|
BUSINESS NAME |
TAX NUMBER/COUNTRY |
% |
SOURCE |
DATE REP. |
|
|
GARCIA LOPEZ RODRIGO |
|
99,98 |
OWN SOURCES |
13/05/2013 |
There are 1 direct financial links
through shareholders registered
|
|
BUSINESS NAME |
TAX
NUMBER/COUNTRY |
% |
SOURCE |
DATE REP. |
|
|
PUNT ROMA SL |
B61481198 |
Indef. |
OWN SOURCES |
13/05/2013 |
|
|
BUSINESS NAME |
TAX
NUMBER/COUNTRY |
% |
SOURCE |
DATE REP. |
|
|
VICTRIX ISLAS SL |
B38713475 |
100,00 |
OWN SOURCES |
01/02/2013 |
|
|
VICTRIX LOGISTIC SL |
B64765928 |
100,00 |
MERCANTILE REGISTER |
31/12/2012 |
|
|
PUNT ROMA PORTUGAL UNIPESSOAL LDA |
PORTUGAL |
100,00 |
MERCANTILE REGISTER |
31/12/2012 |
|
|
PUNT ROMA SL |
B61481198 |
99,58 |
OWN SOURCES |
07/03/2013 |
|
|
INVERSIONES Y PROMOCIONES SIMON Y QUIJORNA
SL |
B83595488 |
99,58 |
MERCANTILE REGISTER |
31/12/2012 |
|
|
CARIBEAN TEXTIL SL |
B61103651 |
98,00 |
MERCANTILE REGISTER |
31/12/2012 |
|
|
ACORDFIL SL |
B58098617 |
95,00 |
OWN SOURCES |
03/06/2013 |
|
|
DOSPUNT SL |
B58098633 |
90,00 |
MERCANTILE REGISTER |
31/12/2012 |
There are 8 direct financial links
through participations registered
You can obtain business information of
foreign companies at the page D&B INTERNATIONAL
![]() Company with rating inferior to 7
Company with rating inferior to 7
|
|
BUSINESS NAME |
TAX
NUMBER/COUNTRY |
% |
SOURCE |
DATE REP. |
|
|
ALCE 2005 SL |
B63897649 |
100,00 |
B.O.R.M.E. |
20/06/2013 |
|
|
RODRI SA (EXTINGUIDA) |
A08407314 |
100,00 |
B.O.R.M.E. |
01/02/2012 |
![]() Company with rating inferior to 7
Company with rating inferior to 7
POTENTIAL LINKS
Search for Link by
Administrator ![]()
Search Criterion: ”CARLOS GARCIA
BLANCHART”
|
COMPANY |
POSITION |
PROVINCE |
|
ROBRESA SA |
Administrador |
BARCELONA |
|
HOTEL CIUTAT DE MATARO SA |
Administrador |
BARCELONA |
|
PUNT ROMA SL |
Apoderado |
BARCELONA |
|
BETA 16 SL |
Administrador Solidario |
BARCELONA |
|
VIROCA SA |
Administrador Solidario |
BARCELONA |
In case you need more information you can
request:Board Members Monitoring
BUSINESS INFORMATION
Incorporation
date: 12/05/1976
Establishment
date: 01/01/1976
Founder’s
Name: LA TITULAR ES LA FUNDADORA INICIAL DEL NEGOCIO
Informa
Code: 1613100
Informa
Activity: Wholesale of textile, clothing, footwear , etc.
NACE 2009
CODE: 4642
NACE 2009
Activity: Wholesale of clothing and footwear
Business: 1. LA ACTIVIDAD
PROPIA DE LA SOCIEDAD HOLDING, CONSISTENTE EN: A) LA INVERSION DE SUS FONDOS EN
OTRAS SOCIEDADES, ADQUIRIENDO ACCIONES Y PARTICIPACIONES DE LAS MISMAS, ASI
COMO LA ADMINISTRACION Y GESTION PROFESIONAL DE.
Activity
description: COMERCIO DE PRODUCTOS TEXTILES
Environmental
information: YES (Page 83) Annual financial
report 2012
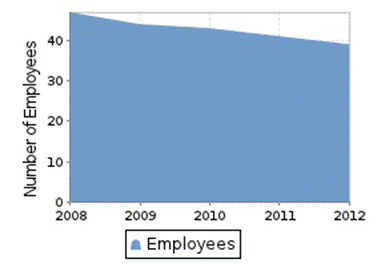
Latest employees
figure: 50 (2013)
% of fixed
employees: 100,00%
% of men: 77,50%
% of women: 22,50%
Employees
evolution
|
|
|
|
Source: Annual
financial report 2012
|
CATEGORY |
AVERAGE NUMBER
OF EMPLOYEES |
MEN |
WOMEN |
|
Other managers |
3 |
3 |
1 |
|
Administrative employees |
5 |
1 |
3 |
|
Sales representatives and similar |
1 |
|
1 |
|
Other qualified employees |
6 |
6 |
|
|
Non qualified employees |
24 |
21 |
4 |
PURCHASES
Import
Percentage: 12%
Imports
from: UE Y OTROS PAISES
National
Distribution: 88%
SALES
Cash
collections: 90%
Export
Percentage: 34%
Exports to: UE Y OTROS PAISES
National
Distribution: 66%
CLIENTS
|
BUSINESS NAME |
INTERNATIONAL |
|
PUNT ROMA |
NO |
There are 1 Clients
El 100% de su cifra de negocio corresponde a
comercio al por mayor de prendas de vestir y calzado.
|
ENTITY |
BRANCH |
ADDRESS |
TOWN OR CITY |
PROVINCE |
|
BANCO SANTANDER, S.A. |
0186 |
PZ DE SANTA ANA 8 APDO. 00005 |
MATARO |
Barcelona |
|
BANCO POPULAR ESPAÑOL, S.A. |
0049 |
LA RAMBLA, 42-44 |
MATARO |
Barcelona |
|
CAIXABANK, S.A. |
|
|
MATARO |
|
There are 3 bank entities
registered
Discount facilities: 1
Credit policy: 2
Mortgage loan: 0
Loans with no real security: 3
|
|
|
|
Debt type: Credit policy |
Granted limit:1.350.000,00 € Used limit:964.940,88 € Available limit:385.059,12 € Source: Filed
Accounts (2012) |
|
|
|
|
Debt type: Credit policy |
Granted limit:7.000.000,00 € Used limit:3.149.739,63 € Available limit:3.850.260,37 € Source: Filed
Accounts (2012) |
|
|
|
|
Debt type: Discount
facilities |
Granted limit:9.000.000,00 € Used limit:0,00 € Available limit:9.000.000,00 € Source: Filed
Accounts (2012) |
|
|
|
|
Entity:BANCO SANTANDER,
S.A. Debt type: Loans with no
real security |
Granted amount:2.000.000,00 € Source: Filed
Accounts (2012) |
|
Operation
description: Compra de la sociedad Alce 2005, S.L.U.. |
|
|
|
|
|
Entity:CAIXABANK, S.A. Debt type: Loans with no
real security |
Granted amount:200.000,00 € Source: Filed
Accounts (2011) |
|
|
|
There are 6 bank operations
registered
Figures given in €
|
ENTITY |
ASSERTS INVOLVED
IN THE ACTIVITY |
UP TO 1 YEAR |
FROM 1 TO 5 YEARS |
MORE THAN 5
YEARS |
|
|
Automatización almacén robotizado |
799.404,01 |
2.986.158,23 |
0,00 |
There are 1 leasing operations
registered
FORMER NAMES:
GENEROS DE PUNTO VICTRIX SA
Brand name: MIA (Valid)
Type: JOINT
Scope: NATIONAL Date: 18/03/2013
Brand name: POLICHINELA (Valid)
Type: DENOMINATIVE
Scope: NATIONAL Date: 01/10/2007
Brand name: VICTRIX (Valid)
Type: DENOMINATIVE
Scope: NATIONAL Date: 26/03/2007
Brand name: PAYASITO (Valid)
Type: DENOMINATIVE
Scope: NATIONAL Date: 16/05/2006
Brand name: OROPENDOLA (Valid)
Type: JOINT
Scope: NATIONAL Date: 16/07/2005
There are 36 brands, signs and
commercial names
Constitution Data
Register
Date: 12/05/1976
Legal form: Limited Liability
Company
Share
capital: 858.004,88 €
Obligation to fill
in Financial Statements: YES
Chamber
census: YES (2011)
B.O.R.M.E.
(OFFICIAL GAZETTE OF THE MERCANTILE REGISTER) ![]()
Acts on activity: 1 (Last: 20/12/2006)
Acts on administrators: 35 (Last:
12/08/2013, first: 10/07/1991)
Acts on capital: 3 (Last:
12/01/2007, first: 07/04/1992)
Acts on creation: 0
Acts on filed accounts: 25 (Last:
22/11/2011, first: 12/11/1992)
Acts on identification: 2 (Last:
20/12/2006, first: 08/09/2004)
Acts on Information: 2 (Last:
07/04/1992, first: 07/04/1992)
Latest acts in
B.O.R.M.E.
Other acts
|
ACT |
DATE |
NOTICE NUM. |
MERCANTILE
REGISTER |
|
Appointments |
12/08/2013 |
358524 |
Barcelona |
|
Resignations |
12/08/2013 |
358524 |
Barcelona |
|
Appointments |
13/02/2013 |
71468 |
Barcelona |
|
Appointments |
28/01/2013 |
40791 |
Barcelona |
|
Annual Filed Accounts (2010) |
22/11/2011 |
950070 |
Barcelona |
|
Annual Filed
Accounts (2010) consolidated |
22/11/2011 |
946126 |
Barcelona |
|
Appointments |
17/10/2011 |
408861 |
Barcelona |
|
Appointments |
17/10/2011 |
408860 |
Barcelona |
|
Resignations |
17/10/2011 |
408860 |
Barcelona |
|
Annual Filed Accounts (2009) |
29/10/2010 |
926014 |
Barcelona |
There are 68 acts registered
Press summary by
type of information (last five years) ![]()
Legal notices: 0
Structural Data: 0
Informative data: 0
Financial Information: 0
Negative information: 0
Business lines: 0
Historical press releases: 1 (Last:
09/06/2004)
Latest press
article published ![]()
09/06/2004 EL
PERIÓDICO DE CATALUNYA - LEGAL ANNOUNCEMENTS
LA JUNTA GENERAL EXTRAORDINARIA DE LA SDAD.,
CELEBRADA EL 15/05/04, ACORDO EL TRASLADO DEL DOMICILIO SOCIAL A MATARO
(08302), C/L’OVERLOCAIRE, N. 24-28
There are 1 press articles
registered for this company
FINANCIAL INFORMATION
The information on the last Individual Filed
Accounts contained in this report is extracted from the Mercantile Register
file of the legal address of the Company and dated 11/09/2013.
SITUATION
BALANCE-SHEET
Assets
Figures given in €
|
|
31/12/2012 (12) |
% ASSETS |
31/12/2011 (12) |
% ASSETS |
31/12/2010 (12) |
% ASSETS |
|
A) NON CURRENT
ASSETS |
41.356.734,82 |
53,75 |
38.575.080,71 |
51,47 |
14.619.595,45 |
22,71 |
|
I. Intangible
assets |
61.908,52 |
0,08 |
7.377,36 |
0,01 |
11.865,44 |
0,02 |
|
5. Software |
61.908,52 |
0,08 |
7.377,36 |
0,01 |
11.865,44 |
0,02 |
|
II. Tangible
fixed assets |
7.706.359,65 |
10,02 |
7.613.312,54 |
10,16 |
3.569.072,12 |
5,54 |
|
2. Technical fittings and other tangible
assets |
1.951.435,91 |
2,54 |
2.571.280,69 |
3,43 |
3.264.244,42 |
5,07 |
|
3. Fixed assets in progress and advances |
5.754.923,74 |
7,48 |
5.042.031,85 |
6,73 |
304.827,70 |
0,47 |
|
III. Real-estate
investments |
|
|
|
|
|
|
|
IV. Long term
investments in associated and affiliated companies |
27.735.521,83 |
36,05 |
28.106.817,07 |
37,50 |
9.105.115,16 |
14,14 |
|
1. Net worth instruments |
15.932.521,83 |
20,71 |
16.193.817,07 |
21,61 |
4.308.539,59 |
6,69 |
|
2. Credits to companies |
11.803.000,00 |
15,34 |
11.913.000,00 |
15,89 |
4.796.575,57 |
7,45 |
|
V. Long Term
Financial Investments |
12.516,31 |
0,02 |
12.516,31 |
0,02 |
12.516,30 |
0,02 |
|
5. Other financial assets |
12.516,31 |
0,02 |
12.516,31 |
0,02 |
12.516,30 |
0,02 |
|
VI. Assets by
deferred taxes |
5.840.428,51 |
7,59 |
2.835.057,43 |
3,78 |
1.921.026,43 |
2,98 |
|
VII. Non current
commercial debts |
|
|
|
|
|
|
|
B) CURRENT
ASSETS |
35.589.877,26 |
46,25 |
36.375.109,93 |
48,53 |
49.751.732,31 |
77,29 |
|
I. Non-current
assets maintained for sale |
|
|
|
|
|
|
|
II. Stocks |
11.886.995,12 |
15,45 |
16.451.118,77 |
21,95 |
15.297.031,18 |
23,76 |
|
1. Goods available for sale |
11.877.457,59 |
15,44 |
16.451.118,77 |
21,95 |
15.287.766,90 |
23,75 |
|
6. Pre-payments to suppliers |
9.537,53 |
0,01 |
|
|
9.264,28 |
0,01 |
|
III. Trade
Debtors and other receivable accounts |
13.015.794,50 |
16,92 |
11.585.252,62 |
15,46 |
30.883.483,70 |
47,98 |
|
1. Clients |
4.921.672,37 |
6,40 |
5.039.990,69 |
6,72 |
2.705.545,90 |
4,20 |
|
b) Clients for sales and short term
services rendering |
4.921.672,37 |
6,40 |
5.039.990,69 |
6,72 |
2.705.545,90 |
4,20 |
|
2. Clients group and associated companies |
8.073.266,28 |
10,49 |
6.531.834,32 |
8,71 |
28.164.938,66 |
43,75 |
|
3. Other debts |
90,15 |
0,00 |
|
|
|
|
|
4. Staff |
12.582,50 |
0,02 |
12.698,02 |
0,02 |
12.332,39 |
0,02 |
|
5. Assets by current taxes |
7.835,88 |
0,01 |
|
|
|
|
|
6. Other credits with the Public
Administrations |
347,32 |
0,00 |
729,59 |
0,00 |
666,75 |
0,00 |
|
IV. Short term
investments in associated and affiliated companies |
10.515.859,80 |
13,67 |
7.639.444,05 |
10,19 |
2.521.833,55 |
3,92 |
|
2. Credits to companies |
480.318,68 |
0,62 |
223.966,97 |
0,30 |
44.021,61 |
0,07 |
|
5. Other financial assets |
10.035.476,96 |
13,04 |
7.415.477,08 |
9,89 |
2.477.811,94 |
3,85 |
|
6. Other investments |
64,16 |
0,00 |
|
|
|
|
|
V. Short term
financial investments |
|
|
|
|
|
|
|
VI. Short term periodifications |
19.543,28 |
0,03 |
10.869,99 |
0,01 |
11.142,60 |
0,02 |
|
VII. Cash and
equivalents |
151.684,56 |
0,20 |
688.424,50 |
0,92 |
1.038.241,28 |
1,61 |
|
1. Treasury |
151.684,56 |
0,20 |
688.424,50 |
0,92 |
1.038.241,28 |
1,61 |
|
TOTAL ASSETS (A
+ B) |
76.946.612,08 |
100,00 |
74.950.190,64 |
100,00 |
64.371.327,76 |
100,00 |
Net Worth and
Liabilities
Figures given in €
|
|
31/12/2012 (12) |
% ASSETS |
31/12/2011 (12) |
% ASSETS |
31/12/2010 (12) |
% ASSETS |
|
A) NET WORTH |
38.231.294,99 |
49,69 |
42.408.165,03 |
56,58 |
36.309.313,02 |
56,41 |
|
A-1) Equity |
38.231.294,99 |
49,69 |
42.408.165,03 |
56,58 |
36.309.313,02 |
56,41 |
|
I. Capital |
858.004,88 |
1,12 |
858.004,88 |
1,14 |
858.004,88 |
1,33 |
|
1. Authorized capital |
858.004,88 |
1,12 |
858.004,88 |
1,14 |
858.004,88 |
1,33 |
|
II. Issue
premium |
|
|
|
|
|
|
|
III. Reserves |
40.743.173,64 |
52,95 |
35.426.872,69 |
47,27 |
29.797.969,54 |
46,29 |
|
1. Legal and statutory |
171.600,98 |
0,22 |
171.600,98 |
0,23 |
171.600,98 |
0,27 |
|
2. Other funds |
40.571.572,66 |
52,73 |
35.255.271,71 |
47,04 |
29.626.368,56 |
46,02 |
|
IV. (Net worth
own shares and participations) |
|
|
|
|
|
|
|
V. Results from
previous years |
|
|
|
|
|
|
|
VI. Other loans
from partners |
|
|
|
|
|
|
|
VII. Exercise
Result |
-3.369.883,53 |
-4,38 |
6.123.287,46 |
8,17 |
5.653.338,60 |
8,78 |
|
VIII. (Interim
dividend) |
|
|
|
|
|
|
|
IX. Other net
worth instruments |
|
|
|
|
|
|
|
A-2) Value
changes adjustments |
|
|
|
|
|
|
|
I. Financial
assets available for sale |
|
|
|
|
|
|
|
II. Coverage
operations |
|
|
|
|
|
|
|
III. Non-current
assets and related liabilities, maintained for sale |
|
|
|
|
|
|
|
IV. Conversion
differences |
|
|
|
|
|
|
|
V. Other |
|
|
|
|
|
|
|
A-3) Received
legacies, grants and subventions |
|
|
|
|
|
|
|
B) NON CURRENT
LIABILITIES |
4.643.406,75 |
6,03 |
5.122.294,10 |
6,83 |
977.447,59 |
1,52 |
|
I. Long term provisions |
|
|
|
|
|
|
|
II. Long term
debts |
4.293.406,75 |
5,58 |
5.122.294,10 |
6,83 |
977.447,59 |
1,52 |
|
2. Debts with bank entities |
1.307.248,52 |
1,70 |
1.331.693,52 |
1,78 |
827.447,59 |
1,29 |
|
3. Financial leasing creditors |
2.986.158,23 |
3,88 |
3.790.600,58 |
5,06 |
|
|
|
5. Other financial liabilities |
|
|
|
|
150.000,00 |
0,23 |
|
III. Long term
debts with associated and affiliated companies |
350.000,00 |
0,45 |
|
|
|
|
|
IV. Liabilities
by deferred taxes |
|
|
|
|
|
|
|
V. Long term
periodifications |
|
|
|
|
|
|
|
VI. Non current
trade creditors |
|
|
|
|
|
|
|
VII. Long term
debts with special characteristics |
|
|
|
|
|
|
|
C) CURRENT
LIABILITIES |
34.071.910,34 |
44,28 |
27.419.731,51 |
36,58 |
27.084.567,15 |
42,08 |
|
I. Liabilities
related with non-current assets maintained for sale |
|
|
|
|
|
|
|
II. Short term
provisions |
|
|
|
|
|
|
|
III. Short term
debts |
7.212.923,50 |
9,37 |
4.750.243,26 |
6,34 |
4.486.858,28 |
6,97 |
|
2. Debts with bank entities |
6.338.518,99 |
8,24 |
4.174.603,84 |
5,57 |
4.119.497,21 |
6,40 |
|
3. Financial leasing creditors |
799.404,01 |
1,04 |
446.749,42 |
0,60 |
342.361,07 |
0,53 |
|
5. Other financial liabilities |
75.000,50 |
0,10 |
128.890,00 |
0,17 |
25.000,00 |
0,04 |
|
IV. Short term
debts with associated and affiliated companies |
1.572.669,96 |
2,04 |
2.094.751,37 |
2,79 |
2.345.756,87 |
3,64 |
|
V. Trade
creditors and other payable accounts |
25.286.316,88 |
32,86 |
20.574.736,88 |
27,45 |
20.251.952,00 |
31,46 |
|
1. Suppliers |
4.878.741,25 |
6,34 |
5.174.593,55 |
6,90 |
4.913.246,29 |
7,63 |
|
b) Short term suppliers |
4.878.741,25 |
6,34 |
5.174.593,55 |
6,90 |
4.913.246,29 |
7,63 |
|
2. Suppliers group and associated
companies |
19.260.268,38 |
25,03 |
13.735.760,51 |
18,33 |
13.239.591,92 |
20,57 |
|
3. Different creditors |
703.892,67 |
0,91 |
751.228,43 |
1,00 |
600.971,13 |
0,93 |
|
4. Staff (pending remunerations) |
132.000,00 |
0,17 |
|
|
|
|
|
6. Other debts with Public Administrations |
311.414,58 |
0,40 |
913.154,39 |
1,22 |
1.342.197,17 |
2,09 |
|
7. Clients pre-payments |
|
|
|
|
155.945,49 |
0,24 |
|
VI. Short term
periodifications |
|
|
|
|
|
|
|
VII. Short term debts
with special characteristics |
|
|
|
|
|
|
|
TOTAL NET WORTH
AND LIABILITIES (A + B + C) |
76.946.612,08 |
100,00 |
74.950.190,64 |
100,00 |
64.371.327,76 |
100,00 |
PROFIT AND LOSS
ACCOUNT
Figures given in €
|
|
31/12/2012 (12) |
%OPERATING INCOME |
31/12/2011 (12) |
%OPERATING INCOME |
31/12/2010 (12) |
%OPERATING INCOME |
|
A) CONTINUED
OPERATIONS |
|
|
|
|
|
|
|
1. Net Turnover |
63.878.147,51 |
99,95 |
73.406.564,46 |
100,00 |
77.645.755,17 |
100,00 |
|
A) Sales |
63.878.147,51 |
99,95 |
73.406.564,46 |
100,00 |
77.645.755,17 |
100,00 |
|
2. Variation in
stocks of finished goods and work in progress |
|
|
|
|
|
|
|
3. Works for its
own assets |
|
|
|
|
|
|
|
4. Supplies |
-59.136.708,50 |
-92,53 |
-63.755.532,94 |
-86,85 |
-66.822.059,64 |
-86,06 |
|
a) Material consumed |
-58.670.191,09 |
-91,80 |
-63.206.657,92 |
-86,10 |
-66.263.074,37 |
-85,34 |
|
b) Raw materials consumed |
-282.097,21 |
-0,44 |
-280.409,26 |
-0,38 |
-359.799,28 |
-0,46 |
|
c) Works carried out for other companies |
-184.420,20 |
-0,29 |
-268.465,76 |
-0,37 |
-199.185,99 |
-0,26 |
|
5. Other
operating income |
32.041,95 |
0,05 |
|
|
828,07 |
0,00 |
|
a) Other incomes |
32.041,95 |
0,05 |
|
|
828,07 |
0,00 |
|
6. Labour cost |
-2.839.245,44 |
-4,44 |
-2.888.977,10 |
-3,94 |
-2.977.653,93 |
-3,83 |
|
a) Wages and similar expenses |
-2.458.397,93 |
-3,85 |
-2.502.954,23 |
-3,41 |
-2.586.971,02 |
-3,33 |
|
b) Social costs |
-380.847,51 |
-0,60 |
-386.022,87 |
-0,53 |
-390.682,91 |
-0,50 |
|
7. Other
operating costs |
-5.929.422,65 |
-9,28 |
-5.659.353,43 |
-7,71 |
-4.866.230,63 |
-6,27 |
|
a) External services |
-5.792.788,76 |
-9,06 |
-5.634.435,11 |
-7,68 |
-4.813.616,28 |
-6,20 |
|
b) Taxes |
-20.982,59 |
-0,03 |
-19.499,09 |
-0,03 |
-52.614,35 |
-0,07 |
|
c) Losses, deterioration and variation on
business operations provisions |
-81.614,65 |
-0,13 |
|
|
|
|
|
d) Other day to day expenses |
-34.036,65 |
-0,05 |
-5.419,23 |
-0,01 |
|
|
|
8. Amortization
of fixed assets |
-898.246,64 |
-1,41 |
-859.882,81 |
-1,17 |
-844.446,96 |
-1,09 |
|
9. Allocation of
subventions on non financial investments and other |
|
|
|
|
|
|
|
10. Provisions
excess |
|
|
|
|
|
|
|
11. Deterioration
and result for fixed assets disposal |
-6.703,12 |
-0,01 |
|
|
|
|
|
b) Results for disposals and others |
-6.703,12 |
-0,01 |
|
|
|
|
|
12. Negative
difference of business combinations |
|
|
|
|
|
|
|
13. Other
results |
26.861,13 |
0,04 |
28.858,30 |
0,04 |
57.229,74 |
0,07 |
|
A.1) OPERATING
RESULT (1 + 2 + 3 + 4 + 5 + 6 + 7 + 8 + 9 + 10 + 11 + 12 + 13) |
-4.873.275,76 |
-7,63 |
271.676,48 |
0,37 |
2.193.421,82 |
2,82 |
|
14. Financial
income |
482.540,80 |
0,76 |
6.177.614,93 |
8,42 |
44.576,86 |
0,06 |
|
a) From net worth instruments
participations |
|
|
5.950.000,00 |
8,11 |
|
|
|
a 1) On group and associated companies |
|
|
5.950.000,00 |
8,11 |
|
|
|
b) From negotiable values and other
financial instruments |
482.540,80 |
0,76 |
227.614,93 |
0,31 |
44.576,86 |
0,06 |
|
b 1) From group and associated companies |
480.318,68 |
0,75 |
223.966,97 |
0,31 |
44.021,61 |
0,06 |
|
b 2) From third parties |
2.222,12 |
0,00 |
3.647,96 |
0,00 |
555,25 |
0,00 |
|
15. Financial
expenses |
-339.311,42 |
-0,53 |
-321.033,50 |
-0,44 |
-252.845,16 |
-0,33 |
|
a) For debts with associated and
affiliated companies |
|
|
-79.794,52 |
-0,11 |
|
|
|
b) For debts with third parties |
-339.311,42 |
-0,53 |
-241.238,98 |
-0,33 |
-252.845,16 |
-0,33 |
|
16. Reasonable
value variation on financial instruments |
|
|
|
|
|
|
|
17. Exchange
differences |
194.367,55 |
0,30 |
-29.931,11 |
-0,04 |
491.036,56 |
0,63 |
|
18.
Deterioration and result for disposal of financial instruments |
-260.229,61 |
-0,41 |
79.376,51 |
0,11 |
3.426.116,21 |
4,41 |
|
a) Deteriorations and losses |
-258.895,24 |
-0,41 |
-4.623,03 |
-0,01 |
-573.883,79 |
-0,74 |
|
b) Results for disposals and others |
-1.334,37 |
0,00 |
83.999,54 |
0,11 |
4.000.000,00 |
5,15 |
|
19. Other
financial income and expenses |
|
|
|
|
|
|
|
A.2) FINANCIAL
RESULT (14 + 15 + 16 + 17 + 18 + 19) |
77.367,32 |
0,12 |
5.906.026,83 |
8,05 |
3.708.884,47 |
4,78 |
|
A.3) RESULT
BEFORE TAXES (A.1 + A.2) |
-4.795.908,44 |
-7,50 |
6.177.703,31 |
8,42 |
5.902.306,29 |
7,60 |
|
20. Taxes on
profits |
1.426.024,91 |
2,23 |
-54.415,85 |
-0,07 |
-248.967,69 |
-0,32 |
|
A.4) EXERCISE
RESULT COMING FROM CONTINUED OPERATIONS (A.3 + 20) |
-3.369.883,53 |
-5,27 |
6.123.287,46 |
8,34 |
5.653.338,60 |
7,28 |
|
B) DISCONTINUED
OPERATIONS |
|
|
|
|
|
|
|
21. Net of taxes
exercise result coming from discontinued operations |
|
|
|
|
|
|
|
A.5) EXERCISE
RESULT (A.4 + 21) |
-3.369.883,53 |
-5,27 |
6.123.287,46 |
8,34 |
5.653.338,60 |
7,28 |
NET WORTH CHANGES
STATUS
Status of
recognized income and expenses
Figures given in €
|
NET WORTH
CHANGES (1/2) |
31/12/2012 (12) |
31/12/2011 (12) |
31/12/2010 (12) |
|
A) PROFIT AND
LOSS ACCOUNT RESULT |
-3.369.883,53 |
6.123.287,46 |
5.653.338,60 |
|
INCOME AND
EXPENSES ALLOCATED DIRECTLY TO NET WORTH |
|
|
|
|
I. For valuation
of financial instruments |
|
|
|
|
II. Cash flow
coverage |
|
|
|
|
III. Received
legacies, grants and subventions |
|
|
|
|
IV. For actuarial
profits and losses and other adjustments |
|
|
|
|
V. Non-current
assets and related liabilities, maintained for sale |
|
|
|
|
VI. Conversion
differences |
|
|
|
|
VII. Tax effect |
|
|
|
|
B) TOTAL INCOME AND
EXPENSES ALLOCATED DIRECTLY TO NET WORTH (I + II + III + IV +V+VI+VII) |
|
|
|
|
PROFIT AND LOSS
ACCOUNT TRANSFERS |
|
|
|
|
VIII. For
valuation of financial instruments |
|
|
|
|
IX. Cash flow
coverage |
|
|
|
|
X. Received legacies,
grants and subventions |
|
|
|
|
XI. Non-current
assets and related liabilities, maintained for sale |
|
|
|
|
XII. Conversion
differences |
|
|
|
|
XIII. Tax effect |
|
|
|
|
C) TOTAL TRANSFERS
TO THE PROFIT AND LOSS ACCOUNT (VIII + IX + X + XI+ XII+ XIII) |
|
|
|
|
TOTAL INCOME AND
EXPENSES RECOGNIZED (A + B + C) |
-3.369.883,53 |
6.123.287,46 |
5.653.338,60 |
Total net worth
changes status
Figures given in €
|
NET WORTH
CHANGES ( 2 /2) |
AUTHORIZED
CAPITAL |
RESERVES |
EXERCISE RESULT |
TOTAL |
|
FINAL ACCOUNT
BALANCE OF EXERCISE (2009) |
858.004,88 |
30.920.190,16 |
260.083,97 |
32.038.279,01 |
|
I. Adjustments
by change of criteria in the exercise (2009) |
|
|
|
|
|
II. Adjustments
by errors in the exercise (2009) |
|
-678.637,63 |
-703.666,96 |
-1.382.304,59 |
|
ADJUSTED ACCOUNT
BALANCE, BEGINNING OF EXERCISE (2010) |
858.004,88 |
30.241.552,53 |
-443.582,99 |
30.655.974,42 |
|
I. Total recognized
income and expenses |
|
|
5.653.338,60 |
5.653.338,60 |
|
II. Operations
with partners or owners |
|
|
|
|
|
III. Other net
worth variations |
|
-443.582,99 |
443.582,99 |
|
|
FINAL ACCOUNT
BALANCE OF EXERCISE (2010) |
858.004,88 |
29.797.969,54 |
5.628.903,14 |
36.284.877,56 |
|
I. Adjustments
by change of criteria in the exercise (2010) |
|
|
|
|
|
II. Adjustments
by errors in the exercise (2010) |
|
|
|
|
|
ADJUSTED ACCOUNT
BALANCE, BEGINNING OF EXERCISE (2011) |
858.004,88 |
29.797.969,54 |
5.628.903,14 |
36.284.877,56 |
|
I. Total
recognized income and expenses |
|
|
6.123.287,46 |
6.123.287,46 |
|
II. Operations
with partners or owners |
|
|
|
|
|
III. Other net
worth variations |
|
5.628.903,15 |
-5.628.903,14 |
0,01 |
|
FINAL ACCOUNT
BALANCE OF EXERCISE (2011) |
858.004,88 |
34.619.886,19 |
6.123.287,46 |
41.601.178,53 |
|
I. Adjustments
by change of criteria in the exercise (2011) |
|
|
|
|
|
II. Adjustments
by errors in the exercise (2011) |
|
|
|
|
|
ADJUSTED ACCOUNT
BALANCE, BEGINNING OF EXERCISE (2012) |
858.004,88 |
34.619.886,19 |
6.123.287,46 |
41.601.178,53 |
|
I. Total
recognized income and expenses |
|
|
-3.369.883,53 |
-3.369.883,53 |
|
II. Operations
with partners or owners |
|
|
|
|
|
III. Other net
worth variations |
|
6.123.287,45 |
-6.123.287,46 |
-0,01 |
|
FINAL ACCOUNT
BALANCE OF EXERCISE (2012) |
858.004,88 |
40.743.173,64 |
-3.369.883,53 |
38.231.294,99 |
CASH FLOW STATUS
Figures given in €
|
|
31/12/2012 (12) |
31/12/2011 (12) |
31/12/2010 (12) |
|
A) CASH FLOW
COMING FROM OPERATING ACTIVITIES |
|
|
|
|
1. exercise
result before taxes |
-4.795.908,44 |
6.177.703,31 |
5.902.306,29 |
|
2. Results
adjustments |
907.862,72 |
-4.961.410,10 |
1.135.562,49 |
|
a) Amortization of fixed assets (+) |
898.246,64 |
859.882,81 |
844.446,96 |
|
b) Value correction for deterioration
(+/-) |
340.509,89 |
5.357,41 |
573.883,79 |
|
e) Results for decline and disposal of
fixed assets (+/-) |
6.703,12 |
|
|
|
g) Financial income (-) |
-482.540,80 |
-227.614,93 |
-44.576,86 |
|
f) Financial expenses (+) |
339.311,42 |
321.033,50 |
252.845,16 |
|
i) Change difference (+/-) |
-194.367,55 |
29.931,11 |
-491.036,56 |
|
k) Other income and expenses (-/+) |
|
-5.950.000,00 |
|
|
3. Changes in
current capital |
2.110.522,05 |
12.179.661,56 |
3.799.953,57 |
|
a) Stocks (+/-) |
4.066.700,14 |
-1.154.087,59 |
2.625.547,49 |
|
b) Debtors and other receivable accounts
(+/-) |
-1.512.459,14 |
19.298.231,38 |
182.436,03 |
|
c) Other current assets (+/-) |
-2.885.089,04 |
-5.117.610,50 |
926.252,56 |
|
d) Creditors and other payable accounts
(+/-) |
4.853.908,56 |
-418.101,56 |
65.717,49 |
|
e) Other current liabilities (+/-) |
-659.629,31 |
-429.042,78 |
|
|
f) Other non-current assets and
liabilities (+/-) |
-1.752.909,16 |
272,61 |
|
|
4. Other cash
flow coming from operating activities |
143.229,37 |
5.772.581,89 |
-208.268,30 |
|
a) Interests payments (-) |
-339.311,43 |
-321.033,50 |
-252.845,16 |
|
b) Dividends collections (+) |
|
5.950.000,00 |
|
|
c) Interests collections (+) |
482.540,80 |
227.614,93 |
44.576,86 |
|
e) Other payments (collections) (-/+) |
|
-83.999,54 |
|
|
5. Cash flow
coming from operating activities (1 + 2 + 3 + 4) |
-1.634.294,30 |
19.168.536,66 |
10.629.554,05 |
|
B) CASH FLOW
COMING FROM INVESTING ACTIVITIES |
|
|
|
|
6. Investment
payments (-) |
-1.052.528,03 |
-23.966.061,30 |
-3.528.624,65 |
|
a) Group and associated companies |
|
-19.066.426,15 |
-3.074.378,40 |
|
b) Intangible assets |
-64.313,07 |
|
-4.000,00 |
|
c) Tangible assets |
-988.214,96 |
-4.899.635,15 |
-450.246,25 |
|
7. Disinvestment
collections (+) |
2.400,00 |
144.100,75 |
846,70 |
|
a) Group and associated companies |
2.400,00 |
144.100,75 |
|
|
e) Other financial assets |
|
|
846,70 |
|
8. Cash Flow in
investment activities (6 + 7) |
-1.050.128,03 |
-23.821.960,55 |
-3.527.777,95 |
|
C) CASH FLOW
COMING FROM FINANCING ACTIVITIES |
|
|
|
|
9. Net worth
instruments collections and payments |
|
|
|
|
10. Financial
liabilities instruments collections and payments |
2.147.682,39 |
4.304.341,49 |
-6.644.924,71 |
|
a) Issue |
2.147.682,39 |
4.454.341,49 |
150.000,00 |
|
2. Debts with bank entities (+) |
1.687.682,39 |
4.454.341,49 |
|
|
3. Debts with group and associated
companies (+) |
460.000,00 |
|
|
|
5. Other debts (+) |
|
|
150.000,00 |
|
b) Return and amortization of |
|
-150.000,00 |
-6.794.924,71 |
|
2. Debts with bank entities (-) |
|
|
-1.826.261,64 |
|
3. Debts with group and associated
companies (-) |
|
|
-4.968.663,07 |
|
5. Other debts (-) |
|
-150.000,00 |
|
|
11. Payments for
dividends and remunerations of other net worth instruments |
|
|
|
|
12. Cash Flow in
financing activities (9 + 10 + 11) |
2.147.682,39 |
4.304.341,49 |
-6.644.924,71 |
|
D) Exchange rate
variations effect |
|
|
|
|
E) NET CASH OR
EQUIVALENTS INCREASE / REDUCTION (5 + 8 + 12 + D) |
-536.739,94 |
-349.082,40 |
456.851,39 |
|
Cash or equivalents
at the beginning of the exercise |
688.424,50 |
1.038.241,28 |
581.389,89 |
|
Cash or
equivalents at the end of the exercise |
151.684,56 |
688.424,50 |
1.038.241,28 |
RATIOS
|
|
31/12/2012 (12) |
CHANGE % |
31/12/2011 (12) |
CHANGE % |
31/12/2010 (12) |
|
BALANCE RATIOS |
|||||
|
Working Capital (€) |
1.517.966,92 |
-83,05 |
8.955.378,42 |
-60,49 |
22.667.165,16 |
|
Working capital ratio |
0,02 |
-83,33 |
0,12 |
-65,71 |
0,35 |
|
Soundness Ratio |
0,92 |
-16,36 |
1,10 |
-55,65 |
2,48 |
|
Average Collection Period (days) |
73 |
29,11 |
57 |
-60,30 |
143 |
|
Average Payment Period (days) |
149 |
26,30 |
118 |
3,81 |
113 |
|
LIQUIDITY RATIOS |
|||||
|
Current Ratio (%) |
104,46 |
-21,26 |
132,66 |
-27,78 |
183,69 |
|
Quick Ratio (%) |
0,44 |
-82,07 |
2,51 |
-34,46 |
3,83 |
|
DEBT RATIOS |
|||||
|
Borrowing percentage (%) |
17,45 |
9,27 |
15,97 |
31,66 |
12,13 |
|
External Financing Average Cost |
0,02 |
0,00 |
0,03 |
0,00 |
0,03 |
|
Debt Service Coverage |
-8,22 |
-1.425,81 |
0,62 |
-16,22 |
0,74 |
|
Interest Coverage |
-14,36 |
-1.789,41 |
0,85 |
-90,21 |
8,68 |
|
GENERAL AND
ACTIVITIES RATIOS |
|||||
|
Auto financing generated by sales (%) |
-2,56 |
-109,80 |
26,11 |
90,72 |
13,69 |
|
Auto financing generated by Assets (%) |
-2,12 |
-108,29 |
25,58 |
54,94 |
16,51 |
|
Breakdown Point |
0,93 |
-7,00 |
1,00 |
-2,91 |
1,03 |
|
Average Sales Volume per Employee |
1.637.901,22 |
-8,70 |
1.793.904,31 |
-1,86 |
1.827.819,09 |
|
Average Cost per Employee |
72.801,16 |
3,12 |
70.600,61 |
0,72 |
70.095,43 |
|
Assets Turnover |
0,83 |
-15,31 |
0,98 |
-19,01 |
1,21 |
|
Inventory Turnover (days) |
72 |
-22,09 |
93 |
12,66 |
82 |
|
RESULTS RATIOS |
|||||
|
Return on Assets (ROA) (%) |
-6,33 |
-1.858,33 |
0,36 |
-89,44 |
3,41 |
|
Operating Profitability (%) |
-5,18 |
-442,38 |
1,51 |
-68,01 |
4,72 |
|
Return on Equity (ROE) (%) |
-12,54 |
-186,07 |
14,57 |
-10,39 |
16,26 |
SECTORIAL ANALYSIS
Balance Sheet and Financial
Balance
Figures expressed in %
|
|
COMPANY (2012) |
SECTOR |
DIFFERENCE |
|
BALANCE SHEET
ANALYSIS: % on the total assets |
|
|
|
|
ASSETS |
|||
|
A) NON CURRENT ASSETS |
53,75 |
56,72 |
-2,97 |
|
A) CURRENT ASSETS |
46,25 |
43,28 |
2,97 |
|
LIABILITIES |
|||
|
A) NET WORTH |
49,69 |
47,47 |
2,22 |
|
B) NON CURRENT LIABILITIES |
6,03 |
11,98 |
-5,95 |
|
C) CURRENT LIABILITIES |
44,28 |
40,55 |
3,73 |
|
|
|
|
|
Results Analytical
Account
Figures given in %
|
|
COMPANY (2012) |
SECTOR |
DIFFERENCE |
|
Net Turnover |
99,95 |
97,55 |
2,40 |
|
Other operating income |
0,05 |
2,45 |
-2,40 |
|
OPERATING INCOME |
100,00 |
100,00 |
0,00 |
|
Supplies |
-92,53 |
-63,30 |
-29,23 |
|
Variation in stocks of finished goods and
work in progress |
|
-0,04 |
|
|
GROSS MARGIN |
7,47 |
36,65 |
-29,18 |
|
Other operating costs |
-9,28 |
-14,45 |
5,17 |
|
Labour cost |
-4,44 |
-5,57 |
1,13 |
|
GROSS OPERATING
RESULT |
-6,25 |
16,63 |
-22,88 |
|
Amortization of fixed assets |
-1,41 |
-1,38 |
-0,03 |
|
Deterioration and result for fixed assets
disposal |
-0,01 |
-0,04 |
0,03 |
|
Other expenses / income |
|
0,04 |
|
|
NET OPERATING
RESULT |
-7,63 |
15,25 |
-22,88 |
|
Financial result |
0,12 |
1,34 |
-1,22 |
|
RESULT BEFORE
TAX |
-7,50 |
16,59 |
-24,09 |
|
Taxes on profits |
2,23 |
-2,06 |
4,29 |
|
RESULT COMING
FROM CONTINUED OPERATIONS |
-5,27 |
14,53 |
-19,80 |
|
Exercise result coming from discontinued
operations net of taxes |
|
0,00 |
|
|
NET RESULT |
-5,27 |
14,53 |
-19,80 |
|
Amortization of fixed assets |
-1,41 |
-1,38 |
-0,03 |
|
Deterioration and provisions variation |
-0,13 |
-0,17 |
0,04 |
|
|
-3,74 |
16,08 |
-19,82 |
Main Ratios
Figures given in €
|
|
COMPANY (2012) |
PTILE25 |
PTILE50 |
PTILE75 |
|
BALANCE RATIOS |
|
|
|
|
|
Working Capital (€) |
1.517.966,92 |
-121.048,00 |
11.773.159,57 |
27.187.442,75 |
|
Working capital ratio |
0,02 |
0,01 |
0,20 |
0,33 |
|
Soundness Ratio |
0,92 |
0,85 |
1,50 |
3,03 |
|
Average Collection Period (days) |
73 |
34 |
62 |
100 |
|
Average Payment Period (days) |
149 |
59 |
111 |
175 |
|
LIQUIDITY RATIOS |
|
|
|
|
|
Current Ratio (%) |
104,46 |
100,81 |
145,27 |
189,22 |
|
Quick Ratio (%) |
0,44 |
2,48 |
7,34 |
50,68 |
|
DEBT RATIOS |
|
|
|
|
|
Borrowing percentage (%) |
17,45 |
6,15 |
20,90 |
30,01 |
|
External Financing Average Cost |
0,02 |
0,01 |
0,02 |
0,06 |
|
Debt Service Coverage |
-8,22 |
0,07 |
1,72 |
5,11 |
|
Interest Coverage |
-14,36 |
0,58 |
11,32 |
150,51 |
|
GENERAL AND ACTIVITIES
RATIOS |
|
|
|
|
|
Auto financing generated by sales (%) |
-2,56 |
0,84 |
4,29 |
10,60 |
|
Auto financing generated by Assets (%) |
-2,12 |
0,98 |
7,94 |
15,34 |
|
Breakdown Point |
0,93 |
1,00 |
1,04 |
1,14 |
|
Average Sales Volume per Employee |
1.637.901,22 |
174.929,94 |
412.261,85 |
757.963,74 |
|
Average Cost per Employee |
72.801,16 |
17.807,07 |
29.493,26 |
36.605,13 |
|
Assets Turnover |
0,83 |
1,04 |
1,48 |
2,00 |
|
Inventory Turnover (days) |
72 |
39 |
66 |
130 |
|
RESULTS RATIOS |
|
|
|
|
|
Return on Assets (ROA) (%) |
-6,33 |
-0,07 |
7,42 |
15,82 |
|
Operating Profitability (%) |
-5,18 |
1,19 |
9,63 |
17,51 |
|
Return on Equity (ROE) (%) |
-12,54 |
1,36 |
15,41 |
42,25 |
ADDITIONAL INFORMATION
Consulted Sources
Central Mercantile
Register
Mercantile
Registrars
Chamber of
Commerce / Camerdata
Tax Administration
/ VIES Consultation
Tax Administration
/ Consultation by NIF
BOP
FOREIGN EXCHANGE RATES
|
Currency |
Unit
|
Indian Rupees |
|
US Dollar |
1 |
Rs.61.49 |
|
|
1 |
Rs.98.71 |
|
Euro |
1 |
Rs.84.49 |
INFORMATION DETAILS
|
Report Prepared
by : |
PDT |
RATING EXPLANATIONS
|
RATING |
STATUS |
PROPOSED CREDIT LINE |
|
|
>86 |
Aaa |
Possesses an extremely
sound financial base with the strongest capability for timely payment of
interest and principal sums |
Unlimited |
|
71-85 |
Aa |
Possesses
adequate working capital. No caution needed for credit transaction. It has
above average (strong) capability for payment of interest and principal sums |
Large |
|
56-70 |
A |
Financial &
operational base are regarded healthy. General unfavourable factors will not
cause fatal effect. Satisfactory capability for payment of interest and
principal sums |
Fairly Large |
|
41-55 |
Ba |
Overall
operation is considered normal. Capable to meet normal commitments. |
Satisfactory |
|
26-40 |
B |
Capability to
overcome financial difficulties seems comparatively below average. |
Small |
|
11-25 |
Ca |
Adverse factors
are apparent. Repayment of interest and principal sums in default or expected
to be in default upon maturity |
Limited with full security |
|
<10 |
C |
Absolute credit
risk exists. Caution needed to be exercised |
Credit not recommended |
|
-- |
NB |
New
Business |
-- |
This score serves as a reference to assess SC’s credit risk
and to set the amount of credit to be extended. It is calculated from a composite
of weighted scores obtained from each of the major sections of this report. The
assessed factors and their relative weights (as indicated through %) are as
follows:
Financial
condition (40%) Ownership
background (20%) Payment
record (10%)
Credit history
(10%) Market trend
(10%) Operational
size (10%)
This report is issued at your request without any
risk and responsibility on the part of MIRA INFORM PRIVATE LIMITED (MIPL)
or its officials.