MIRA INFORM REPORT
|
Report Date : |
13.09.2013 |
IDENTIFICATION DETAILS
|
Name : |
LADDA CO., LTD. |
|
|
|
|
Registered Office : |
77/6 Moo 1, Changpuek, Muang, Chiangmai 50000 |
|
|
|
|
Country : |
Thailand |
|
|
|
|
Financials (as on) : |
31.12.2012 |
|
|
|
|
Date of Incorporation : |
14.06.1966 |
|
|
|
|
Com. Reg. No.: |
0505509000045 |
|
|
|
|
Legal Form : |
Private Limited Company |
|
|
|
|
Line of Business : |
Manufacturing, importing and distributing of agrochemical. |
|
|
|
|
No. of Employees : |
450 |
RATING & COMMENTS
|
MIRA’s Rating : |
Ba |
|
RATING |
STATUS |
PROPOSED CREDIT LINE |
|
|
41-55 |
Ba |
Overall operation is considered normal. Capable to meet normal
commitments. |
Satisfactory |
|
Status : |
Satisfactory |
|
Payment Behaviour : |
No complaints |
|
Litigation : |
Clear |
NOTES :
Any query related to this report can be made
on e-mail: infodept@mirainform.com
while quoting report number, name and date.
ECGC Country Risk Classification List – March 31st, 2013
|
Country Name |
Previous Rating (31.12.2012) |
Current Rating (31.03.2013) |
|
Thailand |
B1 |
B1 |
|
Risk Category |
ECGC
Classification |
|
Insignificant |
A1 |
|
Low |
A2 |
|
Moderate |
B1 |
|
High |
B2 |
|
Very High |
C1 |
|
Restricted |
C2 |
|
Off-credit |
D |
THAILAND - ECONOMIC OVERVIEW
With a well-developed infrastructure, a free-enterprise
economy, generally pro-investment policies, and strong export industries,
Thailand achieved steady growth due largely to industrial and agriculture
exports - mostly electronics, agricultural commodities, automobiles and parts,
and processed foods. Thailand is trying to maintain growth by encouraging
domestic consumption and public investment to offset weak exports in 2012.
Unemployment, at less than 1% of the labor force, stands as one of the lowest levels
in the world, which puts upward pressure on wages in some industries. Thailand
also attracts nearly 2.5 million migrant workers from neighboring countries.
The Thai government is implementing a nation-wide 300 baht ($10) per day
minimum wage policy and deploying new tax reforms designed to lower rates on
middle-income earners. The Thai economy has weathered internal and external
economic shocks in recent years. The global economic crisis severely cut
Thailand's exports, with most sectors experiencing double-digit drops. In 2009,
the economy contracted 2.3%. However, in 2010, Thailand's economy expanded
7.8%, its fastest pace since 1995, as exports rebounded. In late 2011 growth
was interrupted by historic flooding in the industrial areas in Bangkok and its
five surrounding provinces, crippling the manufacturing sector. Industry
recovered from the second quarter of 2012 onward with GDP growth at 5.5% in
2012. The government has approved flood mitigation projects worth $11.7
billion, which were started in 2012, to prevent similar economic damage, and an
additional $75 billion for infrastructure over the next seven years with a plan
to start in 2013
Source
: CIA
Company name and address
SUMMARY
BUSINESS ADDRESS : 99/220 TESABANSONGKROH ROAD, LADYAO,
JATUJAK, BANGKOK 10900, THAILAND
TELEPHONE : [66] 2954-3120-6
FAX : [66] 2954-3128, 2580-2178
E-MAIL ADDRESS : info@ladda.com
REGISTRATION ADDRESS : 77/6 MOO 1, CHANGPUEK, MUANG,
CHIANGMAI 50000
ESTABLISHED : 1966
REGISTRATION NO. : 0505509000045 [Former: CHOR MOR. 86]
TAX ID NO. : 3501001064
CAPITAL REGISTERED : BHT. 110,000,000
CAPITAL PAID-UP : BHT. 110,000,000
FISCAL YEAR CLOSING DATE : DECEMBER 31
LEGAL STATUS : PRIVATE LIMITED COMPANY
EXECUTIVE : MR. SERI CHAROENSUK, THAI
PRESIDENT
NO. OF STAFF : 450
LINES OF BUSINESS : AGROCHEMICALS
MANUFACTURER, IMPORTER AND DISTRIBUTOR
corporate PROFILE
OPERATING TREND : STABLE
PRESENT SITUATION : OPERATING NORMALLY
REPUTATION : GOOD WITH NORMAL BUSINESS ENGAGEMENT
MANAGEMENT STANDARD : MANAGEMENT WITH FAIR PERFORMANCE
HISTORY
The subject was established on June 14, 1966 as a private limited company under the name style LADDA CO., LTD., by Thai groups, with the business objective to manufacture, import and distribute agrochemicals to domestic market. It currently employs approximately 450 staff.
The subject’s registered address is 77/6 Moo 1, T. Changpuek, A. Muang, Chiangmai 50000, while the operation address is located at 99/220 Tesabansongkroh Rd., Ladyao, Jatujak, Bangkok 10900.
THE BOARD OF DIRECTOR
|
Name |
|
Nationality |
Age |
|
|
|
|
|
|
Mr. Seri Charoensuk |
|
Thai |
55 |
|
Mr. Methavee Maneechote |
[x] |
Thai |
33 |
|
Mrs. Dalinporn Patratanapong |
[x] |
Thai |
34 |
|
Ms. Patcharaporn Chiarwutthi |
[x] |
Thai |
34 |
|
Ms. Ratchadaporn Nartajara |
|
Thai |
37 |
|
Ms. Sukonthip Siridej |
|
Thai |
40 |
|
Mrs. Supawan Srilaemthong |
|
Thai |
63 |
AUTHORIZED PERSON
Anyone of the mentioned directors [x] can sign or any two of the rest directors can jointly sign on behalf of the subject with company’s affixed.
MANAGEMENT
Mr. Seri Charoensuk is the President.
He is Thai nationality with the age of 55 years old.
Mr. Methavee Maneechote is the Managing Director.
He is Thai nationality with the age of 33 years old.
Ms. Patcharaporn Chiarwutthi is the Deputy Managing Director.
She is Thai nationality with the age of 34 years old.
Mr. Suchin Chantarasa-ard is the Assistant Managing Director [Development].
He is Thai nationality.
Ms. Thanya Thungvachirakul is the Human Resources Manager.
She is Thai nationality.
Mr. Wattanaphol Chiarwutthi is the Marketing Manager.
He is Thai nationality.
BUSINESS OPERATIONS
The subject is engaged in manufacturing, importing and distributing agrochemical such as insecticides, herbicides, fungicides, fertilizer, plant growth regulator, plant nutrients, molluscicides, and etc.
BRAND NAMES
“BIOK”, “RHODIA”, “NUFARM”, “SANONDA”, “SINON”, “WOCKHARDT”
and etc.
PURCHASE
Raw materials are purchased from local suppliers and agents.
IMPORT
The products are imported from Republic of China, Mexico, Denmark, Taiwan,
United Kingdom, India, Netherlands, Malaysia, Australia, Belgium, Israel, Ireland and etc.
MAJOR SUPPLIERS
Simonis B.V. : Netherlands
United Phosphorus Ltd. : India
Keery Algde : Ireland
Makhteshim AGEN Ltd. : Israel
SALES
100% of the products is sold locally by wholesale to dealers and end-users.
MAJOR CUSTOMERS
Pat Sranis Agriculture Shop
Taesengheng Shop
Sanhe Wangwa Shop
RELATED AND
AFFILIATED COMPANIES
Agro Industry Development Co., Ltd.
Business Type : Importer and distributor of agrochemicals
Bessaw Engineers [Thailand] Co., Ltd.
Business Type : Importer and distributor of agrochemicals
Dynamic Seeds Co., Ltd.
Business Type : Importer and distributor of agrochemicals and seeds.
Ladda Intertrade Co., Ltd.
Business Type : Importer and distributor of fertilizer
LITIGATION
Bankruptcy
and Receivership
There are no litigation on bankruptcy and receivership cases filed against the subject found at Legal Execution Department for the past five years.
Others
There are no legal suits filed against the subject according for the past two years.
CREDIT
Sales are by cash or on the credits term of 30-60 days.
Local bills are paid by cash or on the credits term of 30-60 days.
Imports are by L/C at sight or T/T.
BANKING
Bangkok Bank Public Co., Ltd.
[Head Office : 333 Silom Rd., Silom, Bangrak, Bangkok]
The Siam Commercial Bank Public Co., Ltd.
[Head Office : 9 Ratchadapisek Rd., Ladyao, Jatujak, Bangkok]
EMPLOYMENT
The subject employs approximately 450 office staff and workers.
LOCATION DETAILS
The premise is owned for administrative office at the heading address. Premise is located in commercial/residential area.
Factory and warehouse are located at 151 Moo 6, Watsamkwaipuek Rd., Muang, Nakornpathom 73000. Tel. : [66] 34 305-282.
Other warehouse is located at 77/6 Moo 1, Changpuek, Muang, Chiangmai 50000.
COMMENT
Agricultural
industry has grown slowly
since the previous
year. It also
had an effect
to agrochemical industry
due to farm products
were still the major
industry for both
domestic consumption and exports. Subject’s
business performance remains
moderate, even though
consumption in 2013
has slightly dropped
compared year to date
from the previous year’s level.
FINANCIAL INFORMATION
The capital was registered at Bht. 110,000,000 divided into 110,000 shares of Bht. 1,000 each with fully paid.
THE SHAREHOLDERS LISTED WERE : [as at April 30, 2013]
|
NAME |
HOLDING |
% |
|
|
|
|
|
Ladda Group Holdings Co., Ltd. Nationality: Thai Address : 99/220 Tesabansongkroh Rd., Ladyao, Jatujak, Bangkok |
107,690 |
97.90 |
|
Ms. Wanida Angsupun Nationality: Thai Address : 7/30 Moo 2, Bangkhen, Muang, Nonthaburi |
1,155 |
1.05 |
|
Mr. Pichai Maneechote Nationality: Thai Address : 99/220 Tesabansongkroh Rd., Ladyao, Jatujak, Bangkok |
1,155 |
1.05 |
Total Shareholders : 3
Share Structure [as at April 30, 2013]
|
Nationality |
Shareholders |
No. of Share |
% Shares |
|
|
|
|
|
|
Thai |
3 |
110,000 |
100.00 |
|
Foreign |
- |
- |
- |
|
Total |
3 |
110,000 |
100.00 |
NAME OF AUDITOR & CERTIFIED PUBLIC ACCOUNTANT NO. :
Mr. Vichit Luechaiprasit No. 3563
BALANCE SHEET [BAHT]
The latest financial figures published as at December 31, 2012, 2011 & 2010 were:
ASSETS
|
Current Assets |
2012 |
2011 |
2010 |
|
|
|
|
|
|
Cash and Cash Equivalents |
4,328,116.72 |
113,117,962.58 |
46,179,002.79 |
|
Trade Accounts & Other Receivable |
180,245,790.49 |
46,090,070.46 |
179,373,582.56 |
|
Inventories |
251,727,707.60 |
81,614,526.30 |
200,245,938.10 |
|
Other Current Assets |
356,270.33 |
2,017,685.28 |
557,640.19 |
|
|
|
|
|
|
Total Current Assets |
436,657,885.14 |
242,840,244.62 |
426,356,163.64 |
|
|
|
|
|
|
Fixed Assets |
63,868,368.78 |
42,139,072.26 |
44,444,589.16 |
|
Intangible Assets |
2,994,024.10 |
3,363,688.07 |
3,780,924.91 |
|
Other Non - current Assets |
143,569.00 |
143,569.00 |
143,569.00 |
|
Total Assets |
503,663,847.02 |
288,486,573.95 |
474,725,246.71 |
LIABILITIES & SHAREHOLDERS’ EQUITY [BAHT]
|
Current Liabilities |
2012 |
2011 |
2010 |
|
|
|
|
|
|
Bank Overdraft & Short-term Loan from Financial Institutions |
172,532,258.87 |
32,484,800.38 |
141,896,596.10 |
|
Trade Accounts & Other Payable |
60,484,570.89 |
18,396,476.62 |
63,048,326.11 |
|
Current Portion of Financial Lease Contract Liabilities |
733,884.00 |
- |
- |
|
Accrued Income Tax |
8,007,021.78 |
27,933,163.21 |
12,167,387.78 |
|
Other Current Liabilities |
2,820,350.36 |
1,173,793.55 |
507,839.68 |
|
|
|
|
|
|
Total Current Liabilities |
244,578,085.90 |
79,988,233.76 |
217,620,149.67 |
|
|
|
|
|
|
Financial Lease Contract Liabilities, Net |
1,094,712.00 |
- |
- |
|
Total Liabilities |
245,672,797.90 |
79,988,233.76 |
217,620,149.67 |
|
|
|
|
|
|
Shareholders' Equity |
|
|
|
|
|
|
|
|
|
Share capital : Baht 1,000 par value authorized, issued and fully paid share capital 110,000 shares |
110,000,000.00 |
110,000,000.00 |
110,000,000.00 |
|
|
|
|
|
|
Capital Paid |
110,000,000.00 |
110,000,000.00 |
110,000,000.00 |
|
Retained Earnings Appropriated Statutory Reserve |
11,000,000.00 |
11,000,000.00 |
11,000,000.00 |
|
Unappropriated |
136,991,049.12 |
87,498,340.19 |
136,105,097.04 |
|
Total Shareholders' Equity |
257,991,049.12 |
208,498,340.19 |
257,105,097.04 |
|
Total Liabilities & Shareholders' Equity |
503,663,847.02 |
288,486,573.95 |
474,725,246.71 |
PROFIT & LOSS
ACCOUNT
|
Revenue |
2012 |
2011 |
2010 |
|
|
|
|
|
|
Sales Income |
668,285,189.98 |
895,244,614.64 |
950,564,167.65 |
|
Other Income |
|
|
|
|
Revenue from Services Product Registration |
5,549,500.00 |
1,739,100.00 |
- |
|
Gain on Exchange Rate |
2,383,119.89 |
- |
2,357,358.32 |
|
Rental Income |
2,850,000.00 |
2,670,000.00 |
1,980,000.00 |
|
Others |
11,444,655.22 |
3,142,004.57 |
3,715,194.92 |
|
Total Revenues |
690,512,465.09 |
902,795,719.21 |
958,616,720.89 |
|
Expenses |
|
|
|
|
|
|
|
|
|
Cost of Goods Sold |
529,148,372.94 |
695,308,140.86 |
792,434,101.69 |
|
Selling Expenses |
24,215,903.18 |
21,507,264.86 |
34,203,036.81 |
|
Administrative Expenses |
66,032,584.21 |
64,269,316.65 |
65,777,672.83 |
|
Total Expenses |
619,396,860.33 |
781,084,722.37 |
892,414,811.33 |
|
|
|
|
|
|
Profit / [Loss] before Financial Cost & Income Tax |
71,115,604.76 |
121,710,996.84 |
66,201,909.56 |
|
Financial Costs |
[6,852,559.47] |
[1,271,109.45] |
[3,821,391.32] |
|
Profit / [Loss] before Income Tax |
64,263,045.29 |
120,439,887.39 |
62,380,518.24 |
|
Income Tax |
[14,770,336.36] |
[37,046,644.24] |
[19,307,198.70] |
|
|
|
|
|
|
Net Profit / [Loss] |
49,492,708.93 |
83,393,243.15 |
43,073,319.54 |
FINANCIAL ANALYSIS
|
ITEM |
UNIT |
2012 |
2011 |
2010 |
|
|
|
|
|
|
|
LIQUIDITY RATIO |
|
|
|
|
|
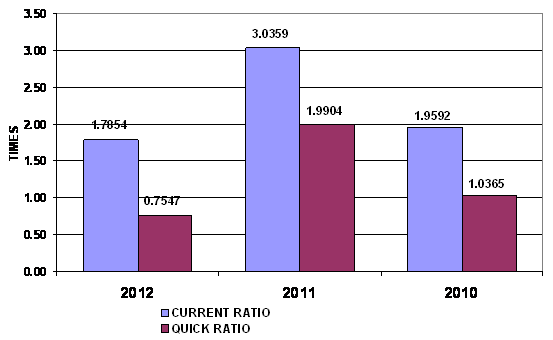
CURRENT RATIO |
TIMES |
1.79 |
3.04 |
1.96 |
|
QUICK RATIO |
TIMES |
0.75 |
1.99 |
1.04 |
|
|
|
|
|
|
|
ACTIVITY RATIO |
|
|
|
|
|
FIXED ASSETS TURNOVER |
TIMES |
10.46 |
21.25 |
21.39 |
|
TOTAL ASSETS TURNOVER |
TIMES |
1.33 |
3.10 |
2.00 |
|
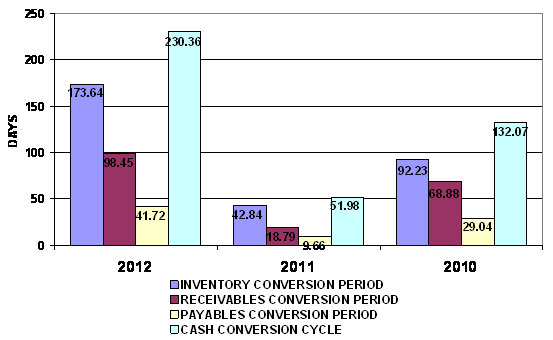
INVENTORY CONVERSION PERIOD |
DAYS |
173.64 |
42.84 |
92.23 |
|
INVENTORY TURNOVER |
TIMES |
2.10 |
8.52 |
3.96 |
|
RECEIVABLES CONVERSION PERIOD |
DAYS |
98.45 |
18.79 |
68.88 |
|
RECEIVABLES TURNOVER |
TIMES |
3.71 |
19.42 |
5.30 |
|
PAYABLES CONVERSION PERIOD |
DAYS |
41.72 |
9.66 |
29.04 |
|
CASH CONVERSION CYCLE |
DAYS |
230.36 |
51.98 |
132.07 |
|
|
|
|
|
|
|
PROFITABILITY RATIO |
|
|
|
|
|
COST OF GOODS SOLD |
% |
79.18 |
77.67 |
83.36 |
|
SELLING & ADMINISTRATION |
% |
13.50 |
9.58 |
10.52 |
|
INTEREST |
% |
1.03 |
0.14 |
0.40 |
|
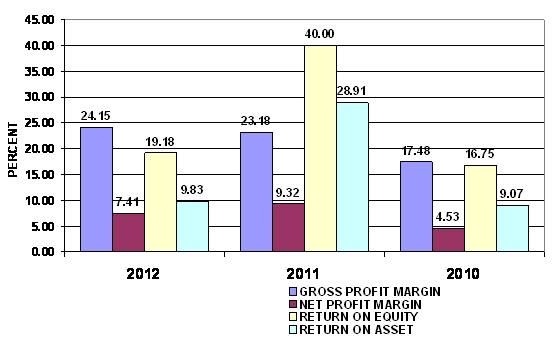
GROSS PROFIT MARGIN |
% |
24.15 |
23.18 |
17.48 |
|
NET PROFIT MARGIN BEFORE EX. ITEM |
% |
10.64 |
13.60 |
6.96 |
|
NET PROFIT MARGIN |
% |
7.41 |
9.32 |
4.53 |
|
RETURN ON EQUITY |
% |
19.18 |
40.00 |
16.75 |
|
RETURN ON ASSET |
% |
9.83 |
28.91 |
9.07 |
|
EARNING PER SHARE |
BAHT |
449.93 |
758.12 |
391.58 |
|
|
|
|
|
|
|
LEVERAGE RATIO |
|
|
|
|
|
DEBT RATIO |
TIMES |
0.49 |
0.28 |
0.46 |
|
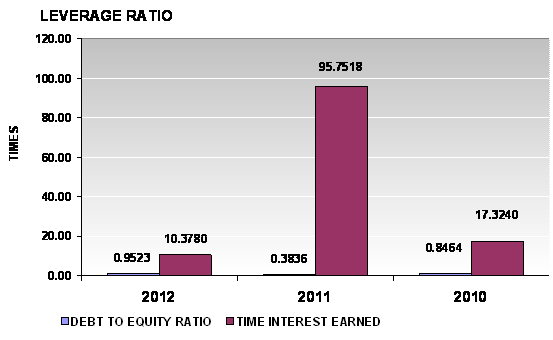
DEBT TO EQUITY RATIO |
TIMES |
0.95 |
0.38 |
0.85 |
|
TIME INTEREST EARNED |
TIMES |
10.38 |
95.75 |
17.32 |
|
|
|
|
|
|
|
ANNUAL GROWTH |
|
|
|
|
|
SALES GROWTH |
% |
(25.35) |
(5.82) |
|
|
OPERATING PROFIT |
% |
(41.57) |
83.85 |
|
|
NET PROFIT |
% |
(40.65) |
93.61 |
|
|
FIXED ASSETS |
% |
51.57 |
(5.19) |
|
|
TOTAL ASSETS |
% |
74.59 |
(39.23) |
|
ANNUAL GROWTH :
ACCEPTABLE
An annual sales growth is -25.35%. Turnover has decreased from THB 895,244,614.64 in 2011 to THB 668,285,189.98 in 2012. While net profit has decreased from THB 83,393,243.15 in 2011 to THB 49,492,708.93 in 2012. And total assets has increased from THB 288,486,573.95 in 2011 to THB 503,663,847.02 in 2012.
PROFITABILITY :
ACCEPTABLE
PROFITABILITY
RATIO
|
Gross Profit Margin |
24.15 |
Deteriorated |
Industrial Average |
120.04 |
|
Net Profit Margin |
7.41 |
Satisfactory |
Industrial Average |
9.10 |
|
Return on Assets |
9.83 |
Acceptable |
Industrial Average |
16.01 |
|
Return on Equity |
19.18 |
Satisfactory |
Industrial Average |
24.13 |
Gross Profit Margin used to assess a firm's financial health by revealing the proportion of money left over from revenues after accounting for the cost of goods sold. Gross profit margin serves as the source for paying additional expenses and future savings. The company's figure is 24.15%. When compared with the industry average, the ratio of the company was lower. This indicated that company may have problems with control over its costs.
Net Profit Margin is the indicator of the company's efficiency in that net profit takes into consideration all expenses of the company. A low profit margin indicates a low margin of safety, higher risk that a decline in sales will erase profits and result in a net loss. The company's figure is 7.41%. When compared with the industry average, the ratio of the company was lower.
Return on Assets measures how efficiently profits are being generated from the assets employed in the business when compared with the ratios of firms in a similar business. A low ratio in comparison with industry averages indicates an inefficient use of business assets. When compared with the industry average, it was lower, the company's figure is 9.83%.
Return on Equity indicates how profitable a company is by comparing its net income to its average shareholders' equity, ROE measures how much the shareholders earned for their investment in the company. When compared with the industry average, it was lower, the company's figure is 19.18%.
Trend of the average competitors in the same industry for last 5 years
Return on Assets Uptrend
Return on Equity Uptrend
LIQUIDITY :
ACCEPTABLE
LIQUIDITY RATIO
|
Current Ratio |
1.79 |
Impressive |
Industrial Average |
(11.73) |
|
Quick Ratio |
0.75 |
|
|
|
|
Cash Conversion Cycle |
230.36 |
|
|
|
The Current Ratio is to ascertain whether a company's short-term assets are readily available to pay off its short-term liabilities. The company's figure is 1.79 times in 2012, decreased from 3.04 times, then it is generally considered to have good short-term financial strength. When compared with the industry average, the ratio of the company was higher, indicated that company was an efficient operator in a dominant position within its industry.
The Quick Ratio is a liquidity indicator that further refines the current ratio by measuring the amount of the most liquid current assets there are to cover current liabilities. The company's figure is 0.75 times in 2012, decrease from 1.99 times, then the company has not enough current assets that presumably can be quickly converted to cash for pay financial obligations.
The Cash Conversion Cycle measures the number of days a company's cash is tied up in the production and sales process of its operations and the benefit from payment terms from its creditors. It meant the company could survive when no cash inflow was received from sale for 231 days.
Trend of the average competitors in the same industry for last 5 years
Current Ratio Downtrend
LEVERAGE :
SATISFACTORY

LEVERAGE RATIO
|
Debt Ratio |
0.49 |
Acceptable |
Industrial Average |
0.19 |
|
Debt to Equity Ratio |
0.95 |
Impressive |
Industrial Average |
0.25 |
|
Times Interest Earned |
10.38 |
Satisfactory |
Industrial Average |
10.87 |
Debt to Equity Ratio a measurement of how much suppliers, lenders, creditors and obligors have committed to the company versus what the shareholders have committed. A lower the percentage means that the company is using less leverage and has a stronger equity position.
Times Interest Earned measuring a company's ability to meet its debt obligations. Ratio is 10.38 higher than 1, so the company can pay interest expenses on outstanding debt.
Debt Ratio shows the proportion of a company's assets which are financed through debt. The company's figure is 0.49 less than 0.5, most of the company's assets are financed through equity.
Trend of the average competitors in the same industry for last 5 years
Debt Ratio Downtrend
Times Interest Earned Uptrend
ACTIVITY : IMPRESSIVE
ACTIVITY RATIO
|
Fixed Assets Turnover |
10.46 |
Impressive |
Industrial Average |
- |
|
Total Assets Turnover |
1.33 |
Acceptable |
Industrial Average |
2.30 |
|
Inventory Conversion Period |
173.64 |
|
|
|
|
Inventory Turnover |
2.10 |
Impressive |
Industrial Average |
0.96 |
|
Receivables Conversion Period |
98.45 |
|
|
|
|
Receivables Turnover |
3.71 |
Impressive |
Industrial Average |
2.70 |
|
Payables Conversion Period |
41.72 |
|
|
|
The company's Account Receivable Ratio is calculated as 3.71 and 19.42 in 2012 and 2011 respectively. This ratio measures the efficiency of the company in managing its trade debtors to generate revenue. A lower ratio may indicate over extension and collection problems. Conversely, a higher ratio may indicate an overtly stringent policy. In this case, the company's A/R ratio in 2012 decreased from 2011. This would suggest the company had deteriorated in the management of its debt collections.
Inventory Turnover in Days Ratio indicates the liquidity of inventory. It estimates the number of days that it will take to sell the current inventory. Inventory is particularly sensitive to change in business activities. The inventory turnover in days has increased from 43 days at the end of 2011 to 174 days at the end of 2012. This represents a negative trend. And Inventory turnover has decreased from 8.52 times in year 2011 to 2.1 times in year 2012.
The company's Total Asset Turnover is calculated as 1.33 times and 3.1 times in 2012 and 2011 respectively. This ratio is determined by dividing total assets into total sales turnover. The ratio measures the activity of the assets and the ability of the firm to generate sales through the use of the assets.
Trend of the average competitors in the same industry for last 5 years
Fixed Assets Turnover Downtrend
Total Assets Turnover Uptrend
Inventory Turnover Downtrend
Receivables Turnover Downtrend
FOREIGN EXCHANGE RATES
|
Currency |
Unit
|
Indian Rupees |
|
US Dollar |
1 |
Rs.63.67 |
|
|
1 |
Rs.100.71 |
|
Euro |
1 |
Rs.84.72 |
INFORMATION DETAILS
|
Report
Prepared by : |
NIS |
RATING EXPLANATIONS
|
RATING |
STATUS |
PROPOSED CREDIT LINE |
|
|
>86 |
Aaa |
Possesses an extremely sound financial base with the strongest
capability for timely payment of interest and principal sums |
Unlimited |
|
71-85 |
Aa |
Possesses adequate working capital. No caution needed for credit
transaction. It has above average (strong) capability for payment of interest
and principal sums |
Large |
|
56-70 |
A |
Financial & operational base are regarded healthy. General
unfavourable factors will not cause fatal effect. Satisfactory capability for
payment of interest and principal sums |
Fairly Large |
|
41-55 |
Ba |
Overall operation is considered normal. Capable to meet normal
commitments. |
Satisfactory |
|
26-40 |
B |
Capability to overcome financial difficulties seems comparatively
below average. |
Small |
|
11-25 |
Ca |
Adverse factors are apparent. Repayment of interest and principal sums
in default or expected to be in default upon maturity |
Limited with
full security |
|
<10 |
C |
Absolute credit risk exists. Caution needed to be exercised |
Credit not
recommended |
|
-- |
NB |
New Business |
-- |
This score serves as a reference to assess
SC’s credit risk and to set the amount of credit to be extended. It is
calculated from a composite of weighted scores obtained from each of the major
sections of this report. The assessed factors and their relative weights (as
indicated through %) are as follows:
Financial
condition (40%) Ownership
background (20%) Payment
record (10%)
Credit history
(10%) Market trend (10%) Operational size
(10%)
This report is issued at your request without any
risk and responsibility on the part of MIRA INFORM PRIVATE LIMITED (MIPL)
or its officials.