MIRA INFORM REPORT
|
Report Date : |
01.04.2014 |
IDENTIFICATION DETAILS
|
Name : |
THERMAX LIMITED |
|
|
|
|
Registered
Office : |
D-13, MIDC Industrial
Area, R.D. Aga Road, Chinchwad, Pune – 411019, Maharashtra |
|
|
|
|
Country : |
|
|
|
|
|
Financials (as
on) : |
31.03.2013 |
|
|
|
|
Date of
Incorporation : |
30.06.1980 |
|
|
|
|
Com. Reg. No.: |
11-022787 |
|
|
|
|
Capital Investment
/ Paid-up Capital : |
Rs.238.300 Millions |
|
|
|
|
CIN No.: [Company Identification
No.] |
L29299PN1980PLC022787 |
|
|
|
|
TAN No.: [Tax Deduction &
Collection Account No.] |
PNET00953B PNET00081E PNET03854E PNET00017D |
|
|
|
|
PAN No.: [Permanent Account No.] |
AAACT6284E AAACT3910D |
|
|
|
|
Legal Form : |
A Public Limited Liability Company. The Company’s Shares are Listed on
the Stock Exchange. |
|
|
|
|
Line of Business
: |
Manufacturer of Solar Power Generation, Water Treatment Plant,
Industrial Boiler, Air Pollution Control System. |
|
|
|
|
No. of Employees
: |
4100 [Approximately] |
RATING & COMMENTS
|
MIRA’s Rating : |
A (65) |
|
RATING |
STATUS |
PROPOSED CREDIT LINE |
|
|
56-70 |
A |
Financial & operational base are regarded healthy. General
unfavourable factors will not cause fatal effect. Satisfactory capability for
payment of interest and principal sums |
Fairly Large |
|
Status : |
Good |
|
|
|
|
Payment Behaviour : |
Regular |
|
|
|
|
Litigation : |
Exist |
|
|
|
|
Comments : |
Subject is a well-established company having fine track record. There appears dip in profitability of the company during the financial
year 2013. However, the ratings company’s strong market position in the energy
segment business marked by healthy financial risk profile and sound liquidity
position. Trade relations are reported as fair. Business is active. Payments are
reported to be regular and as per commitments. The company can be considered good for normal business dealings at
usual trade terms and conditions. |
NOTES :
Any query related to this report can be made
on e-mail : infodept@mirainform.com
while quoting report number, name and date.
ECGC Country Risk Classification List – December 1, 2013
|
Country Name |
Previous Rating (30.09.2013) |
Current Rating (01.12.2013) |
|
India |
A1 |
A1 |
|
Risk Category |
ECGC
Classification |
|
Insignificant |
A1 |
|
Low |
A2 |
|
Moderate |
B1 |
|
High |
B2 |
|
Very High |
C1 |
|
Restricted |
C2 |
|
Off-credit |
D |
INDIAN ECONOMIC OVERVIEW
India’s current account deficit for the fiscal third quarter ended September
2013 narrowed to $4.2 billion or 0.9 % of the gross domestic product from $31.9
billion or 6.5 % of GDP a year earlier, thanks to a pick-up in exports and
moderation in gold imports. Manufacturing activity and new orders in India
showed their strongest growth in a year in February. The news comes as a relief
after data showed Asia’s third largest economy grew by a slower-than-expected
4.7 % annually in the three months through December. The HSBC Manufacturing
Purchasing Managers’ Index which gauges the business activity of India’s
factories but not its’ utilities, rose to 52.5 in February, its highest in a
year from 51.4 in January. Overall new orders for factory goods which rose to a
one-year high of 54.9 contributed to the surge. China has emerged as India’s
biggest trading partner in the current financial year replacing the United Arab
Emirates and pushing it to the third spot. India-China trade has reached $49.5
billion with a 8.7 % share in India’s total trade. The US comes second at $46
billion with 8.1 % share during the first nine months of the current financial
year.
The Reserve Bank of India has granted an additional nine months to the
public to exchange currency notes printed before 2005 including Rs 500 and Rs
1,000 denominations, pushing the deadline to January 1, 2015. A day before
dates for the Lok Sabha polls were announced, the government decided to hike
interest rates on fixed deposit schemes offered by post offices up to 0.2 per
cent. The new rates will be effective April, 1. The Supreme Court will resume
hearing on March, 11 Nokia’s appeal against a ruling over transferring
ownership of its local mobile phones plant which is the subject of a tax
dispute to Microsoft Corp.
In the last days of the current Government, another scam has surfaced.
The defence ministry has ordered a probe into Hindustan Aeronautics Limited’s
contracts from Britain’s Rolls-Royce Holdings worth at least $ 1.2 billion. The
Central Bureau of Investigation will look into allegations that over $80
million was paid in kickbacks in a deal signed in 2011. India has asked Boeing
Co. to find a solution for problems with state-owned Air India’s 787
Dreamliners. The aircraft has experienced a series of malfunctions since its
debut in 2011.
EXTERNAL AGENCY RATING
|
Rating Agency Name |
ICRA |
|
Rating |
AA+ (Fund Based Limits) |
|
Rating Explanation |
High degree of safety and carry very low
credit risk. |
|
Date |
January 2014 |
|
Rating Agency Name |
ICRA |
|
Rating |
A1+ (Short Term Non Fund Based Limits) |
|
Rating Explanation |
Have very strong degree of safety and carry lowest credit risk. |
|
Date |
January 2014 |
RBI DEFAULTERS’ LIST STATUS
Subject’s name is not enlisted as a defaulter
in the publicly available RBI Defaulters’ list.
EPF (Employee Provident Fund) DEFAULTERS’ LIST STATUS
Subject’s name is not enlisted as a defaulter
in the publicly available EPF (Employee Provident Fund) Defaulters’ list as of
31-03-2012.
LOCATIONS
|
Registered Office/ Factory 1 : |
D-13, MIDC Industrial
Area, R.D. Aga Road, Chinchwad, Pune – 411019, Maharashtra, India |
|
Tel. No.: |
91-20-27475941-
42/ 66122100 |
|
Fax No.: |
91-20-27472049 |
|
E-Mail : |
|
|
Website : |
|
|
|
|
|
Corporate Office : |
Thermax House, 14, Mumbai – Pune Road, Wakdewadi, Pune – 411003, Maharashtra, India |
|
Tel. No.: |
91-20-66051200 /
25542122 |
|
Fax No.: |
91-20-25542242 |
|
E-Mail : |
|
|
|
|
|
Factory 2 : |
D-1 Block, MIDC Industrial Area, Chinchwad, Pune - 411 019, Maharashtra, India |
|
|
|
|
Factory 3 : |
At Paudh, Post Mazgaon Taluka Khalapur, District Raigad –
410 206, |
|
|
|
|
Factory 4 : |
Gat No. 125, |
|
|
|
|
Factory 5 : |
Plot No.21/1-2-3, GIDC Manjusar, Taluka - Savli, District - Vadodara – 391 775, Gujarat, India |
|
|
|
|
Factory 6 : |
Survey No-169, Village Dhrub, Taluka Mundra, Mundra – 370
201, District Kutch, |
|
|
|
|
Factory 7 : |
Plot No 903/1, GIDC,
Jhagadia Industrial Estate, Jhagadia, District Bharuch – 393 110, |
|
|
|
|
Factory 8 : |
Plot No. T-1,
MIDC, Chincholi, Taluka Mohol, District Solapur – 413 255, Maharashtra, India
|
|
|
|
|
Factory 9 : |
Gat No. 125, Crusher
Road, At Post Rohakal, Taluka Khed, District Pune – 410 501, Maharashtra,
India |
|
|
|
|
Factory 10 : |
4th Floor, Energy House, D-II Block, Plot No. 38 and 39, MIDC, Chinchwad, Pune – 411019, India |
|
|
|
|
Branch Office : |
409-411, Mahakant,
Opposite V.S. Hospital, Ashram Road, Ahmedabad – 380006, Gujarat, India |
|
Tel. No.: |
91-79-26577073 |
|
Fax No. : |
91-79-26577270 |
DIRECTORS
AS ON 31.03.2013
|
Name : |
Ms. Meher Pudumjee |
|
Designation : |
Chairperson |
|
|
|
|
Name : |
Mr. M.S. Unnikrishnan |
|
Designation : |
Managing Director |
|
|
|
|
Name : |
Mr. Anu Aga |
|
Designation : |
Director |
|
|
|
|
Name : |
Dr. Raghunath A. Mashelkar |
|
Designation : |
Director |
|
|
|
|
Name : |
Dr. Valentin Von Massow |
|
Designation : |
Director |
|
|
|
|
Name : |
Mr. Nawshir Mirza |
|
Designation : |
Director |
|
|
|
|
Name : |
Mr. Tapan Mitra |
|
Designation : |
Director |
|
|
|
|
Name : |
Mr. Pheroz Pudumjee |
|
Designation : |
Director |
|
|
|
|
Name : |
Dr. Jairam Varadaraj |
|
Designation : |
Director |
KEY EXECUTIVES
|
Name : |
Mr. Gopal Mahadevan |
|
Designation : |
Executive Vice President and Chief Finance Officer |
|
|
|
|
Name : |
Mr. M.S. Unnikrishnan |
|
Designation : |
Chief Executive Officer |
|
|
|
|
Name : |
Mr. Gajanan P. Kulkarni |
|
Designation : |
Vice President – Legal and Company Secretary |
|
|
|
|
Name : |
Mr. Abhay Shah |
|
Designation : |
Accounts Manager |
|
|
|
EXECUTIVE
COUNCIL:
|
|
|
|
|
|
Name : |
Mr. Ravinder
Advani |
|
Designation : |
Executive Vice
President – ESD |
|
|
|
|
Name : |
Mr. Sharad Gangal |
|
Designation : |
Key Executive |
|
|
|
|
Name : |
Mr. Pravin Karve |
|
Designation : |
Key Executive |
|
|
|
|
Name : |
Mr. Gopal
Mahadevan |
|
Designation : |
Key Executive |
|
|
|
|
Name : |
Mr. Hemant
Mohgaonkar |
|
Designation : |
Key Executive |
|
|
|
|
Name : |
Mr. Rajan Nair |
|
Designation : |
Key Executive |
|
|
|
|
Name : |
Mr. S.
Ramachandran |
|
Designation : |
Key Executive |
|
|
|
|
Name : |
Mr. R V Ramani |
|
Designation : |
Divisional Head |
|
|
|
|
Name : |
Dr. R.R. Sonde |
|
Designation : |
Executive Vice
President |
|
|
|
|
Name : |
Mr. M. S. Unnikrishnan |
|
Designation : |
Executive Vice President |
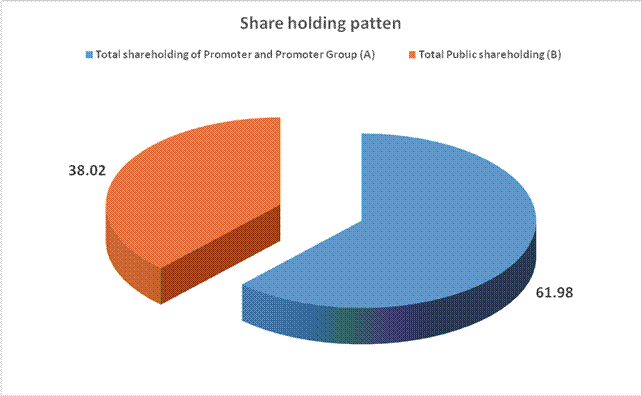
SHAREHOLDING PATTERN
AS ON 31.12.2013
|
Category of Shareholder |
Total No. of Shares |
Total Shareholding as a % of Total No. of Shares |
|
(A) Shareholding of Promoter and Promoter Group |
|
|
|
(1) Indian |
|
|
|
|
9520805 |
7.99 |
|
|
64328500 |
53.99 |
|
|
6000 |
0.01 |
|
|
6000 |
0.01 |
|
|
73855305 |
61.98 |
|
|
|
|
|
Total shareholding
of Promoter and Promoter Group (A) |
73855305 |
61.98 |
|
(B) Public
Shareholding |
|
|
|
|
|
|
|
|
6391863 |
5.36 |
|
|
2175430 |
1.83 |
|
|
19246683 |
16.15 |
|
|
27813976 |
23.34 |
|
|
|
|
|
|
3315041 |
2.78 |
|
|
|
|
|
|
6666171 |
5.59 |
|
|
7088050 |
5.95 |
|
|
417757 |
0.35 |
|
|
256329 |
0.22 |
|
|
30 |
0.00 |
|
|
32405 |
0.03 |
|
|
128993 |
0.11 |
|
|
17487019 |
14.68 |
|
Total Public
shareholding (B) |
45300995 |
38.02 |
|
Total (A)+(B) |
119156300 |
100.00 |
|
(C) Shares held by Custodians and against which Depository Receipts have been issued |
0 |
0.00 |
|
|
0 |
0.00 |
|
|
0 |
0.00 |
|
|
0 |
0.00 |
|
Total (A)+(B)+(C) |
119156300 |
0.00 |
BUSINESS DETAILS
|
Line of Business : |
Manufacturer of Solar Power Generation, Water Treatment
Plant, Industrial Boiler, Air Pollution Control System. |
||||||||
|
|
|
||||||||
|
Products : |
|
PRODUCTION STATUS [AS ON 31.03.2011]
|
Particulars |
Unit |
Installed Capacity |
Actual Production |
|
|
|
|
|
|
Energy Products and Systems a.
Boilers Capacity upto 30MT / Chillers b.
Boilers Capacity above 30MT c.
Heaters d.
Power Plants |
Nos. MT Mn. Kg Cal MW |
3441 22410 -- -- |
2141 4351 35 63 |
|
Environmental Products and Systems : |
|
|
|
|
a. Air Pollution Control Plants and Systems |
Nos. |
-- |
946 |
|
b. Water and Waste Treatment Plants |
Nos. |
-- |
1256 |
|
c. Ion Exchange Resins and Chemicals |
MT |
36161 |
19855 |
GENERAL INFORMATION
|
No. of Employees : |
4100 [Approximately] |
|||||||||||||||||||||||||||
|
|
|
|||||||||||||||||||||||||||
|
Bankers : |
|
|||||||||||||||||||||||||||
|
|
|
|||||||||||||||||||||||||||
|
Facilities : |
|
|
|
|
|
Banking
Relations : |
-- |
|
|
|
|
Auditors : |
|
|
Name : |
B.K. Khare and Company Chartered
Accountants |
|
Address : |
706/ 707, Sharda Chambers, New Marine Lines, Mumbai –
400020, |
|
|
|
|
Holding Company : |
RDA Holding and Trading Private Limited |
|
|
|
|
Domestic Subsidiaries : |
|
|
|
|
|
Overseas Subsidiaries : |
|
|
|
|
|
Joint Venture : |
|
CAPITAL STRUCTURE
AS ON 31.03.2013
Authorised Capital :
|
No. of Shares |
Type |
Value |
Amount |
|
|
|
|
|
|
375000000 |
Equity Shares |
Rs.2/- each |
Rs.750.000 Millions |
|
|
|
|
|
Issued, Subscribed & Paid-up Capital :
|
No. of Shares |
Type |
Value |
Amount |
|
|
|
|
|
|
119156300 |
Equity Shares |
Rs.2/- each |
Rs.238.300
Millions |
|
|
|
|
|
NOTES:
RECONCILIATION OF
NUMBER OF EQUITY SHARES
|
PARTICULAR |
AS ON 31.03.2013 |
|
|
|
No. of Shares |
Rs. in Millions |
|
Shares outstanding at the beginning of period |
119156300 |
238.300 |
|
Shares outstanding at the end of period |
119156300 |
238.300 |
RIGHTS,
PREFERENCES AND RESTRICTIONS ATTACHED TO SHARES
Equity Shares: The
Company has one class of equity shares having a par value of Rs.2/- per share.
Each shareholder is eligible for one vote per share held. The dividend proposed
by the Board of Directors is subject to the approval of the shareholders in the
ensuing Annual General Meeting, except in case of interim dividend. In the
event of liquidation, the equity shareholders are eligible to receive the
remaining assets of the Company after distribution of all preferential amounts,
in proportion to their shareholding.
EQUITY SHARES HELD BY HOLDING COMPANY
6,43,28,500 shares are held by holding company, RDA Holding and Trading
Private Limited.
DETAILS OF EQUITY
SHARES HELD BY SHAREHOLDERS HOLDING MORE THAN 5% OF THE AGGREGATE SHARES IN THE
COMPANY
|
PARTICULAR |
AS ON 31.03.2013 |
|
|
|
No. of Shares |
% |
|
RDA Holding and Trading Private Limited |
64328500 |
53.99 |
|
Anu Aga |
6888305 |
5.78 |
FINANCIAL DATA
[all figures are
in Rupees Millions]
ABRIDGED BALANCE
SHEET
|
SOURCES
OF FUNDS |
31.03.2013 |
31.03.2012 |
31.03.2011 |
|
I.
EQUITY
AND LIABILITIES |
|
|
|
|
(1)Shareholders' Funds |
|
|
|
|
(a) Share Capital |
238.300 |
238.300 |
238.300 |
|
(b) Reserves & Surplus |
18454.400 |
15773.500 |
12685.100 |
|
(c) Money received against share
warrants |
0.000 |
0.000 |
0.000 |
|
|
|
|
|
|
(2) Share Application
money pending allotment |
0.000 |
0.000 |
0.000 |
|
Total Shareholders’ Funds (1) + (2) |
18692.700 |
16011.800 |
12923.400 |
|
|
|
|
|
|
(3) Non-Current
Liabilities |
|
|
|
|
(a) long-term
borrowings |
4.300 |
0.800 |
0.800 |
|
(b) Deferred tax liabilities (Net) |
247.200 |
229.800 |
201.300 |
|
(c) Other long term
liabilities |
418.900 |
219.600 |
110.700 |
|
(d) long-term provisions |
0.000 |
0.000 |
0.000 |
|
Total Non-current
Liabilities (3) |
670.400 |
450.200 |
312.800 |
|
|
|
|
|
|
(4) Current Liabilities |
|
|
|
|
(a) Short term
borrowings |
119.100 |
1663.600 |
480.400 |
|
(b) Trade payables |
8880.500 |
8954.400 |
8445.500 |
|
(c) Other current
liabilities |
10121.300 |
10160.000 |
11545.900 |
|
(d) Short-term
provisions |
2557.400 |
2457.300 |
2597.200 |
|
Total Current
Liabilities (4) |
21678.300 |
23235.300 |
23069.000 |
|
|
|
|
|
|
TOTAL |
41041.400 |
39697.300 |
36305.200 |
|
|
|
|
|
|
II.
ASSETS |
|
|
|
|
(1) Non-current assets |
|
|
|
|
(a) Fixed Assets |
|
|
|
|
(i) Tangible assets |
5275.500 |
4988.000 |
4717.500 |
|
(ii) Intangible Assets |
270.600 |
328.200 |
148.600 |
|
(iii) Capital
work-in-progress |
909.000 |
419.700 |
297.300 |
|
(iv) Intangible assets under development |
0.000 |
0.000 |
0.000 |
|
(b) Non-current
Investments |
3936.900 |
3509.700 |
2609.100 |
|
(c) Deferred tax
assets (net) |
0.000 |
0.000 |
0.000 |
|
(d) Long-term Loan and Advances |
261.700 |
301.500 |
260.800 |
|
(e) Other
Non-current assets |
1983.000 |
1020.000 |
1693.300 |
|
Total Non-Current
Assets |
12636.700 |
10567.100 |
9726.600 |
|
|
|
|
|
|
(2) Current assets |
|
|
|
|
(a) Current investments |
4102.900 |
2017.200 |
1434.500 |
|
(b) Inventories |
2103.300 |
2792.200 |
2823.200 |
|
(c) Trade receivables |
14238.900 |
12456.300 |
9611.700 |
|
(d) Cash and cash
equivalents |
2226.200 |
5697.500 |
5956.900 |
|
(e) Short-term loans
and advances |
1250.500 |
1581.200 |
1831.100 |
|
(f) Other current
assets |
4482.900 |
4585.800 |
4921.200 |
|
Total Current Assets |
28404.700 |
29130.200 |
26578.600 |
|
|
|
|
|
|
TOTAL |
41041.400 |
39697.300 |
36305.200 |
PROFIT & LOSS
ACCOUNT
|
|
PARTICULARS |
31.03.2013 |
31.03.2012 |
31.03.2011 |
|
|
|
SALES |
|
|
|
|
|
|
|
Income |
46908.700 |
53040.600 |
48523.600 |
|
|
|
Other Income |
730.100 |
704.900 |
831.300 |
|
|
|
TOTAL (A) |
47638.800 |
53745.500 |
49354.900 |
|
|
|
|
|
|
|
|
Less |
EXPENSES |
|
|
|
|
|
|
|
Cost of Materials Consumed |
30584.600 |
35283.600 |
32892.000 |
|
|
|
Purchases of Stock-in-Trade |
1178.900 |
1558.800 |
1415.300 |
|
|
|
Employee Benefits |
4015.700 |
3874.300 |
3686.400 |
|
|
|
Other Expenses |
6084.500 |
6518.600 |
5327.900 |
|
|
|
Changes in Inventories |
(26.300) |
(33.800) |
(148.800) |
|
|
|
TOTAL (B) |
41837.400 |
47201.500 |
43172.800 |
|
|
|
|
|
|
|
|
Less |
PROFIT
/ (LOSS) BEFORE INTEREST, TAX, DEPRECIATION AND AMORTISATION (A-B) (C) |
5801.400 |
6544.000 |
6182.100 |
|
|
|
|
|
|
|
|
|
Less |
FINANCIAL
EXPENSES (D) |
96.500 |
65.500 |
21.800 |
|
|
|
|
|
|
|
|
|
|
PROFIT
/ (LOSS) BEFORE TAX, DEPRECIATION AND AMORTISATION (C-D) (E) |
5704.900 |
6478.500 |
6160.300 |
|
|
|
|
|
|
|
|
|
Less/ Add |
DEPRECIATION/
AMORTISATION (F) |
548.600 |
469.500 |
433.300 |
|
|
|
|
|
|
|
|
|
|
PROFIT / (LOSS)
BEFORE TAX (E-F) (G) |
5156.300 |
6009.000 |
5727.000 |
|
|
|
|
|
|
|
|
|
Less |
TAX (H) |
1656.700 |
1940.400 |
1902.800 |
|
|
|
|
|
|
|
|
|
|
PROFIT / (LOSS)
AFTER TAX (G-H) (I) |
3499.600 |
4068.600 |
3824.200 |
|
|
|
|
|
|
|
|
|
Add |
PREVIOUS
YEARS’ BALANCE BROUGHT FORWARD |
10914.600 |
8235.400 |
6057.600 |
|
|
|
|
|
|
|
|
|
Less |
APPROPRIATIONS |
|
|
|
|
|
|
|
Transfer to General Reserve |
350.000 |
420.000 |
400.000 |
|
|
|
Proposed Equity Dividend |
834.100 |
834.100 |
1072.400 |
|
|
|
Tax on Dividend |
141.800 |
135.300 |
174.000 |
|
|
BALANCE CARRIED
TO THE B/S |
13088.300 |
10914.600 |
8235.400 |
|
|
|
|
|
|
|
|
|
|
EARNINGS IN
FOREIGN CURRENCY |
|
|
|
|
|
|
|
Export of Goods on FOB |
6567.200 |
7257.300 |
6122.000 |
|
|
|
Other Earnings |
140.000 |
61.400 |
54.000 |
|
|
TOTAL EARNINGS |
6707.200 |
7318.700 |
6176.000 |
|
|
|
|
|
|
|
|
|
|
IMPORTS |
|
|
|
|
|
|
|
Raw Materials |
1311.900 |
4649.700 |
3254.300 |
|
|
|
Components & Spares |
708.000 |
1167.800 |
1423.900 |
|
|
|
Consumables |
51.200 |
63.200 |
84.600 |
|
|
|
Capital Goods |
146.200 |
31.700 |
15.200 |
|
|
TOTAL IMPORTS |
2217.300 |
5912.400 |
4778.000 |
|
|
|
|
|
|
|
|
|
|
Earnings /
(Loss) Per Share (Rs.) |
29.37 |
34.15 |
32.09 |
|
KEY RATIOS
|
PARTICULARS |
|
31.03.2013 |
31.03.2012 |
31.03.2011 |
|
PAT / Total Income |
(%) |
7.35
|
7.57 |
7.75 |
|
|
|
|
|
|
|
Net Profit Margin (PBT/Sales) |
(%) |
10.99
|
11.33 |
11.80 |
|
|
|
|
|
|
|
Return on Total Assets (PBT/Total Assets} |
(%) |
14.25
|
16.80 |
17.15 |
|
|
|
|
|
|
|
Return on Investment (ROI) (PBT/Networth) |
|
0.27
|
0.38 |
0.44 |
|
|
|
|
|
|
|
Debt Equity Ratio (Total Debt/Networth) |
|
0.01
|
0.10 |
0.04 |
|
|
|
|
|
|
|
Current Ratio (Current Asset/Current Liability) |
|
1.31
|
1.30 |
1.19 |
FINANCIAL ANALYSIS
[all figures are
in Rupees Millions]
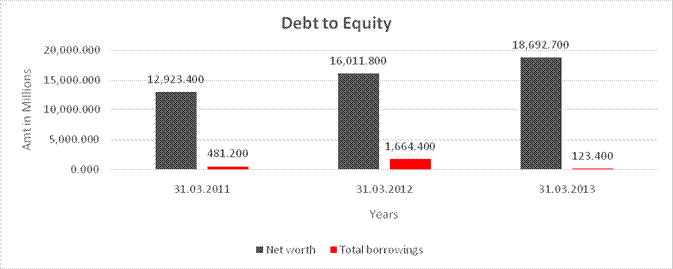
DEBT EQUITY RATIO
|
Particular |
31.03.2011 |
31.03.2012 |
31.03.2013 |
|
|
(Rs.
In Millions) |
(Rs.
In Millions) |
(Rs.
In Millions) |
|
Share Capital |
238.300 |
238.300 |
238.300 |
|
Reserves & Surplus |
12,685.100 |
15,773.500 |
18,454.400 |
|
Net
worth |
12,923.400 |
16,011.800 |
18,692.700 |
|
|
|
|
|
|
long-term borrowings |
0.800 |
0.800 |
4.300 |
|
Short term borrowings |
480.400 |
1,663.600 |
119.100 |
|
Total
borrowings |
481.200 |
1,664.400 |
123.400 |
|
Debt/Equity
ratio |
0.037 |
0.104 |
0.007 |
YEAR-ON-YEAR GROWTH
|
Year
on Year Growth |
31.03.2011 |
31.03.2012 |
31.03.2013 |
|
|
(Rs.
In Millions) |
(Rs.
In Millions) |
(Rs.
In Millions) |
|
Sales |
48,523.600 |
53,040.600 |
46,908.700 |
|
|
|
9.309 |
-11.561 |
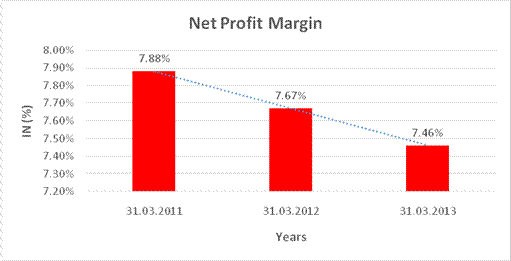
NET PROFIT MARGIN
|
Net
Profit Margin |
31.03.2011 |
31.03.2012 |
31.03.2013 |
|
|
(Rs.
In Millions) |
(Rs.
In Millions) |
(Rs.
In Millions) |
|
Sales |
48,523.600 |
53,040.600 |
46,908.700 |
|
Profit |
3,824.200 |
4,068.600 |
3,499.600 |
|
|
7.88% |
7.67% |
7.46% |
LOCAL AGENCY FURTHER INFORMATION
|
Sr. No. |
Check List by
Info Agents |
Available in
Report (Yes / No) |
|
1] |
Year of Establishment |
Yes |
|
2] |
Locality of the firm |
Yes |
|
3] |
Constitutions of the firm |
Yes |
|
4] |
Premises details |
No |
|
5] |
Type of Business |
Yes |
|
6] |
Line of Business |
Yes |
|
7] |
Promoter's background |
No |
|
8] |
No. of employees |
Yes |
|
9] |
Name of person contacted |
No |
|
10] |
Designation of contact person |
No |
|
11] |
Turnover of firm for last three years |
Yes |
|
12] |
Profitability for last three years |
Yes |
|
13] |
Reasons for variation <> 20% |
-- |
|
14] |
Estimation for coming financial year |
No |
|
15] |
Capital in the business |
Yes |
|
16] |
Details of sister concerns |
Yes |
|
17] |
Major suppliers |
No |
|
18] |
Major customers |
No |
|
19] |
Payments terms |
No |
|
20] |
Export / Import details (if applicable) |
No |
|
21] |
Market information |
-- |
|
22] |
Litigations that the firm / promoter involved in |
Yes |
|
23] |
Banking Details |
Yes |
|
24] |
Banking facility details |
Yes |
|
25] |
Conduct of the banking account |
-- |
|
26] |
Buyer visit details |
-- |
|
27] |
Financials, if provided |
Yes |
|
28] |
Incorporation details, if applicable |
Yes |
|
29] |
Last accounts filed at ROC |
Yes |
|
30] |
Major Shareholders, if available |
No |
|
31] |
PAN of Proprietor/Partner/Director, if available |
No |
|
32] |
Date
of Birth of Proprietor/Partner/Director, if available |
No |
|
33] |
Voter ID No of Proprietor/Partner/Director, if available |
No |
|
34] |
External Agency Rating, if available |
Yes |
LITIGATION DETAILS:
HIGH COURT OF
BOMBAY
|
Bench:- Bombay |
|||||||
|
Stamp No:- |
WPST/17589/2013 |
Failing Date:- |
28/06/2013 |
Reg. No.:- |
WP/6874/2013 |
Reg. Date:- |
31/07/2013 |
|
Petitioner:- |
TRANSPARENT ENERGY SYSTEMS PVT. .TD. |
Respondent:- |
THERMAX LIMITED |
||||
|
Petn.Adv:- |
M/S. JEHANGIR GULABBHAI AND BILIMOIRA |
Resp. Adv:- |
GOVERNMENT PLEADER |
||||
|
District:- |
PUNE |
||||||
|
Bench:- |
SINGLE |
||||||
|
Status:- |
Pre-Admission |
||||||
|
Next Date:- |
01/04/2014 |
Stage:- |
FOR ORDERS |
||||
|
Coram:- |
REGISTRAR (JUDICIAL) |
||||||
|
Last Date:- |
24/02/2014 |
Stage:- |
FOR ORDERS |
||||
|
Last Coram:- |
REGISTRAR
(JUDICIAL) |
||||||
|
Act:- |
C.P.C.-
(Interlocutory Order) |
|
|||||
UNSECURED LOAN
|
Particulars |
As
on 31.03.2013 [Rs.
in Millions] |
As
on 31.03.2012 [Rs.
in Millions] |
|
Long Term
Borrowings |
|
|
|
Term Loan |
|
|
|
From Other than Banks |
3.000 |
0.000 |
|
|
|
|
|
Short Term
Borrowings |
|
|
|
From Banks |
0.000 |
1628.000 |
|
TOTAL
|
3.000 |
1628.000 |
ANNUAL PERFORMANCE:
For the financial
year 2012-13, the company reported total revenue of Rs. 47639.000 Millions as
against last year’s revenue of Rs. 53746.000 Millions, a reduction of 11.4 %
owing to a lower order book at the beginning of the year. Thermax’s Energy
business – Boiler and Heater, Power, Cooling and Heating divisions plus the
fledgling Solar group – contributed 77% of the total revenue while the
Environment business comprising Air Pollution Control, Water and Waste
Solutions and Chemical division accounted for the remaining 23%. Last year the
share of Energy and Environment businesses was 78% and 22% respectively.
During the year,
exports including deemed exports were at Rs. 9839.000 Millions against Rs.
11427.000 Millions last year, a decrease of 13.9%. Profit before tax at Rs.
5156.000 Millions was 10.8% of the total revenue, compared to Rs. 6009.000
Millions, 11.2%, previous year. In a year that continued to witness increase in
input costs, lower price realizations and reduced revenues, the company
maintained EBITDA margins at 10.8% as the management continued focusing on
operational efficiency and controlling costs on a sustainable basis across the
company.
Profit after tax
stood at Rs. 3500.000 Millions compared to Rs. 4069.000 Millions in the
previous year. Earnings per share (EPS) declined to Rs. 29.37 from Rs. 34.15 in
FY 2011-12. Order booking for the year was Rs. 48590.000 Millions against Rs.
40320.000 Millions last year, registering an increase of 20%. The company
completed the year with an order backlog of Rs. 43570.000 Millions as against
Rs. 42300.000 Millions in FY 2011- 12. Like the previous year, FY 2012-13 has
also been challenging for the capital goods sector. The difficulties of the
power sector and the resulting absence of fresh investments and order
finalizations continued.
Profit after tax
on a consolidated basis is lower than the stand-alone results owing to the
losses incurred by Thermax Instrumentation Limited (TIL), Thermax (Zhejiang)
Cooling and Heating Engineering Company Limited (TZL) and the company’s share
of losses in the joint venture subsidiaries, Thermax Babcock and Wilcox Energy
Solutions Private Limited (TBWES) and Thermax SPX Energy Technologies Limited (TSPX).
TIL, which undertakes construction and commissioning work for the Power
division of the company, is expected to face another challenging year ahead. In
the tough market conditions prevailing in China, TZL is still working towards
breaking even. The construction of the manufacturing plant of TBWES is nearing
completion and the JV is focusing on making it operational.
MANAGEMENT
DISCUSSION AND ANALYSIS:
OVERVIEW OF THE
BUSINESS ENVIRONMENT:
As the economic
distress in international markets continued, global economic growth slowed to
3.2% in 2012 from 3.9% in the previous year. Most international markets,
especially the larger economies, experienced even tougher times in the past
year. With the continuing Eurozone difficulties, austerity measures resulted in
less spending, further slowing down economic growth. Among advanced economies,
Japan appeared to be the only exception and with its new economic policy
unveiled, poised to reverse its prolonged phase of deflation.
The American GDP
shrank 0.1% further in the fourth quarter of 2012 while unemployment dropped to
7.9% in January ’13 indicating that turnaround will be a painfully slow process
for the world’s largest economy. The overall growth rate for developed
economies was much lower at 1.6% and 1.3% for 2011 and 2012 respectively. Many
emerging economies including those of BRIC (Brazil, Russia, India, and China)
countries have witnessed decelerating growth with financial protection measures
being introduced by some.
On the domestic
front, the Indian economy continues to be in the grip of a slowdown, though
among the developing economies, only China and Indonesia grew faster than India
in FY 2012-13. While strong post financial- crisis stimulus led to stronger
growth in FY 2009-10 and FY 2010-11, in the last two years (FY 2011-12 and FY
2012-13), growth slowed to 6.2% and 5.0% respectively. Growth in the services
sector also declined from 8.2% in FY 2011-12 to 6.6% in FY 2012-13. High
inflation and the tightening monetary policies slowed down consumption demand
in FY 2012-13. The consumer price index (CPI) for inflation also remained close
to double digits throughout the year.
The continued
global slowdown led to surplus capacities in Europe and China, thus affecting
capital goods exports from India especially in the power sector. With net
exports declining, India’s balance of payments and current account deficit have
come under pressure. With government savings falling, the current account
deficit also widened due to higher external borrowings.
The capital goods
sector was adversely affected for the second consecutive year. Investments have
continued to be low especially in infrastructure sectors like power due to
policy challenges affecting important milestones such as environmental
clearances, fuel linkages and land acquisition, among others. Factors like
sectoral banking limit exhaustion and tariff revisions have further added to
the complexities resulting in a large number of big projects being delayed. The
sector hasn’t seen any improvement in new order finalizations. There aren’t
visible signs of change in the situation in the immediate future as this
stagnation is likely to continue, severely limiting the number of active
projects in the market. Moreover, projects that have been sanctioned are slowing
their pace of execution, bringing tightness to the cash cycle. Competition has
become intense due to many players chasing fewer orders.
The year saw
capacity utilization in the capital goods sector hovering at about 70% with
above average inventory levels and no major capacity additions announced. With
the country approaching general elections, the possibilities of new radical
policy changes and their implementation or their positive impact on large lead
projects seem unlikely.
However, it is not
all gloom. In recent months, there have been signals of positive growth from
both USA and Japan. In India, there have been some encouraging indicators for
prospects of growth in the medium and long term. From its peak of 8.3% in
November 2011, inflation declined to 4.2% in December 2012. The consumer spend
has sustained so far with consumption in smaller towns and rural areas
maintaining its active trend, stimulating growth of smaller process industries,
though at a slow pace.
The cement sector
is witnessing better capacity utilization and profitability. The oil and gas
sector is also expected to be buoyant in FY 2013-14 as major PSU oil companies
have declared their expansion plans for the coming year. In the steel sector,
beyond some brown field expansion in the near future, no major revival is
visible. Food processing continues to see expansion and new investments.
Overall, though the aspirational imperatives of the economy and the derisking
strategies that individual companies are putting in place could have some
positive effect, FY 2013-14 is going to be another challenging year.
The power sector
continues to lag behind and no major changes are expected even next year. The
88,000 MW generation capacity aimed for in the 12th Five-Year Plan (2012-17) is
still held up in the confusion of governmental policy formulation and
implementation. Though various measures from amending existing fuel supply
agreements (FSAs) to price pooling of coal are being discussed, closure on
these critical issues still remains elusive and prospects of recovery for the
sector remains distant. The power shortages in many states across the country
will compel the revival of captive power generation in the coming year. This
augurs well for the captive power generation business.
There are
indisputable grounds for growth and there is the expectation that the economy
will shift to its earlier phase of dynamism. Though the last two years saw
economic performance slipping below what was expected, effective government
policies and planning can ensure growth for India. Such a revival demands
investments in energy and non-conventional resources. Though short term
prospects appear bleak, for companies positioned in the power sector, outlook
for medium and long-term is good.
Despite political
difficulties, the government has made some bold moves in the past few months.
The Union budget is designed with a medium term focus. Efforts to contain
fiscal deficit plus the measures to alter the current account deficit situation
are positive signals for the economy and are bound to give the required
stimulus to revive the country’s exports. The budgetary allocation for the
proposed implementation of Goods and Services Tax will certainly stimulate
industrial growth. Investment allowance for projects of over Rs. 1000.000
Millions will provide the impetus for companies to opt for investments.
The scheme for
restructuring the debts of state power distribution companies could lead to
better recoveries and may encourage capacity additions in the long run. The
setting up of the Cabinet Committee of Investment headed by the Prime Minister
to fast-track mega projects is a welcome move for the industry. Permitting FDI
in a number of areas including power exchanges is a ray of hope for a revival
in the power sector. However, as it takes time for policy intent to be
translated to industrial revival, it will take longer for its impact to be felt
by the capital goods sector and FY 2013-14 is not going to be significantly
different from FY 2012-13.
OVERVIEW OF
COMPANY OPERATIONS:
The company posted
lower results for fiscal FY 2012-13 with a total revenue of Rs. 47639.000
Millions and a net profit after tax of Rs. 3500.000 Millions. Export income,
including deemed exports decreased by 13.9% to Rs. 9839.000 Millions. The
economic uncertainties in the domestic and international markets resulted in a
reduced opening order book, affecting Thermax’s performance for the year.
However, the order booking during the year improved to Rs. 48590.000 Millions,
an increase of 20 % from the previous year. With lower opening carry forwards,
the project businesses of the company – power, large boilers and air pollution
control – performed at lower levels. Still, the order balance at the end of the
year stood at Rs. 43570.000 Millions, a marginal improvement of 3% over the
previous year.
The company’s
standard product businesses, except heating, have a healthy order book. They
introduced several new products that could bring in new revenue streams for the
company in the coming years. A separate segment in this report provides details
of the new products. The order booking during the year was mainly from public
sector steel units, cement and power sectors. Food and food processing, textile
and pharma also contributed. For the export market, South East Asia and the
Middle East accounted for the largest market share. Thermax also continued to
make inroads in the African market. The Service business of the company grew by
44.6% over the previous year.
NEW PRODUCTS:
The Cooling
division introduced ‘Dry Coolers’. They are convective heat transfer machines
and substitute conventional wet cooling towers. As the dry coolers utilize air
as a medium for heat transfer unlike cooling towers that use water, they can
help industries operating in areas troubled by water scarcity. Hybrid Chillers,
also introduced during the year, combine absorption and compression
technologies to reduce power consumption by half while generating additional
steam or other forms of heat. They offer sub-zero chilling for process cooling
applications.
Both these cooling
systems have already found customers. The Heating business group launched a
solid fuel fired hot air generator called Aquaerotherm to provide clean hot air
for process heating and drying. The group has already supplied several units to
tea estates. The Research, Technology
and Innovation Centre (RTIC) successfully completed a technology demonstration
project of a solar based cold storage facility for rural areas. Installed at
the Solar Energy Centre of the Ministry of New and Renewable Energy (MNRE) at
Gurgaon, the system is now ready for demonstration under different conditions.
ENERGY SEGMENT
ANALYSIS:
Energy business of
the company accounted for 77% of segmental revenues and has declined by 12.4%,
owing to the lower order carry forwards. This segment had a profitability of
10.4% (10.7% last year). The adverse factors affecting project businesses
impacted this segment’s performance, especially that of the large boilers.
However, the standard products businesses – Cooling and Heating – capitalized
on the sectors unaffected by the slowdown and performed reasonably well. The
Operation and Maintenance (O and M) group of the Power business continued to do
well. The services business of Cooling and Heating entered new markets in
Africa and the Middle East. The gap in the demand and supply of power as well
as the sharp increase in electricity rates in some states is expected to
provide an impetus to the company’s captive power generation business.
POWER:
Power division
registered lower revenues owing to lower carry forward business from the
previous year. However, during the year the group was able to achieve higher
order booking, which promises a better FY 2013-14.
The Power division
won several EPC power plant orders from a number of prestigious customers in
India and abroad. Among them were orders for an 80 MW captive power plant from
a leading Government of India enterprise for its new 3 mtpa integrated steel
plant in central India and a combined cycle extension project from a leading
PSU in the North East of India. The year also witnessed the division winning
breakthrough orders from new sectors like pharmaceuticals and distilleries. It
has also entered the solar thermal space by being the EPC partner for a project
to set up Asia’s largest power plant based on Compact Linear Fresnel Reflector
(CLFR) technology.
The division
advanced its internationalization programme to de-risk reliance on the domestic
business and has successfully entered the emerging markets of Africa with an
order from Zambia. It also expanded its presence in SAARC with an order from
Sri Lanka. For a captive cogeneration plant built for a leading paper
manufacturer in the Philippines, the division won the prestigious Gold Award at
the Asian Power Award 2012. Leveraging this success, it also bagged another 20
MW biomass based power project in the region.
The division
commissioned over 400 MW of power projects in 2012-13. These included the first
units of two of its major projects – the 300 MW IPP in Andhra Pradesh and the
120 MW captive power plants for a ferro alloy plant in Orissa, demonstrating
its capability to set up larger power plants. The division continued to focus
on safety measures at its project sites and ensured ‘safe man hours’ at
multiple sites across the country.
In view of a
healthy order book this financial year, the division expects a marginal
improvement in performance.
POWER PLANT
MANAGEMENT (O AND M) SERVICES:
The Power Plant
Management (O and M) business continued its healthy growth in revenues with
repeat orders and renewals of earlier contracts from most of its customers.
This service group won a bonus for achieving more than 99% reliability at a
cement company’s captive power plant which it is operating and maintaining. It
also bagged the Best Contractor Award for 2012 from one of the leading Chlor
Alkali manufacturers in India for its O and M services. Outsourcing of power
plant O and M is fast becoming a preferred option, resulting in a positive
outlook for this business.
THERMAX
INSTRUMENTATION LIMITED (WHOLLY OWNED SUBSIDIARY):
Thermax
Instrumentation Limited, the construction arm of the Power division, earned a
total income of Rs. 2174.000 Millions during the year (Rs. 2495.000 Millions,
previous year). The company posted a net loss of Rs. 200.000 Millions (Rs.
104.000 Millions loss, previous year) mainly because of cost overruns and
provisions on certain contracts. Order booking in the captive power sector in
the current year is Rs. 1907.000 Millions (Rs. 1001.000 Millions, previous
year). Efforts are on to improve the company’s performance and bring about a
turnaround in FY 2013-14.
BOILER AND HEATER:
The Boiler and
Heater (B and H) division of the company registered revenues lower than the
previous year. Lower order carry forward from the previous year, sluggish
investment climate and the near absence of new projects affected its
performance. During the year the division successfully commissioned many large
Circulating Fluidized Bed Combustion (CFBC) / pulverized coal fired boilers and
high capacity fired heaters. At a refinery in Gujarat, the division
commissioned utility scale power boilers (2 x 750 TPH capacities, 2 x 225 MW
equivalent). The Strategic Business Unit (SBU) also commissioned its largest
capacity oil and gas fired boiler for a fertilizer company in Egypt.
The division
bagged orders for blast furnace gas fired boilers from steel companies. From
international EPC companies it won two prestigious orders for waste heat
recovery boilers.
Having
commissioned three high capacity bagasse fired boilers and concluding an order
for a fourth boiler, B and H is establishing its foothold in Thailand. During
the year the division implemented ‘Project Ascent’ to improve business
performance In the absence of new investments and a lower order book, outlook
for the Boiler and Heater division’s performance in FY 2013-14 will be subdued.
B AND H SERVICES:
The Services arm
of the Boiler and Heater Group was able to obtain a large number of spares orders.
The Group also successfully bid for several plant improvement projects (PIP)
for competitors’ boilers and heaters in both domestic and overseas markets.
It enhanced its
presence in the Condition Assessment and Residual life Analysis of heating systems.
Besides, the Services group also carried out substantial developmental
activities for the Indian navy, as part of their indigenization programme. During the year, based on customer industry
clusters, the SBU mobilized a number of service engineers at different
locations in India to cater to service requirements.
THERMAX
ENGINEERING CONSTRUCTION COMPANY LIMITED (WHOLLY OWNED SUBSIDIARY):
The Company
undertakes and executes engineering construction projects mainly for the Boiler
and Heater division of the company. This subsidiary posted a total income of
Rs. 1917.000 Millions for the year (Rs. 1710.000 Millions, previous year) on
account of increased scale of operations. It made a profit after tax of Rs.
45.000 Millions (Rs. 71.000 Millions, previous year), the dip due to increase
in direct cost and decrease in other income during the year. With its year-end
order balance lower than the previous year due to the slowdown in the relevant
sectors where it operates, the company expects a challenging FY 2013-14.
COOLING:
The Cooling
business had a healthy growth in revenues as well as order booking in FY
2012-13.
In India, the
division maintained its performance despite the difficult economic conditions
and factors that affected the market such as the substantial rise in gas price
and its non-availability. Innovative applications and the introduction of newer
products have enabled the business to offset challenging conditions. With
substantial increase in power costs in several states in the recent past, the
outlook for the Indian market looks positive.
International
business accounted for more than a half of revenues as well as order booking.
In spite of the difficult economic situation, business from Europe grew on
account of large capacity heat-pump orders. The market share improved
substantially in Bangladesh and business from new territories like Algeria,
Lebanon, Tunisia, South Africa and Qatar contributed to growth. With
consolidation in the markets of Africa, Russia and Turkey, the installed base in
these regions is set to improve. Outlook for the export business is also
positive for FY 2013-14.
The division
introduced the triple effect series of chillers which is a path breaking
achievement in vapour absorption technology. These chillers that work on hot
water, steam and exhaust are 25% more efficient as compared to double-effect
technology. Exhaust based triple effect will give 15% more heat recovery than
currently operating chillers, a key differentiator for cogeneration
requirements.
Other products
introduced during the year include ‘Dry Cooler’, slated to find increasing
acceptance in view of the looming water scarcity and Hybrid Chiller, combining
absorption and compression technologies to reduce power consumption by half
while generating additional steam or other forms of heat. With a healthy order
carry forward, buoyancy in some of its export markets and a domestic power
situation troubled by shortages and sharp rise in electricity charges, the
cooling business is poised to maintain growth in FY 2013-14.
THERMAX (ZHEJIANG)
COOLING AND HEATING ENGINEERING COMPANY LIMITED (WHOLLY OWNED SUBSIDIARY):
The turnover of
this company supporting the global cooling business declined marginally
compared to the previous year. For FY 2012-13, the revenue stood at RMB 61.7
million (USD 9.9 million) as compared to RMB 67.7 million (USD 10.89 million).
After accounting for interest and depreciation, loss for the year was RMB 10.3
million (USD 1.66 million) compared to RMB 8.4 million (USD 1.3 million) for last
year.
The fall in
revenue has been primarily due to the global slowdown that also affected China,
and competition in the local market. The company continues to supply quality
equipment to its customers on time.
With product orders
being flat, the company would focus on making its service more effective in
China by establishing a service franchisee network.
THERMAX INC.
(WHOLLY OWNED SUBSIDIARY):
Thermax Inc., the
US subsidiary, recorded revenues of USD 12.7 million (USD 13.6 million,
previous year) and a profit after tax of USD 0.17 million (USD 0.21 million,
previous year) in FY 2012-13. In view of the slow recovery of the US economy,
the performance of the company in FY 2013-14 is likely to be subdued.
THERMAX EUROPE LIMITED
(WHOLLY OWNED SUBSIDIARY):
Operating in the
tough conditions that continued to prevail in Europe in FY 2012-13, the
subsidiary was able to maintain its performance.
The year closed
with a turnover of £ 5.30 million (£ 5.35, previous year.) The pretax profit,
stands at £ 635,000 (£ 611,864, previous year). The strong carry forward at the
beginning of the year helped the company to achieve its projected turnover. No
availability of funds in the market has affected the performance in southern
Europe, where squeeze on funding to public projects have affected the cogen
markets for Thermax chillers. The Heat pump business continued to find
application in district heating networks and is part of the energy efficiency
schemes for such plants. The company has bagged in March ’13 the largest ever
order from Europe for the supply of large heat pumps for a project in Denmark.
OTHER WHOLLY OWNED
SUBSIDIARIES:
THERMAX ONSITE
ENERGY SOLUTIONS LIMITED (TOESL):
TOESL established
Thermax’s energy rental business and earned a total income of Rs. 113.000
Millions as against 92.000 Millions for the previous year. Profit after tax was
at Rs. 13.000 Millions against 11.000 Millions in the previous year. During the
year 2012-13, the company generated and supplied 43,794 tons of steam and 4,240
Mn Kcal of heat from existing projects for various clients. TOESL bagged three
prestigious orders from leading multinational and Indian companies for supply
of steam for their manufacturing facilities in southern and western India.
With companies
reluctant to opt for capital expenditure, TOESL’s business model is likely to
attract more customers. The outlook for the company is encouraging.
THERMAX
SUSTAINABLE ENERGY SOLUTIONS LIMITED (TSESL):
During the year,
the company successfully registered 27 projects under the Program of Activities
(POA) with the United Nations Framework Convention on Climate Change (UNFCCC).
However, overall outlook of this business, at present, isn’t encouraging due to
the very low price of Certified Emission Reductions (CERs) in the global
market. The company is closely watching developments and will make moves that
are in the best interest of the company and its customers.
If there is no improvement
in the price of CERs in the global market, the entire viability of the business
will be challenging, compelling us to take curtailment decisions.
JOINT VENTURE
SUBSIDIARIES:
THERMAX BABCOCK
and WILCOX ENERGY SOLUTIONS PRIVATE LIMITED:
During the year,
the company has successfully transferred the technology from Babcock and
Wilcox, the JV partner, for 660 MW and 800 MW in the supercritical range.
Indigenization of the technology including critical components conforming to
Babcock and Wilcox standards has been completed. The manufacturing plant
construction at Shirwal, Satara (Maharashtra) is nearing completion.
The Shirwal plant
has already received Indian Boiler Regulation (IBR) approval and its products
will be built in accordance with the Boiler and Pressure Vessel Code of the
American Society of Mechanical Engineers (ASME). The company does not expect a
quick reversal of the market conditions that are troubling the power equipment
sector in the country – weak financial position of the generation companies,
banks’ reluctance to go beyond sectoral lending limits, non availability of
coal, and non passage of land acquisition bill by the Parliament and so on. It
is preparing to address the limited number of active contract finalization
expected in the forthcoming year.
THERMAX SPX ENERGY
TECHNOLOGIES LIMITED:
During the year,
this joint venture won orders for air cooled condensers for thermal power
plants and successfully completed their design, engineering, manufacturing,
installation and commissioning.
The company earned
an income of Rs. 164.000 Millions against Rs. 43.2000 Millions in the previous
year. It incurred a net loss of Rs. 24.3000 Millions compared to Rs. 41.500
Millions in the previous year. The company plans to extend its presence to
international markets with support from SPX Cooling Technologies and Balcke
Duerr GmbH, the subsidiaries of the JV partner, SPX Corporation. However, the
year ahead will remain a challenging one.
CONTINGENT LIABILITIES NOT PROVIDED FOR:
a. Disputed
demands in respect of Excise, Customs Duty and Service Tax Rs. 402.400 Millions
(Previous year Rs. 148.200 Millions), Sales Tax Rs. 175.000 Millions (Previous year Rs. 185.100 Millions) and
other Statutes Rs. 01.400 Millions (Previous
year Rs.01.000 Million)
b. i) Income Tax
demands disputed in appellate proceedings Rs. 854.500 Millions (Previous year Rs.758.600 Millions)
ii) References /
Appeals preferred by Income Tax department in respect of which, should the
ultimate decision be unfavorable to the Group, the liability is estimated to be
Rs. 268.700 Millions (Previous year
Rs. 208.200 Millions)
c. Liability for
unexpired export obligations Rs. 25.000 Millions (Previous year Rs.79.700 Millions)
d. Claims against Group
not acknowledged as debts Rs. 94.300 Millions (Previous year Rs.86.400 Millions)
e. Bills
Discounted with banks Rs. 453.200 Millions (Previous year Rs. 382.100 Millions)
f. Liability in
respect of partly paid shares Rs. 01.900 Millions (Previous year Rs.01.900 Millions)
g. Future Lease obligations payable on non-cancelable operating leases
Rs. 07.400 Millions (Previous year
Rs.17.300 Millions)
INDEX OF CHARGES
|
S. No. |
Charge ID |
Date of Charge
Creation/Modification |
Charge amount secured
|
Charge Holder |
Address |
Service Request
Number (SRN) |
|
1 |
10245831 |
30/09/2010 |
2,868,580.00 |
DEPARTMENT OF BIOTECHNOLOGY |
6-8TH FLOOR, BLOCK NO. 2, CGO COMPLEX, LODHI ROAD, NEW DELHI, NEW DELHI, DELHI - 110003, INDIA |
A97082846 |
|
2 |
90090872 |
26/03/2010 * |
27,850,000,000.00 |
UNION BANK OF INDIA LIMITED |
INDUSTRIAL FINANCE BRANCH, 619, SACHAPIR STREET, CAMP, PUNE, MAHARASHTRA - 411001, INDIA |
A82908773 |
|
3 |
90084773 |
03/07/1998 * |
1,500,000.00 |
UNION BANK OF INDIA |
INDUSTRIAL FINANCE BRANCH, CAMP, PUNE, MAHARASHTRA - 411001, INDIA |
- |
|
4 |
90084586 |
01/09/1998 * |
26,000,000.00 |
CORPORATION BANK |
INDUSTRIAL FINANCE BRANCH, PUNE MUMBAI ROAD WAKDE |
- |
* Date of charge modification
STANDALONE
AUDITED FINANCIAL RESULTS FOR THE QUARTER ENDED DECEMBER 31, 2013
(Rs. In Millions)
|
Sl. No. |
Particulars |
3 Months ended 31.12.2013 |
3
Months ended 30.09.2013 |
9
Months ended 31.12.2013 |
|
|
|
(Unaudited) |
(Audited) |
(Unaudited) |
|
1 |
Income from operations |
|
|
|
|
|
(a) Net
Sales / Income from Operations (Net of excise duty) |
10018.541 |
10296.406 |
28825.114 |
|
|
(b) Other
Operating Income |
119.207 |
136.341 |
371.256 |
|
|
Total Income from operations (net) |
10137.748 |
10432.747 |
29196.370 |
|
2 |
Expenses |
|
|
|
|
|
(a) Cost
of material consumed |
6437.634 |
6485.675 |
17770.684 |
|
|
(b)
Purchases of stock-in-trade |
376.710 |
239.436 |
811.803 |
|
|
(c)
Changes in inventories of finished goods, work-in-progress and stock-in-trade |
(11.370) |
(8.510) |
(36.862) |
|
|
(d)
Employee benefit expenses |
1038.843 |
1007.634 |
3037.702 |
|
|
(e)
Depreciation and amortisation expense |
147.171 |
140.048 |
429.596 |
|
|
(f) Other
expenses |
1387.487 |
1771.869 |
4938.585 |
|
|
Total expenses |
9376.475 |
9636.152 |
26951.508 |
|
3 |
Profit/(Loss) from Operations before Other
Income, finance cost & Exceptional Items (1 -2) |
761.273 |
796.595 |
2244.862 |
|
4 |
Other
Income |
229.105 |
75.406 |
370.692 |
|
5 |
Profit/ (Loss) from ordinary activities
before finance cost & Exceptional Items (3+4) |
990.378 |
872.001 |
2615.554 |
|
6 |
Finance
costs |
22.785 |
18.960 |
49.652 |
|
7 |
Profit/(Loss) from ordinary activities
after finance cost but before Exceptional Items (5-6) |
967.593 |
853.041 |
2565.902 |
|
8 |
Exceptional
Items |
-- |
-- |
-- |
|
9 |
Profit / (Loss) from Ordinary Activities before tax (7+ 8) |
967.593 |
853.041 |
2565.902 |
|
10 |
Tax Expense / (credit) |
301.143 |
551.368 |
1095.271 |
|
11 |
Net Profit / (Loss) after tax (9-10) |
666.450 |
301.673 |
1470.631 |
|
12 |
Paid-up
Equity Share Capital (Face value of Rs.2/-each) |
238.313 |
238.313 |
238.313 |
|
13 |
Earnings
per share (face value of Rs. 10/- each) - not annualised |
|
|
|
|
|
Basic and
Diluted EPS (Rs.) |
5.59 |
2.53 |
12.34 |
|
|
|
|
|
|
|
A |
PARTICULARS OF
SHAREHOLDING |
|
|
|
|
1 |
Public
shareholding : |
|
|
|
|
|
(a) Number of shares |
45300995 |
45300995 |
45300995 |
|
|
(b) Percentage of shareholding |
38.02% |
38.02% |
38.02% |
|
2 |
Promoters and
Promoter group shareholding : (a) Pledged /
Encumbered |
|
|
|
|
|
- Number of shares |
Nil |
Nil |
Nil |
|
|
- Percentage of shareholding (as a % of the total share holding of
promoter and promoter group) |
-- |
-- |
-- |
|
|
- Percentage of shareholding (as a % of the total share capital of the
Company) |
-- |
-- |
-- |
|
|
(b) Non Pledged
/ Non Encumbered |
|
|
|
|
|
- Number of shares |
73855305 |
73855305 |
73855305 |
|
|
- Percentage of shareholding (as a % of the total share holding of
promoter and promoter group) |
100.00% |
100.00% |
100.00% |
|
|
- Percentage of shareholding (as a % of the total share capital of the
Company) |
61.98% |
61.98% |
61.98% |
|
|
|
|
|
|
|
B |
INVESTOR COMPLAINTS [Nos.] |
3
months ended December 31, 2013 |
||
|
|
Pending at
the beginning of the quarter |
Nil |
||
|
|
Received
during the quarter |
4 |
||
|
|
Disposed
of during the quarter |
4 |
||
|
|
Remaining unresolved
at the end of the quarter |
Nil |
||
SEGMENTWISE REVENUE,
RESULTS AND CAPITAL EMPLOYED
(Rs. In Millions)
|
Sl. No. |
Particulars |
3 Months ended 31.12.2013 |
3
Months ended 30.09.2013 |
9
Months ended 31.12.2013 |
|
1 |
Segment Revenue |
(Unaudited) |
(Audited) |
(Unaudited) |
|
|
a Energy |
7670.679 |
7850.973 |
21857.907 |
|
|
b Environment |
2538.123 |
2684.329 |
7619.521 |
|
|
Total |
10208.802 |
10535.302 |
29477.428 |
|
|
Less: Inter
Segment Revenue |
71.054 |
102.555 |
281.058 |
|
|
Total Segment Income |
10137.748 |
10432.747 |
29196.370 |
|
|
|
|
|
|
|
2 |
Segment Results |
|
|
|
|
|
Profit/(Loss)
before Tax and Interest |
|
|
|
|
|
a Energy |
832.351 |
705.806 |
2486.273 |
|
|
b Environment |
58.563 |
232.173 |
514.836 |
|
|
Total |
890.915 |
937.979 |
3001.109 |
|
|
Less : Interest |
22.860 |
18.960 |
49.727 |
|
|
Less : Other Unallocable Expenditure net of unallocable income |
(99.539) |
65.978 |
385.480 |
|
|
Total Profit before Tax |
967.593 |
853.041 |
2565.902 |
|
|
|
|
|
|
|
3. |
Capital Employed |
|
|
|
|
|
a Energy |
1779.798 |
3388.895 |
1779.798 |
|
|
b Environment |
3403.052 |
2954.188 |
3403.052 |
|
|
c Unallocated |
14766.225 |
13085.954 |
14766.225 |
|
|
Total Capital Employed |
19949.075 |
19429.037 |
19949.075 |
Notes:
1. The above audited financial results, reviewed by the Audit Committee, were approved at the meeting of the Board of Directors held on January 21, 2014
2. The results for the quarter ended December 31, 2013 have undergone "Limited Review" by the statutory auditors of the company
3. Additional Information: Key unaudited financial parameters/figures (Consolidated) for the Thermax Group are as follows:
Rs. In Millions
|
Particular |
9 Months ended December 31, 2013 |
|
Total Income from operations |
35022.574 |
|
Profit Before Tax |
2580.206 |
|
Profit After Tax and minority interest |
1505.028 |
4. Pursuant to the Order dated 13th January 2014 of the Honourable Gujarat High Court to close all activities in twelve units of the Mundra SEZ pending receipt of Environment Clearance, the Company has suspended operations (which are not significant) in its facility in the said SEZ. The Company has filed a Special Leave Petition to the Supreme Court against the High Court Order.
5. For quarter ending September 2013 and nine months ending December 2013, tax expense includes Rs. 290.000 Millions (Rs. 347.500 Millions for Thermax Group for nine months ending December 2013) being provision made for estimated liability likely to arise upon its claim for deduction of certain business expenses being held inadmissible consequent to a survey u/s 133A of the Income Tax Act, conducted by the Income Tax Department in October 2013. Consequential order/ demand has not yet been received by the Company.
6. Previous periods' figures, including those related to segments, have been regrouped wherever necessary to conform to current periods' grouping.
FIXED ASSETS:
Tangible
- Land – Freehold
- Land – Leasehold
- Building
- Plant and Machinery
- Electrical Installation
- Office Equipment and Computer
- Furniture and Fixtures
- R and D Equipments
- Vehicles
Intangible
- Software
- Technical
Know How
AS PER WEBSITE DETAILS:
PRESS RELEASES:
'UNDERWEIGHT' RATING
ON THERMAX LIMITED, TARGET PRICE RS 512: BARCLAYS
Earnings performance has remained weak for Thermax Limited, even in the third quarter of FY14, with PAT of Rs 666.000 Millions, -13% y-o-y. This was led by a marginal decline in sales and more than a 170 bps fall in Ebitda margins.
The fall in margin was attributed to issues with orders in the environment (water) segment. Subsidiaries reported an overall loss of Rs 36.000 Millions in the third quarter due to continued losses at its EPC subsidiary — Thermax Instrumentation, TBWE JV and the subsidiary in China.
According to management, the HC order on Mundra SEZ may hit Q4 revenue by Rs 500.000-1000.000 Millions. We maintain ‘underweight’ rating and target price of Rs 512.
Order inflow on the standalone business was stable at Rs 13600.000 Millions, +6% y-o-y, with growth across all regular conventional segments (air pollution, cooling, chemicals and water) except the heating segment. There was no domestic captive power and EPC order win in the quarter. Management highlighted there is no BTG order in the pipeline.
Overall, the subsidiaries reported a loss of Rs 36.000 Millions, led by losses at Thermax Instrumentation and the Chinese subsidiary. Danstoker was profitable, while TBWE JV continued to make losses, with a Rs 120.000 Millions loss in Q3.
Management also highlighted that a part of the large petro chemical order will be executed at the TBWE JV facility. Environmental segment profitability was impacted by losses in the water segment and a decline in profit in the air pollution segment. A few medium-to-large-size orders have been delayed, leading to higher costs that have been booked in the current quarter.
NEW GOVT MUST ENSURE
MORE INVESTOR-FRIENDLY NORMS: THERMAX
MS Unnikrishnan feels the new government should bring policy-conducive environment to ease land acquisition. There’s a need to cut down on the number of clearances for projects and interest rates should be lowered to prop up the investment climate.
MD MS Unnikrishnan feels the new government needs to convey more investor-friendly norms. “The new government will have to make investors, both domestic and international, feel that India is a destination worth investing,” he said
He said the country’s fundamentals are right and we have got a fairly large market existence and good consumption. About 65-68 percent of the economy consists of domestic consumption, he said.
However, he thinks that investors need to be sure that there is policy support for their investment.
Thermax has been facing the brunt of the slowdown in the infrastructure space. The company’s order backlog has dipped by -13 percent CAGR from FY11-FY13. Thermax’s turnover has de-grown consistently for the past 8 quarters, including 4 quarters of double-digit de-growth. The company’s consolidated EBITDA margins have dipped from healthy levels of 12 percent in FY09 to 7 percent in 9MFY14E.
Unnikrishnan said the capital goods sector has seen 27 percent decline in order inflows. He feels the new government should bring policy-conducive environment to ease land acquisition. There’s a need to cut down on the number of clearances for projects and interest rates should be lowered to prop up the investment climate, he added.
Vinayak Chatterjee, Chairman of Feedback Infra said that despite the Cabinet Committee on Investments (CCI) having made announcement that they have clearing projects worth lakh Millionss, the corporate feedback indicates that projects have not yet started rolling, and are stuck at multiple levels.
He feels the new government can do a lot. “There are clutch of decision, action, imperative that are waiting to happen. So we are waiting for strong leadership to make that work such as setting up a ministry for infrastructure,” he said. Referring to the current way of functioning, he said:
“In Delhi today, there are 16 ministries that are directly involved with infrastructure development in the country. If you add on top of that Planning Commission, PMO and Cabinet Secretary including the CCI, you have got 19 different silos that are attacking the problem and then you multiply that by 29 state governments, who themselves will have another 16 departments under them. So, you have got an incredible matrix of a tangled web of permissions, clearances, logjams and that has been the single-most important item for discussion in the last two years of the UPA II.”
He feels the new government should create a dedicated ministry for infrastructure whose job would be to untangle and push the agenda.
Echoing his views, Unnikrishnan said India has six ministries for industry against one-ministry norm seen globally.
Year 2013 has been, in particular, a bad year for the infra sector. Economic slowdown, high current account and fiscal deficits, have severely constrained government’s ability to undertake fresh investment in the sector. Sectors like roads and power have suffered the most.
The earlier envisaged target of $1 trillion investment in infrastructure sector during 12th Five-Year Plan (2012-17) now seems difficult to achieve.
The road sector has been plagued by problems like delay in project clearances. Progress on national highway stretches awarded under BOT has almost got stalled.
For power sector, generation capacity continues to grow, but the availability of coal is a serious challenge.
THERMAX BAGS RS
2800.000 MILLIONS ORDER FOR POWER PLANT IN NE
Pune based Industrial energy solutions provider Thermax has won a Rs 2800.000 Millions EPC order for a combined cycle extension power project from a leading Government of India Enterprise in the North East.
The 2 x 24.5 MW project is part of the company’s process of converting its existing gas turbine based power plant into a combined cycle power plant by installing the bottoming cycle (utilising the waste heat from the exhaust of the gas turbine to generate additional power).
Scope of work for Thermax includes design, engineering, procurement, construction, installation and commissioning of the project on a turnkey basis.
The supply of equipment includes four heat recovery steam generators (HRSG’s) and two steam turbine generators (STG) complete with all auxiliaries and accessories, and is scheduled to be completed within 25 months.
Commenting on this, MS Unnikrishnan, MD and CEO, Thermax Limited said, “This order reinforces Thermax’s successful track record in EPC power projects and our leadership in building and commissioning captive power plants for industry.”
Till date, Thermax has contracted over 72 power projects on turnkey basis based on various fuels including domestic and imported coal, washery rejects, petcoke, waste heat from various processes, renewable energy including biomass and solar, waste gases, naptha and natural gas.
THERMAX
BAGS RS. 17000.000 MILLIONS ORDER FOR SUPPLY OF CFBC BOILERS
July 05,
2013
Energy and environment solutions provider Thermax Limited today said it has received an order worth Rs.17000.000 Millions from a leading petrochemical company for the design, manufacture and commissioning of 9 circulating fluidized bed combustion (CFBC) high pressure boilers.
All the 9 CFBC boilers will be of 500 TPH (tonnes per hour) each for two plants of the petrochemical company, Thermax said in a statement but did not name its client.
"The order was won against stiff global competition. The approximate order value is Rs. 17000.000 Millions, the single largest one from a client for deployment of CFBC boilers," it added.
Company's managing director and CEO M. S. Unnikrishnan said, "This order reflects the customer's confidence in Thermax's extensive experience with CFBC technology across India on a variety of low grade solid fuels, as also trust in our manufacturing and project execution capabilities."
The boilers, to be commissioned at client sites within a time frame of 25-29 months, will generate steam for process and power generation and they will use petcoke and coal as fuel, Thermax said.
Petcoke, essentially a refinery waste, has high heat value and low ash content, making it a cost-effective fuel. Using fourth generation CFBC technology, Thermax boilers will burn these multiple fuels to achieve high levels of temperature control and almost negligible down time for maintenance, it added.
Thermax offers integrated solutions in the areas of heating, cooling, power, water and waste management, air pollution control and chemicals. It has manufacturing facilities in India, China and Europe.
Shares of the company were trading at Rs. 610 apiece on the BSE at 1400 hours, up 3.05 per cent from its previous close.
THERMAX POSTS Q2 NET
OF RS. 300.000 MILLIONS
Pune: November 6,
2013
For the second quarter of fiscal 2013-14, Thermax Limited announced an operating revenue of Rs. 10430.000 Millions, down 12.5 % compared to Rs. 11920.000 Millions for the same period, the previous year. Net profit was down 66.9 % at Rs. 300.000 Millions from Rs. 910.000 Millions posted in the second quarter last year.
The company declared its net profits for the current quarter and for the half-year period after making a one-time provision of Rs. 290.000 Millions (Rs. 350.000 Millions for Thermax Group) on account of estimated tax liability expected due to likely inadmissibility of certain business expenses incurred in earlier years.
The company’s total operating revenue for the year’s first half (April- September) stood at Rs.19060.000 Millions, lower by 12.4% compared to Rs. 21760.000 Millions in 2012-13. Net profit of Rs. 800.000 Millions was 49.2% lower than last year’s Rs. 1580.000 Millions.
On a consolidated basis, total operating revenue of the Group for the half year was Rs. 22850.000 Millions compared to Rs. 25650.000 Millions last year. Net profit for the period was Rs.880.000 Millions (Rs.1400.000 Millions, last year).
As on September 30, 2013, Thermax Limited has an order backlog of Rs. 53080.000 Millions against Rs. 44120.000 Millions in September 2012. Compared to last year’s Rs. 49840.000 Millions, the Group order backlog stands at Rs. 61280.000 Millions. However, generally the market for capital goods continues to be sluggish.
ABOUT THERMAX LIMITED
Thermax Limited, a leading energy and environment solutions provider offers integrated, innovative solutions in the areas of heating, cooling, power, water and waste management, air pollution control and chemicals. The company has manufacturing facilities in India, China and Europe. The sustainable solutions Thermax develops for client companies are environment-friendly and enable efficient deployment of energy and water resources.
THERMAX BAGS RS.
17000.000 MILLIONS ORDER FOR SUPPLY OF CFBC BOILERS
Pune: July 5, 2013
Energy and environment major, Thermax Limited has received a prestigious order from a leading petrochemical company for the design, manufacture and commissioning of 9 CFBC (circulating fluidized bed combustion) high pressure boilers of 500 TPH each for two of its plants.
The order was won against stiff global competition. The approximate order value is Rs. 17000.000 Millions, the single largest one from a client for deployment of CFBC boilers.
Says M.S. Unnikrishnan, MD and CEO of Thermax, “This order reflects the customer’s confidence in Thermax’s extensive experience with CFBC technology across India on a variety of low grade solid fuels, as also trust in our manufacturing and project execution capabilities.”
The boilers, to be commissioned at client sites within a time frame of 25-29 months, will generate steam for process and power generation. They will use petcoke and coal as fuel. Petcoke, essentially a refinery waste, has high heat value and low ash content, making it a cost-effective fuel. Using fourth generation CFBC technology Thermax boilers will burn these multiple fuels to achieve high levels of temperature control and almost negligible down time for maintenance.
CMT REPORT (Corruption, Money Laundering & Terrorism]
The Public Notice information has been collected from various sources
including but not limited to: The Courts,
1] INFORMATION ON
DESIGNATED PARTY
No exist designating subject or any of its beneficial owners, controlling
shareholders or senior officers as terrorist or terrorist organization or whom
notice had been received that all financial transactions involving their assets
have been blocked or convicted, found guilty or against whom a judgement or
order had been entered in a proceedings for violating money-laundering,
anti-corruption or bribery or international economic or anti-terrorism sanction
laws or whose assets were seized, blocked, frozen or ordered forfeited for
violation of money laundering or international anti-terrorism laws.
2] Court Declaration :
No exist to suggest that subject is or was
the subject of any formal or informal allegations, prosecutions or other
official proceeding for making any prohibited payments or other improper payments
to government officials for engaging in prohibited transactions or with
designated parties.
3] Asset Declaration :
No records exist to suggest that the property or assets of the subject
are derived from criminal conduct or a prohibited transaction.
4] Record on Financial
Crime :
Charges or conviction
registered against subject: None
5] Records on Violation of
Anti-Corruption Laws :
Charges or
investigation registered against subject: None
6] Records on Int’l
Anti-Money Laundering Laws/Standards :
Charges or
investigation registered against subject: None
7] Criminal Records
No
available information exist that suggest that subject or any of its principals
have been formally charged or convicted by a competent governmental authority
for any financial crime or under any formal investigation by a competent
government authority for any violation of anti-corruption laws or international
anti-money laundering laws or standard.
8] Affiliation with
Government :
No record
exists to suggest that any director or indirect owners, controlling
shareholders, director, officer or employee of the company is a government
official or a family member or close business associate of a Government
official.
9] Compensation Package :
Our market
survey revealed that the amount of compensation sought by the subject is fair
and reasonable and comparable to compensation paid to others for similar
services.
10] Press Report :
No press reports / filings exists on
the subject.
CORPORATE GOVERNANCE
MIRA INFORM as part of its Due Diligence do provide comments on
Corporate Governance to identify management and governance. These factors often
have been predictive and in some cases have created vulnerabilities to credit
deterioration.
Our Governance Assessment focuses principally on the interactions
between a company’s management, its Board of Directors, Shareholders and other
financial stakeholders.
CONTRAVENTION
Subject is not known to have contravened any existing local laws,
regulations or policies that prohibit, restrict or otherwise affect the terms
and conditions that could be included in the agreement with the subject.
FOREIGN EXCHANGE RATES
|
Currency |
Unit
|
Indian Rupees |
|
US Dollar |
1 |
Rs.60.10 |
|
|
1 |
Rs.99.85 |
|
Euro |
1 |
Rs.82.58 |
INFORMATION DETAILS
|
Report Prepared
by : |
VRN |
SCORE & RATING EXPLANATIONS
|
SCORE FACTORS |
RANGE |
POINTS |
|
HISTORY |
1~10 |
8 |
|
PAID-UP CAPITAL |
1~10 |
7 |
|
OPERATING SCALE |
1~10 |
8 |
|
FINANCIAL CONDITION |
|
|
|
--BUSINESS SCALE |
1~10 |
8 |
|
--PROFITABILIRY |
1~10 |
6 |
|
--LIQUIDITY |
1~10 |
7 |
|
--LEVERAGE |
1~10 |
7 |
|
--RESERVES |
1~10 |
7 |
|
--CREDIT LINES |
1~10 |
7 |
|
--MARGINS |
-5~5 |
- |
|
DEMERIT POINTS |
|
|
|
--BANK CHARGES |
YES/NO |
YES |
|
--LITIGATION |
YES/NO |
YES |
|
--OTHER ADVERSE INFORMATION |
YES/NO |
NO |
|
MERIT POINTS |
|
|
|
--SOLE DISTRIBUTORSHIP |
YES/NO |
NO |
|
--EXPORT ACTIVITIES |
YES/NO |
NO |
|
--AFFILIATION |
YES/NO |
YES |
|
--LISTED |
YES/NO |
YES |
|
--OTHER MERIT FACTORS |
YES/NO |
YES |
|
DEFAULTER |
|
|
|
--RBI |
YES/NO |
NO |
|
--EPF |
YES/NO |
NO |
|
TOTAL |
|
65 |
This score serves as a reference to assess
SC’s credit risk and to set the amount of credit to be extended. It is calculated
from a composite of weighted scores obtained from each of the major sections of
this report. The assessed factors and their relative weights (as indicated
through %) are as follows:
Financial
condition (40%) Ownership
background (20%) Payment record
(10%)
Credit history
(10%) Market trend (10%) Operational size
(10%)
RATING EXPLANATIONS
|
RATING |
STATUS |
PROPOSED CREDIT LINE |
|
|
>86 |
Aaa |
Possesses an extremely sound financial base with the strongest capability
for timely payment of interest and principal sums |
Unlimited |
|
71-85 |
Aa |
Possesses adequate working capital. No caution needed for credit
transaction. It has above average (strong) capability for payment of interest
and principal sums |
Large |
|
56-70 |
A |
Financial & operational base are regarded healthy. General
unfavourable factors will not cause fatal effect. Satisfactory capability for
payment of interest and principal sums |
Fairly Large |
|
41-55 |
Ba |
Overall operation is considered normal. Capable to meet normal
commitments. |
Satisfactory |
|
26-40 |
B |
Capability to overcome financial difficulties seems comparatively
below average. |
Small |
|
11-25 |
Ca |
Adverse factors are apparent. Repayment of interest and principal sums
in default or expected to be in default upon maturity |
Limited with
full security |
|
<10 |
C |
Absolute credit risk exists. Caution needed to be exercised |
Credit not
recommended |
|
-- |
NB |
New Business |
-- |
This report is issued at your request without any
risk and responsibility on the part of MIRA INFORM PRIVATE LIMITED (MIPL)
or its officials.