MIRA INFORM REPORT
|
Report Date : |
05.04.2014 |
IDENTIFICATION DETAILS
|
Name : |
IPCA LABORATORIES LIMITED |
|
|
|
|
Registered
Office : |
48, Kandivali Industrial Estate, Kandivali (West), Mumbai - 400067,
Maharashtra |
|
|
|
|
Country : |
India |
|
|
|
|
Financials (as
on) : |
31.03.2013 |
|
|
|
|
Date of
Incorporation : |
19.10.1949 |
|
|
|
|
Com. Reg. No.: |
11-007837 |
|
|
|
|
Capital
Investment / Paid-up Capital : |
Rs.252.400
Millions |
|
|
|
|
CIN No.: [Company Identification
No.] |
L24239MH1949PLC007837 |
|
|
|
|
TAN No.: [Tax Deduction &
Collection Account No.] |
MUMI05234F |
|
|
|
|
PAN No.: [Permanent Account No.] |
AAACI1220M |
|
|
|
|
Legal Form : |
A Public Limited Liability Company. The Company’s Shares are Listed on
the Stock Exchanges. |
|
|
|
|
Line of Business
: |
Manufacturing and Selling of Pharmaceutical Products such as
Tablets/Capsules, Orals/Liquids, Injectables, Basic Drugs/Intermediates and
Psyllium Husk. |
|
|
|
|
No. of Employees
: |
10000 [Approximately] |
RATING & COMMENTS
|
MIRA’s Rating : |
A (67) |
|
RATING |
STATUS |
PROPOSED CREDIT LINE |
|
|
56-70 |
A |
Financial & operational base are regarded healthy. General
unfavourable factors will not cause fatal effect. Satisfactory capability for
payment of interest and principal sums |
Fairly Large |
|
Maximum Credit Limit : |
USD 62790000 |
|
|
|
|
Status : |
Good |
|
|
|
|
Payment Behaviour : |
Regular |
|
|
|
|
Litigation : |
Exist |
|
|
|
|
Comments : |
Subject is one of India’s largest suppliers of bulk drugs. It is an
old and well established company having good track record. It has recorded a better growth in the revenue earned from operations
during 2012. Profitability seems to be good. Financial position of the
company seems to be good. Trade relations are reported as trustworthy. Business is active.
Payments are reported to be regular and as per commitments. The company can be considered good for business dealings at usual
trade terms and conditions |
NOTES :
Any query related to this report can be made
on e-mail : infodept@mirainform.com
while quoting report number, name and date.
ECGC Country Risk Classification List – December 1, 2013
|
Country Name |
Previous Rating (30.09.2013) |
Current Rating (01.12.2013) |
|
India |
A1 |
A1 |
|
Risk Category |
ECGC
Classification |
|
Insignificant |
A1 |
|
Low |
A2 |
|
Moderate |
B1 |
|
High |
B2 |
|
Very High |
C1 |
|
Restricted |
C2 |
|
Off-credit |
D |
INDIAN ECONOMIC OVERVIEW
India’s current account deficit for the fiscal third quarter ended
September 2013 narrowed to $4.2 billion or 0.9 % of the gross domestic product
from $31.9 billion or 6.5 % of GDP a year earlier, thanks to a pick-up in exports
and moderation in gold imports. Manufacturing activity and new orders in India
showed their strongest growth in a year in February. The news comes as a relief
after data showed Asia’s third largest economy grew by a slower-than-expected
4.7 % annually in the three months through December. The HSBC Manufacturing
Purchasing Managers’ Index which gauges the business activity of India’s
factories but not its’ utilities, rose to 52.5 in February, its highest in a
year from 51.4 in January. Overall new orders for factory goods which rose to a
one-year high of 54.9 contributed to the surge. China has emerged as India’s
biggest trading partner in the current financial year replacing the United Arab
Emirates and pushing it to the third spot. India-China trade has reached $49.5
billion with a 8.7 % share in India’s total trade. The US comes second at $46
billion with 8.1 % share during the first nine months of the current financial
year.
The Reserve Bank of India has granted an additional nine months to the
public to exchange currency notes printed before 2005 including Rs 500 and Rs
1,000 denominations, pushing the deadline to January 1, 2015. A day before
dates for the Lok Sabha polls were announced, the government decided to hike
interest rates on fixed deposit schemes offered by post offices up to 0.2 per
cent. The new rates will be effective April, 1. The Supreme Court will resume
hearing on March, 11 Nokia’s appeal against a ruling over transferring
ownership of its local mobile phones plant which is the subject of a tax
dispute to Microsoft Corp.
In the last days of the current Government, another scam has surfaced.
The defence ministry has ordered a probe into Hindustan Aeronautics Limited’s contracts
from Britain’s Rolls-Royce Holdings worth at least $ 1.2 billion. The Central
Bureau of Investigation will look into allegations that over $80 million was
paid in kickbacks in a deal signed in 2011. India has asked Boeing Co. to
find a solution for problems with state-owned Air India’s 787 Dreamliners. The
aircraft has experienced a series of malfunctions since its debut in 2011.
EXTERNAL AGENCY RATING
|
Rating Agency Name |
CRISIL |
|
Rating |
AA [Long Term] |
|
Rating Explanation |
High degree of safety and very low credit risk. |
|
Date |
10.10.2013 |
RBI DEFAULTERS’ LIST STATUS
Subject’s name is not enlisted as a defaulter
in the publicly available RBI Defaulters’ list.
EPF (Employee Provident Fund) DEFAULTERS’ LIST STATUS
Subject’s name is not enlisted as a defaulter
in the publicly available EPF (Employee Provident Fund) Defaulters’ list as of
31-03-2012.
INFORMATION
DECLINED BY
|
Name : |
Ms. Tanuja |
|
Designation : |
Accountant |
|
Contact No.: |
91-22-66474193 |
LOCATIONS
|
Registered Office/ International Division : |
48, Kandivli Industrial Estate, Kandivali (West), Mumbai - 400067,
Maharashtra, India |
|
Tel No.: |
91-22-66474444 |
|
Fax No.: |
91-22-28686613 |
|
E-Mail : |
|
|
Website : |
|
|
|
|
|
Corporate Office : |
142 AB, Kandivli Co-operative Industrial Estate Limited,
Kandivli (West), Mumbai – 400067, Maharashtra, India |
|
Tel No.: |
91-22- 66474747 |
|
Fax No.: |
91-22- 66474757/ 28686954 |
|
|
|
|
Domestic Marketing : |
IPCA House, 63-E, Kandivli Co-operative Industrial Estate Limited,
Kandivli (West), Mumbai – 400067, Maharashtra, India |
|
Te. No. : |
91-22-66474222 |
|
Fax. No. : |
91-22-66474114 |
|
|
|
|
Research and Development Center : |
123-AB, 125 and 126,
Kandivali Industrial Estate, Kandivali (West), Mumbai – 400067, Maharashtra,
India |
|
Tel No.: |
91-22-28684787/
2867/ 28683589/ 28674518/ 66474755 |
|
Fax No.: |
91-22-28683589/
66474757 |
|
|
|
|
Plant : |
P. O. Sejavata, Ratlam – 457002, Madhya Pradesh, India Tel. No.: 91-7412-278000 Fax No.: 91-7412-279083 Plot No. 89-A-D/90/91, Industrial Estate, Pologround, Tel. No.: 91-731-2421172/2081 Fax No.: 91-731-2422082 Plot No, 69 to 72 (B), Sector II, Kandla Free Trade Zone, Gandhidham - 370230, Gujarat, India Tel. No.: 91-2836-252385/389 Fax No.: 91-2836-252313 4722, GIDC Industrial Estate, Ankleshwar – 393002, Tel. No.: 91-2646-220594 Fax No.: 91-2246-250435 23-24, GIDC Industrial Estate, Nandesari – 391340, Tel. No.: 91-265-2840795 Fax No.: 91-265-2840868 Plot No, 255/1, Village Athal, Sllvassa - 396230, Dadra and Nagar Haveli (U.T.), India Tel. No.: 91-260-2640301 Fax No.: 91-260-2640303 Plot No. 65 and 99, Danudyog Industrial Estate, Silvassa - 396230, Dadra and Nagar Haveli (U.T.), India Tel. No.: 91-260-2640850 Fax No.: 91-260-2640646 H-4, MIDC, Waluj, Aurangabad - 431136, Maharashtra, India Tel. No.: 91-240-2564993 Fax No.: 91-240-2564113 C-6, Sara Industrial Estate, Chakrata Road, Rampur, Dehradun - 248197, Uttarakhand, India Tel. No.: 91-135-6542228 Fax No.: 91-135-2728766 Plot No. 393/394, Melli Jorethang Road, Gom Block, Bharikhola, South
District Sikkim - 737121 Tel. No.: 91-3595-276372 Fax No.: 91-3595-276372 C 89 to C 95, MIDC, Waluj Industrial Area, Aurangabad-431136,
Maharashtra, India Tel No.: 91-2145-232058 Fax No.: 91-2145-232055 |
|
|
|
|
Depots : |
Located At:
|
DIRECTORS
AS ON 31.03.2013
|
Name : |
Mr. Premchand
Godha |
|
Designation : |
Chairman and
Managing Director |
|
|
|
|
Name : |
Mr. Ajit Kumar Jain |
|
Designation : |
Joint Managing
Director |
|
|
|
|
Name : |
Mr. Pranay Godha |
|
Designation : |
Executive
Director |
|
|
|
|
Name : |
Mr. Prashant
Godha |
|
Designation : |
Executive
Director |
|
|
|
|
Name : |
Mr. Ramappa S.
Hugar |
|
Designation : |
Director |
|
|
|
|
Name : |
Mr. Madhukar R.
Chandurkar |
|
Designation : |
Director |
|
|
|
|
Name : |
Mr. Babulal Jain |
|
Designation : |
Director |
|
Qualification |
C. A. |
|
|
|
|
Name : |
Dr. V. V. Subba
Rao |
|
Designation : |
Director |
|
Qualification |
Science Post
Graduate in Chemistry and Ph.D. |
|
|
|
|
Name : |
Mr. Anand T.
Kurse |
|
Designation : |
Director |
|
|
|
|
Name : |
Mr. Dev Prakash
Yadava |
|
Designation : |
Director |
|
|
|
|
Name : |
Dr. Ramakanta
Panda |
|
Designation : |
Director |
KEY EXECUTIVES
|
Name : |
Mr. Jeevan L.
Nagori |
|
Designation : |
President –
Operation |
|
|
|
|
Name : |
Dr. Ashok Kumar |
|
Designation : |
President - R and
D Chemicals |
|
|
|
|
Name : |
Mr. N. Guhaprasad |
|
Designation : |
President - International Marketing ( Branded Formulations) |
|
|
|
|
Name : |
Dr. Anil Pareek |
|
Designation : |
President –
Medical Affairs and Clinical Research |
|
|
|
|
Name : |
Mr. Sunil Ghai |
|
Designation : |
President – Domestic Marketing |
|
|
|
|
Name : |
Harish P. Kamath |
|
Designation : |
Senior Vice President – Legal and Company Secretary |
|
|
|
|
Audit
Committee : |
|
|
Name : |
Mr. Babulal Jain Dr. V. V. Subba Rao Mr. Anand T. Kusre Mr. Prashant Godha |
MAJOR SHAREHOLDERS / SHAREHOLDING PATTERN
AS ON 31.12.2013
|
Category of Shareholder |
Total No. of Shares |
Total Shareholding as a % of Total No. of Shares |
|
(A) Shareholding of Promoter and Promoter
Group |
|
|
|
|
|
|
|
|
10497946 |
8.32 |
|
|
47413180 |
37.57 |
|
|
57911126 |
45.89 |
|
|
|
|
|
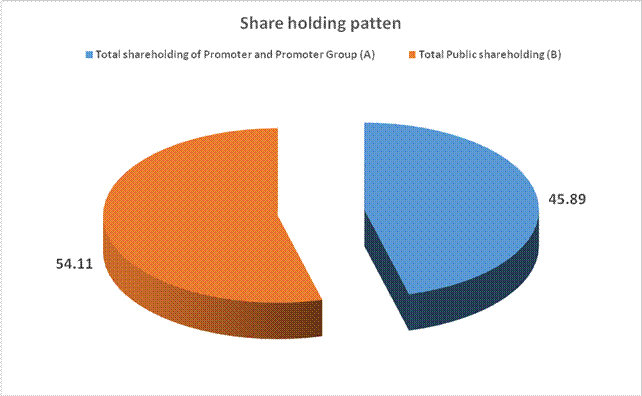
Total shareholding of Promoter and Promoter
Group (A) |
57911126 |
45.89 |
|
(B) Public Shareholding |
|
|
|
|
|
|
|
|
14927419 |
11.83 |
|
|
183510 |
0.15 |
|
|
32079793 |
25.42 |
|
|
47190722 |
37.39 |
|
|
|
|
|
|
6580050 |
5.21 |
|
|
|
|
|
|
12241606 |
9.70 |
|
|
1526587 |
1.21 |
|
|
749018 |
0.59 |
|
|
67952 |
0.05 |
|
|
9557 |
0.01 |
|
|
155065 |
0.12 |
|
|
516444 |
0.41 |
|
|
21097261 |
16.72 |
|
Total Public shareholding (B) |
68287983 |
54.11 |
|
Total (A)+(B) |
126199109 |
100.00 |
|
(C) Shares held by Custodians and against which
Depository Receipts have been issued |
0 |
0.00 |
|
|
0 |
0.00 |
|
|
0 |
0.00 |
|
|
0 |
0.00 |
|
Total (A)+(B)+(C) |
126199109 |
0.00 |
BUSINESS DETAILS
|
Line of Business : |
Manufacturing and Selling of Pharmaceutical Products such as
Tablets/Capsules, Orals/Liquids, Injectables, Basic Drugs/Intermediates and Psyllium
Husk. |
|
|
|
|
Terms : |
|
|
Selling : |
LC / Cash and Credit |
|
|
|
|
Purchasing : |
LC / Cash and Credit |
PRODUCTION STATUS [AS ON 31.03.2011]
|
Particulars |
Unit |
Installed Capacity |
Actual Production |
|
Tablets/
Capsules |
Lacs |
166090 |
129086 |
|
Orals/Liquids |
Lacs |
238 |
420 |
|
Injectables |
Lacs |
138 |
582 |
|
Basic Drugs/
Intermediates |
Tones |
4380 |
3814 |
NOTES
a)
As the industrial licensing in respect of drugs and
pharmaceuticals produced by the Company has been abolished under the Industrial
Policy, the particulars of licensed capacity are not stated.
b)
Installed capacity, being of a technical nature is
not verified by the Auditors.
c)
Production of basic drugs/intermediates includes
1459 tonnes (Previous year 1088 tonnes) used for captive consumption.
d)
Production includes production under contract
manufacturing.
e) Previous year’s
figures are given in bracket.
GENERAL INFORMATION
|
Suppliers : |
Not Divulged |
||||||||||||||||||||||||||||||||||||||||||||||||||||||||||||||||||||||||||||||||||||||||||||||||||||||||||||||||||||||||||||||||||
|
|
|
||||||||||||||||||||||||||||||||||||||||||||||||||||||||||||||||||||||||||||||||||||||||||||||||||||||||||||||||||||||||||||||||||
|
Customers : |
Not Divulged |
||||||||||||||||||||||||||||||||||||||||||||||||||||||||||||||||||||||||||||||||||||||||||||||||||||||||||||||||||||||||||||||||||
|
|
|
||||||||||||||||||||||||||||||||||||||||||||||||||||||||||||||||||||||||||||||||||||||||||||||||||||||||||||||||||||||||||||||||||
|
No. of Employees : |
10000 [Approximately] |
||||||||||||||||||||||||||||||||||||||||||||||||||||||||||||||||||||||||||||||||||||||||||||||||||||||||||||||||||||||||||||||||||
|
|
|
||||||||||||||||||||||||||||||||||||||||||||||||||||||||||||||||||||||||||||||||||||||||||||||||||||||||||||||||||||||||||||||||||
|
Bankers : |
|
||||||||||||||||||||||||||||||||||||||||||||||||||||||||||||||||||||||||||||||||||||||||||||||||||||||||||||||||||||||||||||||||||
|
|
|
||||||||||||||||||||||||||||||||||||||||||||||||||||||||||||||||||||||||||||||||||||||||||||||||||||||||||||||||||||||||||||||||||
|
Facilities : |
|||||||||||||||||||||||||||||||||||||||||||||||||||||||||||||||||||||||||||||||||||||||||||||||||||||||||||||||||||||||||||||||||||
|
|||||||||||||||||||||||||||||||||||||||||||||||||||||||||||||||||||||||||||||||||||||||||||||||||||||||||||||||||||||||||||||||||||
|
|
|
|
Banking
Relations : |
-- |
|
|
|
|
Auditors : |
|
|
Name : |
Natvarlal Vepari and Company Chartered Accountants |
|
|
|
|
Cost Auditors : |
|
|
Name : |
ABK and Associates Chartered Accountants |
|
|
|
|
Entities Where Control Exists: |
Kaygee Investments Private Limited |
|
|
|
|
Associates : |
|
|
|
|
|
Other Related Parties : |
|
CAPITAL STRUCTURE
AS ON 31.03.2013
Authorised Capital :
|
No. of Shares |
Type |
Value |
Amount |
|
285000000 |
Equity Shares |
Rs.2/- each |
Rs.570.000 Millions |
Issued Capital :
|
No. of Shares |
Type |
Value |
Amount |
|
127480204 |
Equity Shares |
Rs.2/- each |
Rs.255.000
Millions |
Subscribed & Paid-up Capital :
|
No. of Shares |
Type |
Value |
Amount |
|
126199109 |
Equity Shares |
Rs.2/- each |
Rs.252.400
Millions |
NOTES:
OF THE ABOVE:
a) Aggregate
Shares issued under Employees Stock Option Scheme (ESOS): 21,57,500 Equity
Shares of Rs. 2/- each (Previous year 21,08,750 Equity Shares)
b) Equity Share of
Rs. 10/- each have been sub-divided into five equity shares of Rs. 2/- each
pursuant to the resolution passed by the shareholders at the Extra Ordinary
General Meeting held on 25th February,2010
c) 53,210 Equity
Shares of Rs. 10/- each in 2009-10 and 2,03,009 Equity Shares of Rs. 10/- each
in 2008-09 have been extinguished under Buy back Scheme.
d) 3,22,704 Equity
shares of Rs. 2/- each of the Company have been issued under the scheme of
amalgamation of Tonira Pharma Limited with the Company.
RECONCILIATION OF SHARES:
|
PARTICULARS |
AS ON 31.03.2013 |
|
|
|
NO. OF SHARES |
RS. IN MILLIONS |
|
Shares outstanding at the beginning of the
year |
125827655 |
25.17 |
|
Shares Issued during the year |
371454 |
0.07 |
|
Shares outstanding
at the end of the year |
126199109 |
25.24 |
DETAILS OF SHAREHOLDING IN EXCESS OF 5%
|
PARTICULARS |
AS ON 31.03.2013 |
|
|
|
NO. OF SHARES |
% |
|
Kaygee Investments Private Limited |
27018195 |
21.41 |
|
HDFC Trustee Company Limited |
8930656 |
7.08 |
|
Exon Laboratories Private Limited |
8101000 |
6.42 |
|
Chandurkar Investments Private Limited |
6978005 |
5.53 |
RIGHTS AND
OBLIGATIONS OF SHAREHOLDERS:
The Company has only
one class of share referred as Equity shares having a par value of Rs. 2/- per
share. Each holder of equity shares is entitled to one vote per share. In the
event of liquidation of the Company, the holders of equity shares will be
entitled to receive remaining assets of the Company, after payment of external
liabilities. The distribution will be in proportion to the number of equity
shares held by the shareholders.
FINANCIAL DATA
[all figures are
in Rupees Millions]
ABRIDGED BALANCE
SHEET
|
SOURCES
OF FUNDS |
31.03.2013 |
31.03.2012 |
31.03.2011 |
|
I.
EQUITY
AND LIABILITIES |
|
|
|
|
(1)Shareholders' Funds |
|
|
|
|
(a) Share Capital |
252.400 |
252.300 |
251.400 |
|
(b) Reserves & Surplus |
15446.100 |
12370.400 |
10287.200 |
|
(c) Money received
against share warrants |
0.000 |
0.000 |
0.000 |
|
|
|
|
|
|
(2) Share
Application money pending allotment |
0.000 |
0.000 |
0.000 |
|
Total Shareholders’ Funds (1) + (2) |
15698.500 |
12622.700 |
10538.600 |
|
|
|
|
|
|
(3) Non-Current
Liabilities |
|
|
|
|
(a) long-term
borrowings |
3662.100 |
3301.800 |
1946.200 |
|
(b) Deferred tax liabilities (Net) |
1303.900 |
930.900 |
807.300 |
|
(c) Other long term
liabilities |
4.000 |
5.900 |
16.600 |
|
(d) long-term
provisions |
122.100 |
87.200 |
53.400 |
|
Total Non-current
Liabilities (3) |
5092.100 |
4325.800 |
2823.500 |
|
|
|
|
|
|
(4) Current Liabilities |
|
|
|
|
(a) Short
term borrowings |
1571.400 |
2013.600 |
2633.500 |
|
(b) Trade
payables |
2654.600 |
2307.100 |
1770.500 |
|
(c) Other
current liabilities |
1651.800 |
1745.600 |
998.900 |
|
(d) Short-term
provisions |
419.100 |
285.700 |
366.600 |
|
Total Current
Liabilities (4) |
6296.900 |
6352.000 |
5769.500 |
|
|
|
|
|
|
TOTAL |
27087.500 |
23300.500 |
19131.600 |
|
|
|
|
|
|
II.
ASSETS |
|
|
|
|
(1) Non-current assets |
|
|
|
|
(a) Fixed
Assets |
|
|
|
|
(i)
Tangible assets |
10526.700 |
9085.200 |
6946.500 |
|
(ii)
Intangible Assets |
226.600 |
43.000 |
31.700 |
|
(iii)
Capital work-in-progress |
1209.900 |
884.500 |
881.600 |
|
(iv) Intangible assets under development |
81.800 |
60.600 |
65.900 |
|
(b) Non-current
Investments |
217.900 |
426.500 |
487.900 |
|
(c) Deferred tax
assets (net) |
0.000 |
0.000 |
0.000 |
|
(d) Long-term Loan and Advances |
881.600 |
763.600 |
372.400 |
|
(e) Other
Non-current assets |
95.000 |
71.300 |
26.800 |
|
Total Non-Current
Assets |
13239.500 |
11334.700 |
8812.800 |
|
|
|
|
|
|
(2) Current assets |
|
|
|
|
(a)
Current investments |
1.500 |
1.500 |
1.500 |
|
(b)
Inventories |
7333.400 |
6639.800 |
4625.100 |
|
(c) Trade
receivables |
4159.300 |
3409.100 |
3698.700 |
|
(d) Cash
and cash equivalents |
546.600 |
92.500 |
84.400 |
|
(e)
Short-term loans and advances |
496.400 |
336.600 |
609.200 |
|
(f) Other
current assets |
1310.800 |
1486.300 |
1299.900 |
|
Total
Current Assets |
13848.000 |
11965.800 |
10318.800 |
|
|
|
|
|
|
TOTAL |
27087.500 |
23300.500 |
19131.600 |
PROFIT & LOSS
ACCOUNT
|
|
PARTICULARS |
31.03.2013 |
31.03.2012 |
31.03.2011 |
|
|
|
SALES |
|
|
|
|
|
|
|
Income |
27784.200 |
23300.600 |
18811.000 |
|
|
|
Other Income |
186.600 |
129.200 |
85.100 |
|
|
|
TOTAL (A) |
27970.800 |
23429.800 |
18896.100 |
|
|
|
|
|
|
|
|
Less |
EXPENSES |
|
|
|
|
|
|
|
Cost of Materials Consumed |
10447.500 |
8714.300 |
7216.200 |
|
|
|
Purchases of Stock-in-Trade |
1060.800 |
1008.800 |
946.400 |
|
|
|
Employee Benefit Expenses |
3765.700 |
3222.000 |
2615.900 |
|
|
|
Other Expenses |
6895.000 |
5871.100 |
4762.100 |
|
|
|
Foreign Exchange (Gain)/Loss Net |
632.800 |
527.900 |
(433.400) |
|
|
|
Changes in inventories of finished goods, work-in-progress and
Stock-in-Trade |
(597.700) |
(650.400) |
(486.900) |
|
|
|
TOTAL (B) |
22204.100 |
18693.700 |
14620.300 |
|
|
|
|
|
|
|
|
Less |
PROFIT
/ (LOSS) BEFORE INTEREST, TAX, DEPRECIATION AND AMORTISATION (A-B) (C) |
5766.700 |
4736.100 |
4275.800 |
|
|
|
|
|
|
|
|
|
Less |
FINANCIAL
EXPENSES (D) |
313.000 |
393.600 |
284.500 |
|
|
|
|
|
|
|
|
|
|
PROFIT
/ (LOSS) BEFORE TAX, DEPRECIATION AND AMORTISATION (C-D) (E) |
5453.700 |
4342.500 |
3991.300 |
|
|
|
|
|
|
|
|
|
Less/ Add |
DEPRECIATION/
AMORTISATION (F) |
840.000 |
653.100 |
554.300 |
|
|
|
|
|
|
|
|
|
|
PROFIT / (LOSS)
BEFORE TAX (E-F) (G) |
4613.700 |
3689.400 |
3437.000 |
|
|
|
|
|
|
|
|
|
Less |
TAX (H) |
1299.800 |
887.700 |
883.300 |
|
|
|
|
|
|
|
|
|
|
PROFIT / (LOSS)
AFTER TAX (G-H) (I) |
3313.900 |
2801.700 |
2553.700 |
|
|
|
|
|
|
|
|
|
Add |
PREVIOUS
YEARS’ BALANCE BROUGHT FORWARD |
2768.900 |
1462.400 |
1527.000 |
|
|
Add |
ADDITION ON
AMALGAMATION ON TONIRA PHARMA LIMITED |
0.000 |
43.100 |
0.000 |
|
|
|
|
|
|
|
|
|
Less |
APPROPRIATIONS |
|
|
|
|
|
|
|
Transfer to General Reserve |
1755.000 |
1000.000 |
2000.000 |
|
|
|
Transfer to Debenture Redemption Reserve |
0.000 |
70.000 |
150.000 |
|
|
|
Interim dividend |
252.300 |
251.500 |
251.300 |
|
|
|
Tax on Interim dividend |
40.900 |
40.800 |
41.700 |
|
|
|
Proposed final dividend |
252.400 |
151.400 |
150.800 |
|
|
|
Tax on Proposed Dividend |
42.900 |
24.600 |
24.500 |
|
|
BALANCE CARRIED
TO THE B/S |
3739.300 |
2768.900 |
1462.400 |
|
|
|
|
|
|
|
|
|
|
EARNINGS IN
FOREIGN CURRENCY |
|
|
|
|
|
|
|
FOB Value of Exports |
16670.200 |
13533.600 |
NA |
|
|
|
Interest |
0.100 |
12.000 |
NA |
|
|
|
Other Service Charges |
95.700 |
63.500 |
NA |
|
|
TOTAL EARNINGS |
16766.000 |
13609.100 |
NA |
|
|
|
|
|
|
|
|
|
|
IMPORTS |
|
|
|
|
|
|
|
Raw Materials |
3662.800 |
3732.000 |
NA |
|
|
|
Packing Materials |
25.300 |
21.800 |
NA |
|
|
|
Traded Goods |
63.000 |
88.200 |
NA |
|
|
|
Capital Goods |
410.400 |
529.700 |
NA |
|
|
|
Stores and Machine Components |
35.300 |
34.300 |
NA |
|
|
|
Others |
23.800 |
24.500 |
NA |
|
|
TOTAL IMPORTS |
4220.600 |
4430.500 |
NA |
|
|
|
|
|
|
|
|
|
|
Earnings /
(Loss) Per Share (Rs.) |
|
|
|
|
|
|
- Basic |
26.27 |
22.23 |
21.15 |
|
|
|
- Diluted |
26.27 |
22.22 |
20.35 |
|
QUARTERLY RESULTS
|
PARTICULARS |
30.06.2013 |
30.09.2013 |
31.12.2013 |
|
Net Sales |
8055.600 |
8467.000 |
8329.500 |
|
Total Expenditure |
6825.000 |
6520.800 |
6180.300 |
|
PBIDT (Excl OI) |
1230.600 |
1946.200 |
2149.200 |
|
Other Income |
44.500 |
53.300 |
54.200 |
|
Operating Profit |
1275.100 |
1999.500 |
2203.400 |
|
Interest |
71.300 |
57.300 |
54.400 |
|
Exceptional Items |
0.000 |
0.000 |
0.000 |
|
PBDT |
1203.800 |
1942.200 |
2149.000 |
|
Depreciation |
241.100 |
252.200 |
255.800 |
|
Profit Before Tax |
962.700 |
1690.000 |
1893.200 |
|
Tax |
245.000 |
395.500 |
502.000 |
|
Provisions and contingencies |
0.000 |
0.000 |
0.000 |
|
Profit After Tax |
717.700 |
1294.500 |
1391.200 |
|
Extraordinary Items |
0.000 |
0.000 |
0.000 |
|
Net Profit |
717.700 |
1294.500 |
1391.200 |
KEY RATIOS
|
PARTICULARS |
|
31.03.2013 |
31.03.2012 |
31.03.2011 |
|
PAT / Total Income |
(%) |
11.85
|
11.95 |
13.51 |
|
|
|
|
|
|
|
Net Profit Margin (PBT/Sales) |
(%) |
16.61
|
15.83 |
18.27 |
|
|
|
|
|
|
|
Return on Total Assets (PBT/Total Assets} |
(%) |
18.04
|
16.82 |
19.42 |
|
|
|
|
|
|
|
Return on Investment (ROI) (PBT/Networth) |
|
0.29
|
0.29 |
0.33 |
|
|
|
|
|
|
|
Debt Equity Ratio (Total Debt/Networth) |
|
0.33
|
0.42 |
0.43 |
|
|
|
|
|
|
|
Current Ratio (Current Asset/Current Liability) |
|
2.20
|
1.88 |
1.79 |
FINANCIAL ANALYSIS
[all figures are in
Rupees Millions]
DEBT EQUITY RATIO
|
Particular |
31.03.2011 |
31.03.2012 |
31.03.2013 |
|
|
(Rs. In Millions) |
(Rs. In Millions) |
(Rs. In Millions) |
|
Share Capital |
251.400 |
252.300 |
252.400 |
|
Reserves & Surplus |
10287.200 |
12370.400 |
15446.100 |
|
Net worth |
10,538.600 |
12,622.700 |
15,698.500 |
|
|
|
|
|
|
long-term borrowings |
1946.200 |
3301.800 |
3662.100 |
|
Short term borrowings |
2633.500 |
2013.600 |
1571.400 |
|
Total borrowings |
4,579.700 |
5,315.400 |
5,233.500 |
|
Debt/Equity ratio |
0.435 |
0.421 |
0.333 |
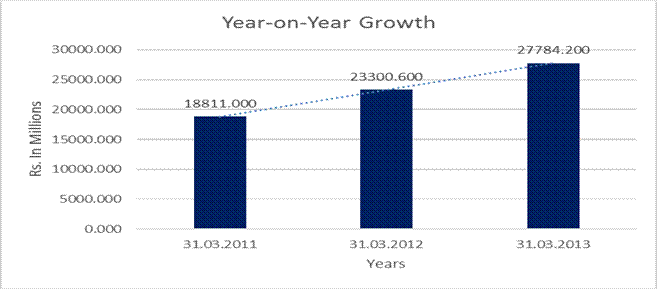
YEAR-ON-YEAR GROWTH
|
Year on Year Growth |
31.03.2011 |
31.03.2012 |
31.03.2013 |
|
|
(Rs. In Millions) |
(Rs. In Millions) |
(Rs. In Millions) |
|
Sales |
18811.000 |
23300.600 |
27784.200 |
|
|
|
23.867 |
19.242 |
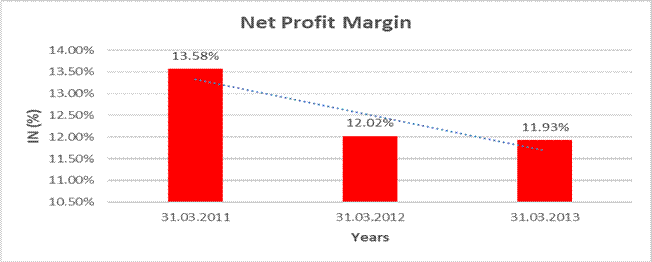
NET PROFIT MARGIN
|
Net Profit Margin |
31.03.2011 |
31.03.2012 |
31.03.2013 |
|
|
(Rs. In Millions) |
(Rs. In Millions) |
(Rs. In Millions) |
|
Sales |
18811.000 |
23300.600 |
27784.200 |
|
Profit |
2553.700 |
2801.700 |
3313.900 |
|
|
13.58% |
12.02% |
11.93% |
LOCAL AGENCY FURTHER INFORMATION
|
Sr. No. |
Check List by
Info Agents |
Available in
Report (Yes / No) |
|
1] |
Year of Establishment |
Yes |
|
2] |
Locality of the firm |
Yes |
|
3] |
Constitutions of the firm |
Yes |
|
4] |
Premises details |
No |
|
5] |
Type of Business |
Yes |
|
6] |
Line of Business |
Yes |
|
7] |
Promoter's background |
No |
|
8] |
No. of employees |
Yes |
|
9] |
Name of person contacted |
Yes |
|
10] |
Designation of contact person |
Yes |
|
11] |
Turnover of firm for last three years |
Yes |
|
12] |
Profitability for last three years |
Yes |
|
13] |
Reasons for variation <> 20% |
-- |
|
14] |
Estimation for coming financial year |
No |
|
15] |
Capital in the business |
Yes |
|
16] |
Details of sister concerns |
Yes |
|
17] |
Major suppliers |
No |
|
18] |
Major customers |
No |
|
19] |
Payments terms |
Yes |
|
20] |
Export / Import details (if applicable) |
No |
|
21] |
Market information |
-- |
|
22] |
Litigations that the firm / promoter involved in |
Yes |
|
23] |
Banking Details |
Yes |
|
24] |
Banking facility details |
Yes |
|
25] |
Conduct of the banking account |
-- |
|
26] |
Buyer visit details |
-- |
|
27] |
Financials, if provided |
Yes |
|
28] |
Incorporation details, if applicable |
Yes |
|
29] |
Last accounts filed at ROC |
Yes |
|
30] |
Major Shareholders, if available |
Yes |
|
31] |
PAN of Proprietor/Partner/Director, if available |
No |
|
32] |
Date
of Birth of Proprietor/Partner/Director, if available |
Yes |
|
33] |
Voter ID No of Proprietor/Partner/Director, if available |
No |
|
34] |
External Agency Rating, if available |
Yes |
|
CASE DETAILS BENCH: BOMBAY PRESENTATION DATE: 14/06/2013 STAMP NO.:- WPST/16213/2013
FILING DATE:- 14/06/2013
REG. NO.:- WP/5429/2013 REG. DATE:- 25/06/2013 PETITIONER:- KRANTIKARI KAMGAR UNION RESPONDENT:- IPCA
LABORATORIES LIMITED PETN. ADV.:- JANE COX
RESP.ADV.:- R.V. PARANJPE DISTRICT:- DDR-NGR-HVL@SILVASA BENCH:- SINGLE STATUS:- PRE-ADMISSION NEXT DATE:- 21/09/2013 STAGE:- PETITIONS FOR ADMISSION
- FRESH [CIVIL SIDE MATTERS] CORAM:- ACCORDING TO SITTING LIST LAST DATE:- 31/07/2013 STAGE:- PETITIONS FOR ADMISSION - FRESH [CIVIL SIDE
MATTERS] LAST CORAM:- HON'BLE SHRI JUSTICE K. K. TATED ACT: - INDUSTRIAL DISPUTE ACT, 1947. |
INDEX OF CHARGES:
|
S.
No. |
Charge
ID |
Date
of Charge Creation/Modification |
Charge
amount secured |
Charge
Holder |
Address |
Service
Request Number (SRN) |
|
1 |
10425025 |
03/05/2013 |
7,900,000,000.00 |
IDBI
TRUSTEESHIP SERVICES LIMITED |
ASIAN
BUILDING, GROUND FLOOR, 17 R KAMANI MARG,, |
B74905605 |
|
2 |
10410282 |
15/02/2013 |
1,103,840,000.00 |
HSBC
BANK(MAURITIUS) LIMITED |
6TH
FLOOR, HSBC CENTRE, 18, CYBER CITY, EBENE, MAURITIUS, - 00, MAURITIUS |
B70253190 |
|
3 |
10397485 |
14/02/2013
* |
200,000,000.00 |
IDBI
TRUSTEESHIP SERVICES LIMITED |
ASIAN
BUILDING, GROUND FLOOR, 17 R KAMANI MARG,, |
B69152189 |
|
4 |
10323062 |
19/12/2011
* |
500,000,000.00 |
IDBI
TRUSTEESHIP SERVICES LIMITED |
ASIAN
BUILDING, GROUND FLOOR, 17 R KAMANI MARG,, |
B28289064 |
|
5 |
10323188 |
18/11/2011 |
900,000,000.00 |
HSBC
BANK(MAURITIUS) LIMITED |
6TH
FLOOR, HSBC CENTRE, 18, CYBER CITY, EBENE, MAURITIUS, - 00, MAURITIUS |
B27886316 |
|
6 |
10307531 |
24/08/2011 |
6,500,000,000.00 |
IDBI
TRUSTEESHIP SERVICES LIMITED |
ASIAN
BUILDING, GROUND FLOOR, 17 R KAMANI MARG,, |
B21115928 |
|
7 |
10307533 |
24/08/2011 |
150,000,000.00 |
IDBI
TRUSTEESHIP SERVICES LIMITED |
ASIAN
BUILDING, GROUND FLOOR, 17 R KAMANI MARG,, |
B21116876 |
|
8 |
10276773 |
28/03/2011 |
500,000,000.00 |
BARCLAYS
BANK PLC |
EROS
CORPORATE TOWER, 1ST FLOOR, NEHRU PLACE, NEW DELHI - 110019, INDIA |
B09425307 |
|
9 |
10226713 |
24/06/2010 |
297,000,000.00 |
KOTAK
MAHINDRA BANK LIMITED |
36-38A,
NARIMAN BHAVAN, 227,D,, NARIMAN POINT, MUMBAI - 400021, MAHARASHTRA, INDIA |
A88504907 |
|
10 |
10222105 |
17/05/2010 |
450,000,000.00 |
DBS
Bank Ltd |
3RD FLOOR,
FORT HOUSE, DR. D. N. ROAD, FORT, MUMBAI - 400001, MAHARASHTRA, INDIA |
A85582237 |
|
* Date of charge modification |
||||||
FINANCIAL
PERFORMANCE AND OPERATIONS REVIEW:
The Company had another
successful financial year with a net total income of Rs. 27970.800 Millions as
against Rs. 23429.800 Millions in the previous year, a growth of 19%. The
Company’s focus on formulations business resulted into increase in overall
formulation sales to Rs. 20722.800 Millions, an increase of 18% over previous
year formulation sales of Rs. 17502.400 Millions. The Company further expanded
its therapeutic coverage with introduction of new formulations, both in the
domestic and export markets, especially in the fast growing life style related
segments. The Active Pharmaceutical Ingredient (API) business also increased by
21% to Rs. 6665.400 Millions. During the financial year under report, the
Earnings before interest, depreciation, foreign exchange translation loss
increased by 22% to Rs. 6399.500 Millions as against Rs. 5264.000 Millions in
the previous financial year. The operations have resulted in a net profit of
Rs. 3313.900 Millions during the financial year under report as against Rs.
2801.700 Millions in the previous financial year, an increase of 18%. Due to
steep depreciation of Indian Rupee vis-à-vis major currencies, during the
financial year under report, the Company incurred foreign exchange
translations/transactions loss of Rs. 632.800 Millions (previous year - loss of
Rs. 527.900 Millions).
EUROPE:
The Company
achieved European export sales of Rs. 4856.600 Millions during the financial
year under report as against sales of Rs. 4448.400 Millions in the previous
year, a growth of 9% from this continent. The Company has developed and
submitted 61 generic formulation dossiers for registration in Europe out of
which 58 dossiers are already registered. The Company has also obtained
certificate of suitability (COS) of 41 APIs (previous year - 40 APIs) from
European Directorate for Quality Medicines.
AMERICAS:
The Company
exports its APIs to USA, Canada and South American countries and formulations
to USA, Canada, Panama, West Indies and few South American countries in this sub-continent.
The Company achieved sales of Rs. 3526.100 Millions in this continent as
against Rs. 2889.800 Millions in the previous year, a growth of 22%. The
Company is working on a list of formulations for development and filing of
ANDAs with US FDA. Most of these formulations are from own APIs for which the
Company has filed/ in the process of filing Drug Master File (DMF). The Company
has signed agreements with marketing partners for sale / distribution of
generic formulations on a profit sharing arrangement in the US market. 33 ANDA
applications in respect of generic formulations developed by the Company are
filed with US FDA (previous year – 25 ANDA) out of which 14 ANDA applications
are granted till date. 48 DMFs of the Company are currently filed with US FDA.
The API business of the Company from this continent increased by 24% to Rs.
1373.900 Millions.
The formulations
manufacturing unit at Special Economic Zone (SEZ) Indore meeting current Good
Manufacturing Practices (cGMP) and regulatory requirements of developed
countries was recently re-inspected by US-FDA and the Company is awaiting the
US FDA approval to commence the formulations manufacturing from this unit for
the US market. The Company’s wholly owned subsidiary in Mexico is in the process
of filing the formulation dossiers for registration in the said country. The
Company is currently marketing its branded and generic formulations in
Venezuela, Columbia and Peru in the Latin American market with a few product
registrations. Several more formulation dossiers are in the process of being
registered / submitted for registration in all these markets of Latin America.
ASIA:
The Asian business
(excluding India) recorded sales of Rs.2206.400 Millions as against Rs.
1433.000 Millions in the previous year, a growth of 54%. The Company exports
formulations as well as APIs to several Asian countries. In countries like
Nepal, Srilanka, Myanmar, Philippines and Vietnam, the Company markets its
branded formulations through dedicated field force. The field force and product
range of the Company in Asian market is being continuously expanded.
AFRICA:
The Company
achieved export sales of Rs. 4678.800 Millions to Africa during the financial
year under report as against Rs. 3773.200 Millions in the previous year, a
growth of 24%. During the year under report, the Company received WHO
prequalification for fixed dose anti-malarial formulation of Artesunate +
Amodiaquine. This will help the Company in consolidating its antimalarial
institutional business in Africa. The Company exports branded and generic
formulations as well as APIs to 30 African countries. The Company markets
branded formulations in countries like Uganda, Ghana, Ivory Coast, Burkina
Faso, Zimbabwe, Sudan, Tanzania, Kenya, Ethiopia and Nigeria through dedicated
field force. The Company is expanding its branded formulations business across
the continent through expansion of field force and geographical coverage and
increase in the number of branded formulations marketed. The Company is also
continuously filing new formulation dossiers for registration in African
countries.
AUSTRALASIA:
The Company
exports APIs to Australia and formulations to Australia and New Zealand in this
sub-continent. The business from this continent was Rs. 495.200 Millions during
the financial year under report as against Rs. 397.900 Millions in the previous
year, a growth of 24%. The Company has developed and submitted 46 generic
formulation dossiers for registration in this market out of which 41 dossiers
are already registered. The Company is focusing on registering more formulation
dossiers in Australia and New Zealand through its wholly owned subsidiary
Company Ipca Pharma (Australia) Pty Ltd, Australia and its wholly owned
subsidiary Ipca Pharma (NZ) Pty Ltd., New Zealand.
DOMESTIC
FORMULATIONS BUSINESS:
The Company’s
formulations business in India now comprises of 12 marketing divisions focusing
on key therapeutic segments. The brand building was in evidence especially in
chronic therapy segments such as cardio-vasculars, anti-diabetics, newer
antimalarials and non steroidal anti-inflammatory drugs (NSAID). During the
year under report, the Company introduced 6 new products in the domestic
market. During the financial year under report, the domestic formulations business
recorded a growth of 16% at Rs. 8781.000 Millions as against Rs. 7541.000
Millions in the previous year.
MANAGEMENT
DISCUSSION AND ANALYSIS
INDUSTRY STRUCTURE
AND DEVELOPMENT
The global
pharmaceutical market is now estimated to be US $900 billion and is growing at
a rate of about 4% per annum. US, Japan and Europe constitute about 80% of the
global pharmaceutical market and are growing at a slower annual rate mainly due
to loss of exclusivity, lesser new product approvals and price erosions due to
generics competition. In contrast, pharmaceutical market of emerging economies
like India, Brazil, Mexico, etc. are growing at a much faster rate of 10% - 14%
per annum driven by improved per capita income, increased access and rising
awareness of modern medicines and strengthening of healthcare infrastructure.
Out of the global pharmaceutical market, generic formulations contribute about
US$ 130 billion and is growing at about 10%
per annum. US is the
largest market contributing 40% and Canada, Japan and Europe collectively
contributing another 40% of the world generic formulation business.
OUTLOOK:
Though in the
world pharmaceutical market, India has a negligible share by value, India is
recognized as one of the leading global players with large number of drug
master files and dossier registrations for Active Pharmaceutical Ingredients
(APIs) and formulations with manufacturing facilities approved by regulatory
authorities of the various countries. Indian companies are focusing on global
generic and API business, R & D activities and contract research and
manufacturing alliances. India is also fast emerging as a preferred
pharmaceuticals manufacturing location. Several large selling drugs going off
patent over next few years and increasing use of pharmaceutical generics in
developed markets to reduce healthcare cost will provide attractive growth
opportunities to generics manufacturers and thus Indian pharmaceutical industry
is poised for an accelerated growth in the coming years. However, poor public
healthcare funding and infrastructure, low per capita consumption of medicines
in developing and under developed countries including India, currency
fluctuations, inflation and resultant all round increase in input costs are few
causes of concern.
INTERNATIONAL
BUSINESS
The products of
the Company are now exported to over 110 countries across the globe. During the
financial year under report, the international business increased by 22% to Rs.
17160.800 Millions as against Rs. 14019.700 Millions in the previous year.
Formulation exports of the Company increased by 20% to Rs. 11941.800 Millions
and exports of APIs and Drug Intermediates increased by 29% to Rs. 5219.000
Millions.
CONTINGENT LIABILITIES AND COMMITMENTS NOT PROVIDED FOR IN RESPECT OF:
|
Particulars |
31.03.2013 [Rs. in millions] |
31.03.2012 [Rs. in millions] |
|
Bills discounted with banks |
2370.900 |
1472.400 |
|
Since Realized |
(1507.900) |
(850.800) |
|
Other moneys for
which the Company is contingently liable for tax, excise, customs and other
matters not accepted by the Company |
118.200* |
185.300* |
|
Claims against the Company not acknowledged as debts |
29.800 |
0.100 |
|
Corporate Guarantee given to others |
22.800 |
22.800 |
|
Guarantees given
by banks in favour of Govt. & others/ Letter of Credit opened against
which goods are not received * |
624.400 |
657.400 |
|
*Note: It includes Rs. 43.800 Millions (Previous
year Rs. 43.800 Millions) towards interest and penalty demanded by excise
department, Ankleshwar relating to erstwhile Tonira Pharma Limited since
amalgamated with the Company and is not payable in accordance with the order
passed by the Hon’ble Central Excise and Service Tax Appellate Tribunal
(CESTAT), Ahmedabad. The Department had moved the Hon’ble Gujarat High Court
against the said CESTAT order and as per the order of the said Hon’ble High
Court; the Company has furnished a Bank Guarantee of Rs. 20.000 Millions to
the Department. |
||
FIXED ASSETS:
A.
Tangible Assets
- Land
- Buildings
- Plant and Machinery
- Effluent Treatment Plant
- Furniture
and Fixtures
- Vehicles
- Equipments
- Furniture
B.
Intangible
Assets
- Software
- Know-how
- Brands and Trademarks
UNAUDITED STANDALONE
FINANCIAL RESULTS
Rs. In Millions
|
Particular |
Quarter Ended |
Year Ended |
|
|
|
31.12.2013 |
30.09.2013 |
31.12.2013 |
|
|
Unaudited
|
Unaudited
|
Unaudited
|
|
|
|
|
|
|
Net Sales/Income
from Operations |
8151.500 |
8342.700 |
24419.500 |
|
Other Operating
Income |
178.000 |
124.300 |
432.600 |
|
Total Income From Operations (Net) |
8329.500 |
8467.000 |
24852.100 |
|
|
|
|
|
|
Expenditure |
|
|
|
|
Cost of
materials consumed |
2574.600 |
3064.600 |
8401.200 |
|
Purchase
of stock in trade |
188.300 |
255.600 |
646.300 |
|
Changes
in inventories of finished goods, work in progress and stock in trade |
17.600 |
(486.400) |
(194.900) |
|
Employee
benefits expenses |
1243.200 |
1207.500 |
3594.200 |
|
Depreciation
and amortization expenses |
255.800 |
252.200 |
749.100 |
|
Other
expenses |
2132.400 |
2080.400 |
6176.400 |
|
Total Expenses |
6411.900 |
6373.900 |
19372.300 |
|
|
|
|
|
|
Profit
From Operations before Other Income, Interest and Exceptional Items |
1917.600 |
2093.100 |
5479.800 |
|
|
|
|
|
|
Other
Income |
54.200 |
53.300 |
152.000 |
|
|
|
|
|
|
Profit
Before Interest and Exceptional Items |
1971.800 |
2146.400 |
5631.800 |
|
|
|
|
|
|
Foreign
exchange transaction/translations (gain) / loss |
24.200 |
399.100 |
902.900 |
|
|
|
|
|
|
Interest |
54.400 |
57.300 |
183.000 |
|
|
|
|
|
|
Profit
After Interest but before Exceptional Items |
1893.200 |
1690.000 |
4545.900 |
|
|
|
|
|
|
Exceptional
Items |
-- |
-- |
-- |
|
|
|
|
|
|
Profit
from Ordinary Activities before Tax |
1893.200 |
1690.000 |
4545.900 |
|
|
|
|
|
|
Tax Expense |
|
|
|
|
a)
Current tax |
398.500 |
352.000 |
955.000 |
|
b) Deferred
tax |
103.500 |
43.500 |
187.500 |
|
|
|
|
|
|
Net
Profit from Ordinary Activities after Tax |
1391.200 |
1294.500 |
3403.400 |
|
|
|
|
|
|
Extraordinary
Item (net of expense) |
-- |
-- |
-- |
|
|
|
|
|
|
Net
Profit for the period |
1391.200 |
1294.500 |
3403.400 |
|
|
|
|
|
|
Paid-up
Equity Share Capital (Face Value of Rs.2 /- Each) |
252.400 |
252.400 |
252.400 |
|
|
|
|
|
|
Reserves
Excluding Revaluation Reserve |
-- |
-- |
-- |
|
|
|
|
|
|
Basic and Diluted Earning Per Share
(EPS) (Rs.)-Not Annualised |
|
|
|
|
a)
Basic and diluted EPS before extraordinary items |
11.02 |
10.26 |
26.97 |
|
b)
Basic and diluted EPS after extraordinary items |
1.02 |
10.26 |
26.97 |
|
|
|
|
|
|
Public Shareholding |
|
|
|
|
-Number
of Shares |
68287983 |
68287983 |
68287983 |
|
-
Percentage of Shareholding |
54.11 |
54.11 |
54.11 |
|
|
|
|
|
|
Promoters and Promoter Group
Shareholding |
|
|
|
|
a) Pledged/Encumbered |
|
|
|
|
-
Number of Shares |
1709350 |
1709350 |
1709350 |
|
-
Percentage of Shares (as a % of the Total Shareholding of promoter and
promoter group) |
2.95 |
2.95 |
2.95 |
|
-
Percentage of Shares (as a % of the Total Share Capital of the Company) |
1.35 |
1.35 |
1.35 |
|
|
|
|
|
|
b) Non Encumbered |
|
|
|
|
- Number
of Shares |
56201776 |
56201776 |
56201776 |
|
-
Percentage of Shares (as a % of the Total Shareholding of Promoter and
Promoter Group) |
97.05 |
97.05 |
97.05 |
|
-
Percentage of Shares (as a % of the Total Share Capital of the Company) |
44.54 |
44.54 |
44.54 |
NOTES:
1. The above unaudited
financial results as reviewed by the Audit Committee, were approved and taken
on record by the Board of Directors in their meeting held on January 28, 2014.
2. During the quarter, the Company has acquired 50%
shareholding in Avik Pharmaceutical Ltd, a company engaged in the manufacturing
and marketing of Active Pharmaceutical Ingredients (APls) being sterolds and
male & female hormones.
3. The Auditors of the Company have carried out
the limited review of the above unaudited financial results in terms of clause
41 of the Listing Agreement.
4. The entire operations of the Company relate
to only one segment viz. 'Pharmaceuticals'.
5. Previous year figures have been regrouped and
rearranged wherever necessary.
CMT REPORT (Corruption, Money Laundering & Terrorism]
The Public Notice information has been collected from various sources
including but not limited to: The Courts,
1] INFORMATION ON
DESIGNATED PARTY
No exist designating subject or any of its beneficial owners,
controlling shareholders or senior officers as terrorist or terrorist
organization or whom notice had been received that all financial transactions
involving their assets have been blocked or convicted, found guilty or against
whom a judgement or order had been entered in a proceedings for violating
money-laundering, anti-corruption or bribery or international economic or
anti-terrorism sanction laws or whose assets were seized, blocked, frozen or
ordered forfeited for violation of money laundering or international
anti-terrorism laws.
2] Court Declaration :
No exist to suggest that subject is or was
the subject of any formal or informal allegations, prosecutions or other
official proceeding for making any prohibited payments or other improper
payments to government officials for engaging in prohibited transactions or
with designated parties.
3] Asset Declaration :
No records exist to suggest that the property or assets of the subject
are derived from criminal conduct or a prohibited transaction.
4] Record on Financial
Crime :
Charges or conviction
registered against subject: None
5] Records on Violation of
Anti-Corruption Laws :
Charges or
investigation registered against subject: None
6] Records on Int’l
Anti-Money Laundering Laws/Standards :
Charges or
investigation registered against subject: None
7] Criminal Records
No
available information exist that suggest that subject or any of its principals have
been formally charged or convicted by a competent governmental authority for
any financial crime or under any formal investigation by a competent government
authority for any violation of anti-corruption laws or international anti-money
laundering laws or standard.
8] Affiliation with
Government :
No record
exists to suggest that any director or indirect owners, controlling
shareholders, director, officer or employee of the company is a government
official or a family member or close business associate of a Government
official.
9] Compensation Package :
Our market
survey revealed that the amount of compensation sought by the subject is fair
and reasonable and comparable to compensation paid to others for similar
services.
10] Press Report :
No press reports / filings exists on
the subject.
CORPORATE GOVERNANCE
MIRA INFORM as part of its Due Diligence do provide comments on
Corporate Governance to identify management and governance. These factors often
have been predictive and in some cases have created vulnerabilities to credit
deterioration.
Our Governance Assessment focuses principally on the interactions
between a company’s management, its Board of Directors, Shareholders and other
financial stakeholders.
CONTRAVENTION
Subject is not known to have contravened any existing local laws,
regulations or policies that prohibit, restrict or otherwise affect the terms
and conditions that could be included in the agreement with the subject.
FOREIGN EXCHANGE RATES
|
Currency |
Unit
|
Indian Rupees |
|
US Dollar |
1 |
Rs.60.32 |
|
|
1 |
Rs.100.04 |
|
Euro |
1 |
Rs.82.65 |
INFORMATION DETAILS
|
Information
Gathered by : |
SVA |
|
|
|
|
Analysis Done by
: |
RAS |
|
|
|
|
Report Prepared
by : |
TPT |
SCORE & RATING EXPLANATIONS
|
SCORE FACTORS |
RANGE |
POINTS |
|
HISTORY |
1~10 |
7 |
|
PAID-UP CAPITAL |
1~10 |
7 |
|
OPERATING SCALE |
1~10 |
7 |
|
FINANCIAL CONDITION |
|
|
|
--BUSINESS SCALE |
1~10 |
8 |
|
--PROFITABILIRY |
1~10 |
8 |
|
--LIQUIDITY |
1~10 |
8 |
|
--LEVERAGE |
1~10 |
7 |
|
--RESERVES |
1~10 |
8 |
|
--CREDIT LINES |
1~10 |
7 |
|
--MARGINS |
-5~5 |
-- |
|
DEMERIT POINTS |
|
|
|
--BANK CHARGES |
YES/NO |
YES |
|
--LITIGATION |
YES/NO |
YES |
|
--OTHER ADVERSE INFORMATION |
YES/NO |
NO |
|
MERIT POINTS |
|
|
|
--SOLE DISTRIBUTORSHIP |
YES/NO |
NO |
|
--EXPORT ACTIVITIES |
YES/NO |
NO |
|
--AFFILIATION |
YES/NO |
YES |
|
--LISTED |
YES/NO |
YES |
|
--OTHER MERIT FACTORS |
YES/NO |
YES |
|
DEFAULTER |
|
|
|
--RBI |
YES/NO |
NO |
|
--EPF |
YES/NO |
NO |
|
TOTAL |
|
67 |
This score serves as a reference to assess
SC’s credit risk and to set the amount of credit to be extended. It is
calculated from a composite of weighted scores obtained from each of the major
sections of this report. The assessed factors and their relative weights (as
indicated through %) are as follows:
Financial
condition (40%) Ownership
background (20%) Payment
record (10%)
Credit history
(10%) Market trend (10%) Operational size
(10%)
RATING EXPLANATIONS
|
RATING |
STATUS |
PROPOSED CREDIT LINE |
|
|
>86 |
Aaa |
Possesses an extremely sound financial base with the strongest
capability for timely payment of interest and principal sums |
Unlimited |
|
71-85 |
Aa |
Possesses adequate working capital. No caution needed for credit transaction.
It has above average (strong) capability for payment of interest and
principal sums |
Large |
|
56-70 |
A |
Financial & operational base are regarded healthy. General
unfavourable factors will not cause fatal effect. Satisfactory capability for
payment of interest and principal sums |
Fairly Large |
|
41-55 |
Ba |
Overall operation is considered normal. Capable to meet normal
commitments. |
Satisfactory |
|
26-40 |
B |
Capability to overcome financial difficulties seems comparatively below
average. |
Small |
|
11-25 |
Ca |
Adverse factors are apparent. Repayment of interest and principal sums
in default or expected to be in default upon maturity |
Limited with
full security |
|
<10 |
C |
Absolute credit risk exists. Caution needed to be exercised |
Credit not
recommended |
|
-- |
NB |
New Business |
-- |
This report is issued at your request without any
risk and responsibility on the part of MIRA INFORM PRIVATE LIMITED (MIPL) or
its officials.