MIRA INFORM REPORT
|
Report Date : |
07.04.2014 |
IDENTIFICATION DETAILS
|
Name : |
KEI INDUSTRIES LIMITED |
|
|
|
|
Registered
Office : |
D-90, Okhla Industrial Area, Phase I, New Delhi - 110020 |
|
|
|
|
Country : |
|
|
|
|
|
Financials (as on)
: |
31.03.2013 |
|
|
|
|
Date of
Incorporation : |
31.12.1992 |
|
|
|
|
Com. Reg. No.: |
55-051527 |
|
|
|
|
Capital
Investment / Paid-up Capital : |
Rs.140.475
Millions |
|
|
|
|
CIN No.: [Company Identification
No.] |
L74899DL1992PLC051527 |
|
|
|
|
TAN No.: [Tax Deduction &
Collection Account No.] |
DELK05368G DELK05577F |
|
|
|
|
PAN No.: [Permanent Account No.] |
AAACK0251C |
|
|
|
|
Legal Form : |
A Public Limited Liability company. The company’s Shares are Listed on
the Stock Exchanges. |
|
|
|
|
Line of Business
: |
Manufacturing of Low Tension (LT) Cables, High Tension
(HT) Power Cables, Extra-High Voltage (EHV) Cables, Control and
Instrumentation Cables, Rubber Cables, Winding Wires and stainless Steel
Wires (SS Wires). |
|
|
|
|
No. of Employees
: |
2000 (Approximately) |
RATING & COMMENTS
|
MIRA’s Rating : |
Ba (49) |
|
RATING |
STATUS |
PROPOSED CREDIT LINE |
|
|
41-55 |
Ba |
Overall operation is considered normal. Capable to meet normal
commitments. |
Satisfactory |
|
Maximum Credit Limit : |
USD 10220000 |
|
|
|
|
Status : |
Satisfactory |
|
|
|
|
Payment Behaviour : |
Regular |
|
|
|
|
Litigation : |
Exist |
|
|
|
|
Comments : |
Subject is an established company having satisfactory track record. Profitability
of the company seems to be fair. General financial position of the company
seems to be sound and healthy. Trade relations are fair. Business is active. Payment terms are
reported to be usually correct. The company can be considered for business dealings at usual trade
terms and conditions. |
NOTES :
Any query related to this report can be made
on e-mail : infodept@mirainform.com
while quoting report number, name and date.
ECGC Country Risk Classification List – December 1, 2013
|
Country Name |
Previous Rating (30.09.2013) |
Current Rating (01.12.2013) |
|
India |
A1 |
A1 |
|
Risk Category |
ECGC
Classification |
|
Insignificant |
A1 |
|
Low |
A2 |
|
Moderate |
B1 |
|
High |
B2 |
|
Very High |
C1 |
|
Restricted |
C2 |
|
Off-credit |
D |
INDIAN ECONOMIC OVERVIEW
India’s current account deficit for the fiscal third quarter ended
September 2013 narrowed to $4.2 billion or 0.9 % of the gross domestic product
from $31.9 billion or 6.5 % of GDP a year earlier, thanks to a pick-up in
exports and moderation in gold imports. Manufacturing activity and new orders
in India showed their strongest growth in a year in February. The news comes as
a relief after data showed Asia’s third largest economy grew by a
slower-than-expected 4.7 % annually in the three months through December. The
HSBC Manufacturing Purchasing Managers’ Index which gauges the business
activity of India’s factories but not its’ utilities, rose to 52.5 in February,
its highest in a year from 51.4 in January. Overall new orders for factory
goods which rose to a one-year high of 54.9 contributed to the surge. China has
emerged as India’s biggest trading partner in the current financial year
replacing the United Arab Emirates and pushing it to the third spot.
India-China trade has reached $49.5 billion with a 8.7 % share in India’s total
trade. The US comes second at $46 billion with 8.1 % share during the first
nine months of the current financial year.
The Reserve Bank of India has granted an additional nine months to the
public to exchange currency notes printed before 2005 including Rs 500 and Rs
1,000 denominations, pushing the deadline to January 1, 2015. A day before
dates for the Lok Sabha polls were announced, the government decided to hike
interest rates on fixed deposit schemes offered by post offices up to 0.2 per
cent. The new rates will be effective April, 1. The Supreme Court will resume
hearing on March, 11 Nokia’s appeal against a ruling over transferring
ownership of its local mobile phones plant which is the subject of a tax
dispute to Microsoft Corp.
In the last days of the current Government, another scam has surfaced.
The defence ministry has ordered a probe into Hindustan Aeronautics Limited’s
contracts from Britain’s Rolls-Royce Holdings worth at least $ 1.2 billion. The
Central Bureau of Investigation will look into allegations that over $80
million was paid in kickbacks in a deal signed in 2011. India has asked Boeing
Co. to find a solution for problems with state-owned Air India’s 787
Dreamliners. The aircraft has experienced a series of malfunctions since its
debut in 2011.
EXTERNAL AGENCY RATING
|
Rating Agency Name |
CARE |
|
Rating |
CG3 [Corporate Governance] |
|
Rating Explanation |
Provides its stakeholder adequate level of comfort on the degree of
corporate governance. |
|
Date |
28.01.2014 |
RBI DEFAULTERS’ LIST STATUS
Subject’s name is not enlisted as a defaulter
in the publicly available RBI Defaulters’ list.
EPF (Employee Provident Fund) DEFAULTERS’ LIST STATUS
Subject’s name is not enlisted as a defaulter
in the publicly available EPF (Employee Provident Fund) Defaulters’ list as of
31-03-2012.
INFORMATION PARTED BY
|
Name : |
Mr. Surendra |
|
Designation : |
Finance Manager |
|
Contact No.: |
91-11-26818840 |
LOCATIONS
|
Registered / Corporate Office : |
D-90, Okhla Industrial Area, Phase I, New Delhi-110020, |
|
Tel. No.: |
91-11-26818840/8642/0242 |
|
Fax No.: |
91-11-26817225/26811959 |
|
E-Mail : |
|
|
Website : |
|
|
Location : |
Owned |
|
|
|
|
Factory 1 : |
SP-919/920/922 RIICO Industrial Area, Phase - III,
Bhiwadi, District Alwar - 301019, |
|
Tel. No.: |
91-1493-220106/221731 |
|
Fax No.: |
91-1493-221731 |
|
E-Mail : |
|
|
|
|
|
Factory 2 : |
99/2/7, Madhuban Industrial Estate, Village Rakholi,
Silvassa - 396230, Dadra and Nagar Haveli, |
|
Tel. No.: |
91-260-2644404/2630944 |
|
Fax No.: |
91-260-2645896 |
|
E-Mail : |
|
|
|
|
|
Factory 3 : |
Plot No.A-280/281/282/283/284 RIICO Industrial Area
(Chopanki), District Alwar -301019, |
|
Tel. No.: |
91-1493-260202/06 |
|
Fax No.: |
91-1493-260203 |
|
E-Mail : |
|
|
|
|
|
Overseas Office : |
Post Box No. 261739, Jebel Ali Free Zone, Tel: +97148812310/ +971502112013 Fax: +97148812311 E-mail: dubai@kei-ind.com |
|
|
|
|
Branch Offices : |
Mumbai (Marketing Office) 101/102, Vastu Shilp, Vastu Enclave, Andheri Pump House,
Andheri (East), Mumbai-400093, Tel: 91-22-28239673 / 28375642 Fax: 91-22-28258277 e-mail: mumbai@kei-ind.com
Jaipur Tel: 91-141-5179279 Fax No.: 91-141-2221707 Email : jaipur@kei-ind.com
Pune Tel: 91-20-30526258/ 30524765 Email : pune@kei-ind.com
Tel: 91-265-6539719 / 2341831 Fax: 91-265-2334161 e-mail: baroda@kei-ind.com Bangalore Tel: 91-80-23466260 e-mail: bangalore@kei-ind.com
Chennai Tel: 91-44-42009120 Fax: 91-44-42009130 e-mail: chennai@kei-ind.com
Tel: 91-40-20064358 Fax: 91-40-24024260 e-mail: hyderabad@kei-ind.com
Kolkata 33, Dr. Sundari Mohan Avenue,
1st Floor, Kolkata-700014, West Bengal, India Tel: 91-33-22866696 Fax: 91-33-22866697 E-mail: kolkata@kei-ind.com SCO 84, 1st Floor, Swastik
Vihar, Sector-5, Panchkula-134109, India Tel: 91-172-4416301 Fax: 91-172-4416300 E-mail: chandigarh@kei-ind.com S-13, Thada Ram Complex,
M.P. Nagar Zone-l, Bhopal – 462011, Madhya Pradesh, India E-mail: bhopal@kei-ind.com Bhubaneshwar C/21, Palashpalli, Near N.C.C. Office, Bhubaneswar-751012, Orissa, India E-mail: bhubneshwar@kei-ind.com Chhatisgarh Soubhagya, 72/10, Nehru Nagar(West),
Bhilai-490020, Chhattisgarh, India E-mail: chhatisgarh@kei-ind.com 8/6,
F.M. Colony, Civil Lines, Kanpur-208001, Uttar Pradesh, India Email: kanpur@kei-ind.com F-1, Shetye Apartments,
Antilpeth, Bicholim, Goa-403504, India E-mail: goa@kei-ind.com 103, Misal Layout,
Nagpur-440014, Maharashtra, India E-mail: nagpur@kei-ind.com 36/2853, Nagawallil, Balan
Menon Road, Kaloor, Cochin-682017, Kerala, India E-mail: cochin@kei-ind.com 136, T.V. Swamy Road, R.S.
Puram, Coimbatore-641002, Tamilnadu, India
E-mail: coimbatore@kei-ind.com 102 First Floor, Saran
Chamber-2, 5 Park Road, Lucknow-226001, Uttar Pradesh, India Email: up@kei-ind.com Jamshedpur FlatC1/3, Sabitri Tower, 1st Floor,
Ulyan, Kadam, Jamshedpur – 831005, Jharkhand, India Guwahati 38, Rehabari Bill Par, A. K. Azad Road, Near NE TV,
Guwahati – 781008, Assam, India E-mail: guwahati@kei-ind.com
|
DIRECTORS
AS ON 31.03.2013
|
Name : |
Mr. Anil Gupta |
|
Designation : |
Chairman cum Managing Director |
|
Qualification : |
B.Com |
|
Date of Appointment : |
31.12.1992 |
|
|
|
|
Name : |
Mrs. Archana Gupta |
|
Designation : |
Director |
|
|
|
|
Name : |
Mr. Pawan Bholusaria |
|
Designation : |
Director |
|
|
|
|
Name : |
Mr. K G Somani |
|
Designation : |
Director |
|
|
|
|
Name : |
Mr. Vikram Bhartia |
|
Designation : |
Director |
|
|
|
|
Name : |
Mr. Vijay Bhushan |
|
Designation : |
Director |
|
|
|
|
Name : |
Mr. Rajeev Gupta |
|
Designation : |
Executive Director (Finance) |
|
Qualification : |
Chartered Accountant |
|
Date of Appointment : |
14.12.1993 |
KEY EXECUTIVES
|
Name : |
Mr. S.L. Kakkar |
|
Designation : |
President |
|
|
|
|
Name : |
Mr. Manoj Kakkar |
|
Designation : |
Sr. Vice President (Marketing) |
|
|
|
|
Name : |
Mr. Lalit Sharma, |
|
Designation : |
Chief Operating Office |
|
|
|
|
Name : |
Mr. P.K. Aggarwal |
|
Designation : |
Vice President (Corporate) |
|
|
|
|
Name : |
Mr. K.C. Sharma |
|
Designation : |
Vice President (Operation) |
|
|
|
|
Name : |
Mr. Manish Mantri, |
|
Designation : |
Vice President (EPC/EHV) |
|
|
|
|
Name : |
Mr. Arvind Shrowty |
|
Designation : |
Corporate Advisor |
|
|
|
|
Name : |
Mr. A. K. Maity |
|
Designation : |
Sr. GM (Works) |
|
|
|
|
Name : |
Mr. N.K. Bajaj |
|
Designation : |
Sr. GM-Marketing (Wires and Flexibles) |
|
|
|
|
Name : |
Mr. Munishvar Gaur |
|
Designation : |
GM (Head-North Marketing Cables) |
|
|
|
|
Name : |
Mr. Alok Saha |
|
Designation : |
GM (Marketing) |
|
|
|
|
Name : |
Mr. Umesh B. Kank |
|
Designation : |
GM (Marketing) |
|
|
|
|
Name : |
Mr. M.V. Gananath |
|
Designation : |
GM-Sales and Marketing |
|
|
|
|
Name : |
Mr. Keshav K. Mitra, |
|
Designation : |
GM-Sales and Marketing |
|
|
|
|
Name : |
Mr. Deepak Manchanda |
|
Designation : |
GM (Business Development) |
|
|
|
|
Name : |
Mr. Naval Singh Yadav |
|
Designation : |
Sr. GM (Technical) |
|
|
|
|
Name : |
Mr. Pawan Kumar Jain |
|
Designation : |
GM (EPC) |
|
|
|
|
Name : |
Mr. Dilip Barnwal |
|
Designation : |
Vice President (Operation-Silvassa) |
|
|
|
|
Name : |
Mr. Ajay Mehra |
|
Designation : |
GM (Works - Bhiwadi) |
|
|
|
|
Name : |
Mr. Adarsh Jain |
|
Designation : |
GM (Finance) |
|
|
|
|
Name : |
Mr. Kunal Gupta |
|
Designation : |
GM (International Marketing) |
|
|
|
|
Name : |
Mr. Gaurav Sahi |
|
Designation : |
Head - Corporate Communication |
|
|
|
|
Name : |
Mr. Surendra |
|
Designation : |
Finance Manager |
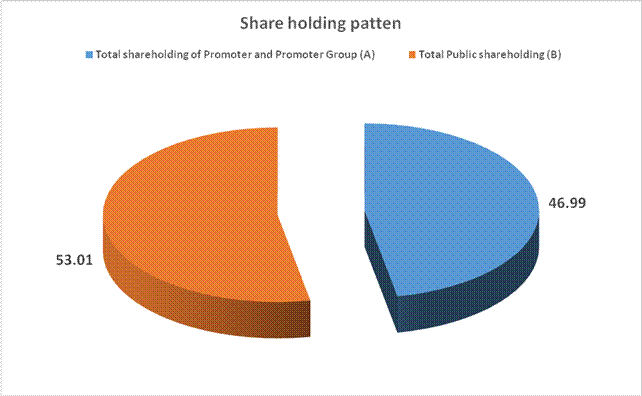
MAJOR SHAREHOLDERS / SHAREHOLDING PATTERN
AS ON 31.12.2013
|
Category of Shareholder |
Total No. of Shares |
Total Shareholding as a % of Total No. of Shares |
|
(A) Shareholding of Promoter and Promoter Group |
|
|
|
|
|
|
|
|
21068466 |
28.57 |
|
|
13580000 |
18.42 |
|
|
34648466 |
46.99 |
|
|
|
|
|
Total shareholding of Promoter and Promoter Group (A) |
34648466 |
46.99 |
|
(B) Public Shareholding |
|
|
|
|
|
|
|
|
2850 |
0.00 |
|
|
800969 |
1.09 |
|
|
803819 |
1.09 |
|
|
|
|
|
|
14538775 |
19.72 |
|
|
|
|
|
|
18118362 |
24.57 |
|
|
3904323 |
5.29 |
|
|
1723693 |
2.34 |
|
|
610449 |
0.83 |
|
|
1112644 |
1.51 |
|
|
600 |
0.00 |
|
|
38285153 |
51.92 |
|
Total Public shareholding (B) |
39088972 |
53.01 |
|
Total (A)+(B) |
73737438 |
100.00 |
|
(C) Shares held by Custodians and against which Depository Receipts
have been issued |
0 |
0.00 |
|
|
0 |
0.00 |
|
|
0 |
0.00 |
|
|
0 |
0.00 |
|
Total (A)+(B)+(C) |
73737438 |
0.00 |
BUSINESS DETAILS
|
Line of Business : |
Manufacturing of Low Tension (LT) Cables, High Tension
(HT) Power Cables, Extra-High Voltage (EHV) Cables, Control and Instrumentation
Cables, Rubber Cables, Winding Wires and stainless Steel Wires (SS Wires). |
PRODUCTION STATUS [AS ON 31.03.2011]
|
Particulars |
Unit |
Licensed
Capacity |
Installed
Capacity* |
Actual
Production |
|
Cables |
Kms. |
N.A. |
65600.000 |
45787.590 |
|
Stainless Steel Wires |
Kgs. |
N.A. |
4800000 |
3916194.910 |
|
Winding, Flexible and House Wires |
Kms. |
N.A. |
270000.000 |
103377.074 |
Installed capacity has been certified by
Chairman cum Managing Director and relied upon by Auditors.
GENERAL INFORMATION
|
No. of Employees : |
2000 (Approximately) |
|||||||||||||||||||||||||||||||||
|
|
|
|||||||||||||||||||||||||||||||||
|
Bankers : |
|
|||||||||||||||||||||||||||||||||
|
|
|
|||||||||||||||||||||||||||||||||
|
Facilities : |
|
|||||||||||||||||||||||||||||||||
|
|
|
|
Banking
Relations : |
-- |
|
|
|
|
Auditors : |
|
|
Name : |
Jagdish Chand and Company Chartered Accountant |
|
Address : |
|
|
|
|
|
Associates : |
KEI International Limited |
|
|
|
|
Other Related Parties : |
|
CAPITAL STRUCTURE
AS ON 31.03.2013
Authorised Capital :
|
No. of Shares |
Type |
Value |
Amount |
|
110000000 |
Equity Shares |
Rs.2/- each |
Rs.220.000 Millions |
|
300000 |
Preferences Shares |
Rs.100/- each |
Rs.30.000 Millions |
|
|
TOTAL
|
|
Rs.250.000
Millions |
Issued, Subscribed & Paid-up Capital :
|
No. of Shares |
Type |
Value |
Amount |
|
70237438 |
Equity Shares |
Rs.2/- each |
Rs.140.475
Millions |
NOTES:
RIGHTS, PREFERENCES AND RESTRICTIONS SHARES:
Equity Shares: The
Company has issued one class of equity shares having par value of Rs. 2 per share.
Each shareholder is eligible for one vote per share held. The dividend proposed
by the Board of Directors is subject to the approval of the shareholders in the
ensuing Annual General Meeting, except in case of interim dividend. In the
event of liquidation, the equity shareholders are eligible to receive the
remaining assets of the Company after distribution of all preferential amounts,
in proportion to their shareholding.
RECONCILIATION OF
THE NUMBER OF EQUITY SHARES:
|
PARTICULAR |
AS ON 31ST
MARCH, 2013 |
|
|
|
Nos. |
Rs. in Millions |
|
Balance as at the beginning of the year |
66937438 |
133.875 |
|
Add: Issued during the Year |
3300000 |
6.600 |
|
Balance as at
the end of the year |
70237438 |
140.475 |
Additions of
33,00,000 (Previous Year NIL) equity shares were issued on Preferential basis
to following parties as per SEBI (ICDR) Regulations, 2009 at a price of Rs. 18
per share (including securities premium of Rs. 16/-)
|
Name of Shareholders |
Year Ended 31st
March, 2012 |
|
|
Nos. |
|
Anil Gupta |
1400000 |
|
Projection Financial and Management Consultants Private Limited |
900000 |
|
Dhan Versha Agency Private Limited |
1000000 |
|
Total
|
3300000 |
LIST OF EQUITY SHAREHOLDERS
HOLDING MORE THAN 5% OF THE AGGREGATE EQUITY SHARES:
|
PARTICULAR |
AS ON 31ST
MARCH, 2013 |
|
|
|
Nos. |
% Age |
|
Anil Gupta |
15580776 |
21.18% |
|
Anil Gupta HUF beneficiary Anil Gupta |
4650375 |
6.62% |
|
Shubh Laxmi Motels and Inns Private Limited |
3480000 |
4.95% |
FINANCIAL DATA
[all figures are
in Rupees Millions]
ABRIDGED BALANCE
SHEET
|
SOURCES
OF FUNDS |
31.03.2013 |
31.03.2012 |
31.03.2011 |
|
I.
EQUITY AND LIABILITIES |
|
|
|
|
(1)Shareholders' Funds |
|
|
|
|
(a) Share Capital |
140.475 |
133.875 |
133.875 |
|
(b) Reserves & Surplus |
2415.222 |
2126.710 |
2245.313 |
|
(c) Money
received against share warrants |
0.000 |
0.000 |
0.000 |
|
|
|
|
|
|
(2)
Share Application money pending allotment |
0.000 |
0.000 |
0.000 |
|
Total Shareholders’ Funds (1) + (2) |
2555.697 |
2260.585 |
2379.188 |
|
|
|
|
|
|
(3)
Non-Current Liabilities |
|
|
|
|
(a)
long-term borrowings |
1034.437 |
1285.702 |
1139.072 |
|
(b) Deferred tax
liabilities (Net) |
105.638 |
23.352 |
36.682 |
|
(c)
Other long term liabilities |
0.000 |
0.000 |
0.000 |
|
(d)
long-term provisions |
21.392 |
16.069 |
12.441 |
|
Total
Non-current Liabilities (3) |
1161.467 |
1325.123 |
1188.195 |
|
|
|
|
|
|
(4) Current Liabilities |
|
|
|
|
(a)
Short term borrowings |
2860.261 |
2917.316 |
1415.722 |
|
(b)
Trade payables |
3947.807 |
4092.579 |
2942.308 |
|
(c)
Other current liabilities |
1200.496 |
1297.804 |
1339.222 |
|
(d)
Short-term provisions |
45.790 |
45.747 |
24.859 |
|
Total
Current Liabilities (4) |
8054.354 |
8353.446 |
5722.111 |
|
|
|
|
|
|
TOTAL |
11771.518 |
11939.154 |
9289.494 |
|
|
|
|
|
|
II.
ASSETS |
|
|
|
|
(1) Non-current assets |
|
|
|
|
(a)
Fixed Assets |
|
|
|
|
(i)
Tangible assets |
3082.580 |
3173.697 |
3007.411 |
|
(ii)
Intangible Assets |
6.124 |
7.332 |
9.385 |
|
(iii)
Capital work-in-progress |
25.976 |
2.091 |
69.450 |
|
(iv) Intangible assets under
development |
0.000 |
0.000 |
0.000 |
|
(b)
Non-current Investments |
30.817 |
30.817 |
30.817 |
|
(c)
Deferred tax assets (net) |
0.000 |
0.000 |
0.000 |
|
(d) Long-term Loan and Advances |
52.734 |
34.209 |
61.005 |
|
(e)
Other Non-current assets |
0.000 |
2.074 |
2.074 |
|
Total
Non-Current Assets |
3198.231 |
3250.220 |
3180.142 |
|
|
|
|
|
|
(2) Current assets |
|
|
|
|
(a)
Current investments |
0.000 |
0.000 |
0.000 |
|
(b)
Inventories |
3581.551 |
2922.434 |
2822.649 |
|
(c)
Trade receivables |
4212.183 |
4825.995 |
2633.543 |
|
(d)
Cash and cash equivalents |
156.221 |
43.688 |
124.379 |
|
(e)
Short-term loans and advances |
455.049 |
523.224 |
498.103 |
|
(f)
Other current assets |
168.283 |
373.593 |
30.678 |
|
Total
Current Assets |
8573.287 |
8688.934 |
6109.352 |
|
|
|
|
|
|
TOTAL |
11771.518 |
11939.154 |
9289.494 |
PROFIT & LOSS
ACCOUNT
|
|
PARTICULARS |
31.03.2013 |
31.03.2012 |
31.03.2011 |
|
|
|
SALES |
|
|
|
|
|
|
|
Income |
16583.525 |
17223.032 |
11631.057 |
|
|
|
Other Income |
23.550 |
16.248 |
59.881 |
|
|
|
TOTAL
(A) |
16607.075 |
17239.280 |
11690.938 |
|
|
|
|
|
|
|
|
Less |
EXPENSES |
|
|
|
|
|
|
|
Cost of Materials Consumed |
12461.276 |
13149.219 |
9785.496 |
|
|
|
Purchases of Stock in Trade |
59.680 |
101.667 |
4.306 |
|
|
|
Employee Benefits Expense |
461.441 |
370.518 |
275.386 |
|
|
|
Other Expenses |
2329.833 |
2185.118 |
1183.890 |
|
|
|
(Increase) / Decrease in Finished goods, Work-in-progress and
Stock-in-trade |
(433.901) |
(84.286) |
(695.550) |
|
|
|
TOTAL (B) |
14878.329 |
15722.236 |
10553.528 |
|
|
|
|
|
|
|
|
Less |
PROFIT
/ (LOSS) BEFORE INTEREST, TAX, DEPRECIATION AND AMORTISATION (A-B) (C) |
1728.746 |
1517.044 |
937.410 |
|
|
|
|
|
|
|
|
|
Less |
FINANCIAL
EXPENSES (D) |
1093.537 |
961.623 |
593.154 |
|
|
|
|
|
|
|
|
|
|
PROFIT
/ (LOSS) BEFORE TAX, DEPRECIATION AND AMORTISATION (C-D) (E) |
635.209 |
555.421 |
344.256 |
|
|
|
|
|
|
|
|
|
Less/ Add |
DEPRECIATION/
AMORTISATION (F) |
204.448 |
195.449 |
166.100 |
|
|
|
|
|
|
|
|
|
|
PROFIT / (LOSS)
BEFORE TAX (E-F) (G) |
430.761 |
359.972 |
178.156 |
|
|
|
|
|
|
|
|
|
Less |
TAX (H) |
167.391 |
116.684 |
72.574 |
|
|
|
|
|
|
|
|
|
|
PROFIT / (LOSS)
AFTER TAX (G-H) (I) |
263.370 |
243.288 |
105.582 |
|
|
|
|
|
|
|
|
|
Add |
PREVIOUS
YEARS’ BALANCE BROUGHT FORWARD |
1478.363 |
1250.634 |
1160.611 |
|
|
|
|
|
|
|
|
|
Less |
APPROPRIATIONS |
|
|
|
|
|
|
|
Proposed Dividend on Equity Shares (Dividend of Rs.0.20 per equity share) |
14.047 |
13.387 |
13.387 |
|
|
|
Dividend Distribution Tax on Proposed Dividend |
2.387 |
2.172 |
2.172 |
|
|
BALANCE CARRIED
TO THE B/S |
1725.299 |
1478.363 |
1250.634 |
|
|
|
|
|
|
|
|
|
|
EARNINGS IN
FOREIGN CURRENCY |
|
|
|
|
|
|
|
Sales (Exports) |
972.181 |
1250.023 |
1025.991 |
|
|
TOTAL EARNINGS |
972.181 |
1250.023 |
1025.991 |
|
|
|
|
|
|
|
|
|
|
IMPORTS |
|
|
|
|
|
|
|
Raw Materials purchases |
350.577 |
413.315 |
395.544 |
|
|
|
Packing Materials |
14.235 |
4.765 |
0.000 |
|
|
|
Stores, Spares & Consumables |
1.713 |
3.234 |
1.491 |
|
|
|
Capital Goods |
11.333 |
42.018 |
80.218 |
|
|
TOTAL IMPORTS |
377.858 |
463.332 |
477.253 |
|
|
|
|
|
|
|
|
|
|
Earnings /
(Loss) Per Share (Rs.) |
|
|
|
|
|
|
- Basic |
3.84 |
3.63 |
1.64 |
|
|
|
- Diluted |
3.84 |
3.63 |
1.30 |
|
QUARTERLY RESULTS
|
PARTICULARS |
30.06.2013 |
30.09.2013 |
31.12.2013 |
|
Type |
1st
Quarter |
2nd
Quarter |
3rd
Quarter |
|
Net Sales |
3624.200 |
3781.800 |
4110.100 |
|
Total Expenditure |
3282.700 |
3445.700 |
3699.100 |
|
PBIDT (Excl OI) |
341.500 |
336.100 |
411.000 |
|
Other Income |
01.700 |
06.000 |
01.300 |
|
Operating Profit |
343.200 |
342.100 |
412.300 |
|
Interest |
266.500 |
257.100 |
279.500 |
|
Exceptional Items |
0.000 |
0.000 |
0.000 |
|
PBDT |
76.700 |
84.900 |
132.800 |
|
Depreciation |
51.400 |
51.700 |
52.400 |
|
Profit Before Tax |
25.300 |
33.300 |
80.400 |
|
Tax |
15.300 |
18.500 |
31.800 |
|
Provisions and contingencies |
0.000 |
0.000 |
0.000 |
|
Profit After Tax |
10.000 |
14.700 |
48.600 |
|
Other Adjustments |
0.000 |
0.000 |
0.000 |
|
Net Profit |
10.000 |
14.700 |
48.600 |
KEY RATIOS
|
PARTICULARS |
|
31.03.2013 |
31.03.2012 |
31.03.2011 |
|
PAT / Total Income |
(%) |
1.59
|
1.41 |
0.90 |
|
|
|
|
|
|
|
Net Profit Margin (PBT/Sales) |
(%) |
2.60
|
2.09 |
1.53 |
|
|
|
|
|
|
|
Return on Total Assets (PBT/Total Assets} |
(%) |
3.67
|
3.02 |
1.94 |
|
|
|
|
|
|
|
Return on Investment (ROI) (PBT/Networth) |
|
0.17
|
0.16 |
0.07 |
|
|
|
|
|
|
|
Debt Equity Ratio (Total Debt/Networth) |
|
1.52
|
1.85 |
1.07 |
|
|
|
|
|
|
|
Current Ratio (Current Asset/Current Liability) |
|
1.06
|
1.04 |
1.07 |
FINANCIAL ANALYSIS
[all figures are
in Rupees Millions]
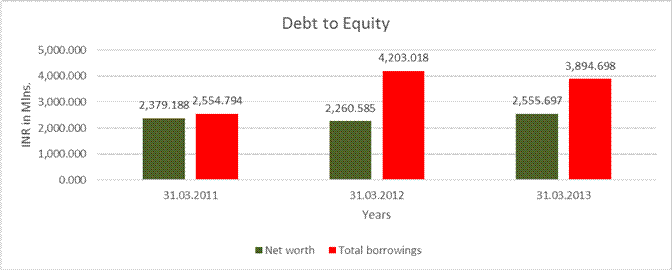
DEBT EQUITY RATIO
|
Particular |
31.03.2011 |
31.03.2012 |
31.03.2013 |
|
|
(INR in Mlns.) |
(INR in Mlns.) |
(INR in Mlns.) |
|
Share Capital |
133.875 |
133.875 |
140.475 |
|
Reserves & Surplus |
2245.313 |
2126.71 |
2415.222 |
|
Net worth |
2,379.188 |
2,260.585 |
2,555.697 |
|
|
|
|
|
|
long-term borrowings |
1139.072 |
1285.702 |
1034.437 |
|
Short term borrowings |
1415.722 |
2917.316 |
2860.261 |
|
Total borrowings |
2,554.794 |
4,203.018 |
3,894.698 |
|
Debt/Equity ratio |
1.074 |
1.859 |
1.524 |
YEAR-ON-YEAR GROWTH
|
Year on Year Growth |
31.03.2011 |
31.03.2012 |
31.03.2013 |
|
|
(INR in Mlns) |
(INR in Mlns) |
(INR in Mlns) |
|
Sales |
11631.057 |
17223.032 |
16583.525 |
|
|
|
48.078 |
(3.713) |
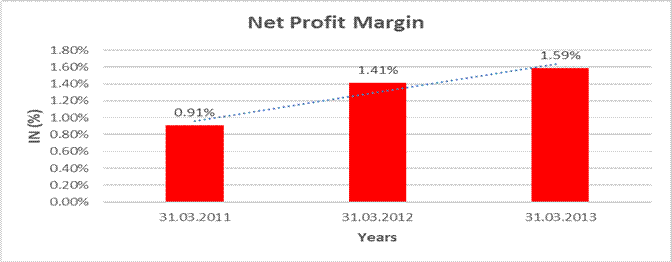
NET PROFIT MARGIN
|
Net Profit Margin |
31.03.2011 |
31.03.2012 |
31.03.2013 |
|
|
(INR in Mlns) |
(INR in Mlns) |
(INR in Mlns) |
|
Sales |
11631.057 |
17223.032 |
16583.525 |
|
Profit |
105.582 |
243.288 |
263.370 |
|
|
0.91% |
1.41% |
1.59% |
LOCAL AGENCY FURTHER INFORMATION
|
Sr. No. |
Check List by
Info Agents |
Available in
Report (Yes / No) |
|
1] |
Year of Establishment |
Yes |
|
2] |
Locality of the firm |
Yes |
|
3] |
Constitutions of the firm |
Yes |
|
4] |
Premises details |
No |
|
5] |
Type of Business |
Yes |
|
6] |
Line of Business |
Yes |
|
7] |
Promoter's background |
Yes |
|
8] |
No. of employees |
Yes |
|
9] |
Name of person contacted |
Yes |
|
10] |
Designation of contact person |
Yes |
|
11] |
Turnover of firm for last three years |
Yes |
|
12] |
Profitability for last three years |
Yes |
|
13] |
Reasons for variation <> 20% |
-- |
|
14] |
Estimation for coming financial year |
No |
|
15] |
Capital in the business |
Yes |
|
16] |
Details of sister concerns |
Yes |
|
17] |
Major suppliers |
No |
|
18] |
Major customers |
No |
|
19] |
Payments terms |
No |
|
20] |
Export / Import details (if applicable) |
No |
|
21] |
Market information |
-- |
|
22] |
Litigations that the firm / promoter involved in |
Yes |
|
23] |
Banking Details |
Yes |
|
24] |
Banking facility details |
Yes |
|
25] |
Conduct of the banking account |
-- |
|
26] |
Buyer visit details |
-- |
|
27] |
Financials, if provided |
Yes |
|
28] |
Incorporation details, if applicable |
Yes |
|
29] |
Last accounts filed at ROC |
Yes |
|
30] |
Major Shareholders, if available |
Yes |
|
31] |
PAN of Proprietor/Partner/Director, if available |
No |
|
32] |
Date
of Birth of Proprietor/Partner/Director, if available |
No |
|
33] |
Voter ID No of Proprietor/Partner/Director, if available |
No |
|
34] |
External Agency Rating, if available |
Yes |
|
CASE DETAILS IN THE HIGH
COURT OF DELHI AT NEW DELHI
COMMISSIONER OF
INCOME TAX DELHI -II..... APPELLANT
ORDER
NA |
|
Unsecured Loan |
As
on 31.03.2013 [Rs.
in Millions] |
As
on 31.03.2012 [Rs.
in Millions] |
|
Long Term
Borrowings |
|
|
|
Loans and
Advances from Related Parties |
|
|
|
– Deposits from Directors |
0.000 |
3.500 |
|
– Deposits from Related Parties |
3.600 |
1.650 |
|
Deposits from
Others |
|
|
|
– Public Deposits |
22.285 |
18.200 |
|
|
|
|
|
Short Term
Borrowings |
|
|
|
– Commercial Paper Issued to Bank |
200.000 |
0.000 |
|
Loans and
Advances from Related Parties |
|
|
|
– Deposits |
1.000 |
2.410 |
|
Deposits from
Others |
|
|
|
– Inter Corporate Deposits |
5.500 |
1.500 |
|
– Public Deposits |
10.210 |
11.415 |
|
TOTAL
|
242.595 |
38.675 |
HISTORY:
Subject is an established player in the power cable segment
and among the largest cable manufacturing companies in
As of inception year itself, the company had started to manufacture Switchboard
Cables for DOT. The manufacturing of Control, Instrumentation and Thermocouple
Cables was begun in the year 1985. In 1993, manufacturing of PVC/XLPE Power
cables up to 3.3 KV was added to existing portfolio of the company. During the
year 1994, KEIIL had diversified into Stainless Steel drawings with Pilot
Plant. After a year, in 1995, the company had issued its first Initial Public
Offerings, went to Public. Subject had installed its major SSW plant in the
year 1996 at Bhiwadi for the manufacturing purpose. Follow this, a year after,
in 1997, formulated another plant at Bhiwadi for LT PVC / XLPE Cables. Subject
had scaled up with manufacture of Rubber Cables up to 11 KV in the year 2001.
As of 2002, the company had established Jelly Filled Telecom Cables (JFTC)
Plant at Silvassa. In the year 2005, the company made upgrade function of JFTC
Plant in Silvassa to manufacture existing cable range, the achievement was the
successful re-engineering and conversion of the idle JFTC.
During the year 2006, to manufacture up to 33 kV HT XLPE Cables with Dry curing
inert nitrogen gas and with triple extrusion (Single cross head) process, the
company made expansion activities at Bhiwadi unit. The Company had Introduced
ERP Baan S/W system in the organization to ensure Transparency and efficacy in
the same year 2006. Subject had upgraded Bhiwadi Unit in the year 2007 to
manufacture HT power cable up to 132 kV and LT cable. In the identical year of
2007, the company had received Corporate Governance Rating. Subject had
commenced Engineering Procurement Construction operations in the same year 2007
and also secured prestigious orders across the country.
REVIEW OF
OPERATIONS:
During the year,
turnover of the Company remained flat and there was slight decline from Rs.
18529.516 Millions to Rs. 18122.830 Millions. During the year, turnover from
Cables stood at Rs. 12948.216 Millions as compared to Rs. 14315.938 Millions in
2011-12, showing a decline of 9.55%. Stainless Steel Wire Products contributed
a turnover of Rs. 830.569 Millions in 2012-13 as compared to Rs. 1006.829
Millions in 2011-12. Winding wire, Flexible and House Wire contributed Rs.
2664.777 Millions in 2012-13 as against Rs. 2113.976 Millions in 2011-12,
showing strong growth of 26%. During the year, Operating Profit of the Company
has improved from Rs. 1305.344 Millions to Rs. 1500.748 Millions while Profit
before tax stood at Rs. 430.761 Millions and Net profit at Rs. 263.370 Millions
respectively. The Company was able to bag various prestigious orders of
elastomeric cables, speciality cables apart from normal cables and wires which
contributed towards achievement of turnover. The Company has already marked its
presence in Extra High Voltage (EHV) Cable segment ranging from 66kV to 220kV
and will continue to further strengthen its position in this segment with
Technical Collaboration from Brugg Kabel AG, Switzerland. The Company has also
successfully completed the rigorous long duration pre-qualification test on 220
kV Cable system at an International Laboratory, FGH Engineering and Test GmbH,
Hallenweg, Germany. This gives the Company a firm marketing ground and the
status of being among the few Companies in India to achieve this feat.
FUTURE OUTLOOK:
The business environment
for Cable industry is showing signs of industrial and infrastructure growth.
The future outlook in terms of investment in the infrastructure sector,
particularly power, is also good. This indicates that demand for the cable
business should improve further. With Company's successful venture into Extra
High Voltage (EHV) Cables and presence in Engineering, Procurement and
Construction (EPC) space, Company has an edge in the Cable Industry. The
Company has specific tie-ups in this segment i.e. Foreign Technical
Collaboration with Brugg Kabel AG, Switzerland which will help the Company to
capitalize its proven presence in the Cable and EPC business.
MANAGEMENT DISCUSSION AND ANALYSIS:
COMPANY OVERVIEW:
KEI Industries
Limited (hereinafter “the Company”/ “KEI”) is engaged in the business of
manufacturing and marketing power cables - Low Tension (LT), High Tension (HT)
and Extra High Voltage (EHV), control and instrumentation cables, specialty
cables, elastomeric cable, rubber cables, submersible cables, flexible and
house wires, winding wires and stainless steel wires that address the cabling
requirements of a wide spectrum of sectors such as power, oil refineries,
railways, automobiles, cement, steel, fertilizers, textile and real estate,
amongst others. The Company has also ventured into the Engineering, Procurement
and Construction (EPC) space by bagging several prestigious orders/contracts
for survey, supply of materials, design, erection, testing and commissioning on
a turnkey basis. Featuring amongst the top three cable manufacturing companies
in India, the Company's diverse, cost effective, reliable and quality product
offerings coupled with vast sectoral coverage, flexible manufacturing
facilities, higher capacities and presence across cabling solutions up to 220
kV, positions the Company favorably to harness the immense opportunities and
growth prospects emanating from the power utilities, core infrastructure,
industrial and real estate projects across the country. Further, specialty
cables has emerged as a significant market on account of the growth in
sophisticated applications in many vital sectors of the Indian economy. KEI
ranks amongst the principal players in the manufacture of specialty cables. The
Company has also enhanced its presence in the retail market by appointing
various channel partners and dealers/distributors. It has put in place a
diversified business model with presence in both the domestic and international
market, servicing both the retail and institutional segment, catering to both
private and public sector clients and offering one-stop products basket.
GLOBAL ECONOMY:
Global economic
activity remains subdued amidst signs of diverging growth paths across major
economies. In the US, a slow recovery is taking hold, driven by improvements in
the housing sector and employment conditions. However, the pace of recovery
remains vulnerable to the adverse impact of the budget sequestration which will
gradually gain pace in the months ahead. Japan's economy stopped contracting in
Q4 of 2012. There has been some improvement in consumer confidence on account
of monetary and fiscal stimulus along with a pick-up in external demand on the
back of a weakening yen. In the euro area, recessionary conditions,
characterized by deterioration in industrial production, weak exports and low
domestic demand, continued into Q1 of 2013. High unemployment, fiscal drag and
hesitant progress on financial sector repair have eroded consumer confidence.
Growth in several Emerging and Developing Economies (EDEs) rebounded from the
moderation in 2012 as domestic demand rose on a turnaround in the inventory
cycle and some pick-up in investment. Among BRICS countries, growth accelerated
in Brazil and South Africa, while it persisted below trend in China, Russia and
India. Inflation has remained benign in the Advanced Economies (AEs) in the
absence of demand pressures, and inflation expectations remain well-anchored.
The EDEs, on the other hand, present a mixed picture. While inflation has
picked up in Brazil, Russia and Turkey, it has eased in China, Korea, Thailand
and Chile. Reflecting a pessimistic demand outlook, crude oil prices eased in
March- April 2013 from the elevated levels prevailing through 2012. Non-energy
commodity prices have been easing through Q1 of 2013 on softening metal prices
and decline in food prices.
DOMESTIC ECONOMY:
With output
expansion of only 4.5 per cent in Q3 of 2012-13, the lowest in 15 quarters,
cumulative GDP growth for the period April-December 2012 declined to 5.0 per
cent from 6.6 per cent a year ago. This was mainly due to the protracted
weakness in industrial activity aggravated by domestic supply bottlenecks, and
slowdown in the services sector reflecting weak external demand. The Central
Statistics Office (CSO)'s advance estimate of GDP growth for 2012-13 of 5.0 per
cent implies that the economy would have expanded by 4.7 per cent in Q4. The
growth of industrial production slid to 0.6 per cent in February 2013 from 2.4
per cent a month ago, mainly due to contraction in mining and electricity
generation and slowing growth in manufacturing. Consequently, on a cumulative
basis, growth in industrial production decelerated to 0.9 per cent during
2012-13 (April-February) from 3.5 per cent in the corresponding period of the
previous year. The Reserve Bank's order books, inventories and capacity
utilization survey (OBICUS) suggests that capacity utilization remained flat.
On the demand
side, the persisting decline in capital goods production during April 2012 -
February 2013 reflects depressed investment conditions. The moderation in
corporate sales and weakening consumer confidence suggest that the slowdown
could be spreading to consumption spending. Headline inflation, as measured by
the wholesale price index (WPI), moderated to an average of 7.3 per cent in
2012-13 from 8.9 per cent in the previous year.
During 2013-14,
economic activity is expected to show only a modest improvement over last year,
with a pick-up likely only in the second half of the year. Conditional upon a normal
monsoon, agricultural growth could return to trend levels. The outlook for
industrial activity remains subdued, with the pipeline of new investment drying
up and existing projects stalled by bottlenecks and implementation gaps. With
global growth unlikely to improve significantly from 2012, growth in services
and exports may remain sluggish. Accordingly, the baseline GDP growth for
2013-14 is projected at 5.7 per cent by the Reserve Bank of India.
FUTURE OUTLOOK:
The commencement
of the EHV cable manufacturing along with the ability to offer turnkey EPC
services will provide impetus to the institutional business segment where
demand is fast expanding. Some of the end-users of EHV cables include
transmission companies, mega power plants, metro cities, industries such as
steel, cement, refineries, petrochemicals, large realty projects such as IT
Parks, large residential complexes, etc. KEI's foray into the EHV segment will
be aided by its Know-how and Trademark License Agreement entered with Switzerland-based
M/s Brugg Kabel AG. This agreement would enable a faster penetration into the
market and also help the company be in a position to offer designs, process
back-up services which are sought by end users. They are also specialists in
the area of turnkey systems/design of Extra High Voltage Cable projects with
installations world over. Through this technical collaboration, KEI joins the
elite group of cable manufacturers worldwide equipped to manufacture cables
ranging from 66kV to 220kV at its facilities. The technology edge will enable
KEI establish a stronghold in the EHV cable segment and secure contracts in the
power segment from both the government and private sector.
FIXED ASSETS:
Tangible Assets
- Land Free Hold
- Land Lease Hold
- Building
- Plant and Equipment
- Furniture and Fixtures
- Leasehold Building Improvement
- Vehicles
- Office Equipment
- Vehicles
Intangible Assets
- Software
STATEMENT OF UNAUDITED
FINANCIAL RESULTS FOR THE QUARTER AND NINE MONTH ENDED 31ST
DECEMBER, 2013
Rs. In Millions
|
Sr. No. |
Particular |
Quarter
Ended |
Nine
Months Ended |
|
|
|
|
31.12.2013 |
30.09.2013 |
31.12.2013 |
|
|
|
Unaudited
|
Unaudited
|
Unaudited
|
|
|
|
|
|
|
|
1. |
Net Sales/Income
from Operations |
4059.600 |
3734.970 |
11376.948 |
|
|
Other Operating
Income |
50.531 |
46.847 |
139.234 |
|
|
Total Income From Operations (Net) |
4110.131 |
3781.817 |
11516.182 |
|
|
|
|
|
|
|
2. |
Expenditure |
|
|
|
|
|
Cost
of materials consumed |
3046.558 |
3263.194 |
9164.904 |
|
|
Purchase
of stock in trade |
3.762 |
5.021 |
18.548 |
|
|
Employee
benefits expenses |
129.194 |
127.497 |
382.736 |
|
|
Depreciation
and amortization expenses |
52.424 |
51.695 |
155.515 |
|
|
Other
expenses |
489.400 |
558.297 |
1520.573 |
|
|
Changes
in inventories of finished goods, work in progress and stock in trade |
30.226 |
(508.303) |
(659.176) |
|
|
Total Expenses |
3751.564 |
3497.401 |
10683.100 |
|
|
|
|
|
|
|
3. |
Profit
From Operations before Other Income, Interest and Exceptional Items (1-2) |
358.567 |
284.416 |
933.082 |
|
|
|
|
|
|
|
4. |
Other
Income |
1.306 |
5.962 |
8.957 |
|
|
|
|
|
|
|
5. |
Profit
Before Interest and Exceptional Items (3+4) |
359.873 |
290.378 |
942.039 |
|
|
|
|
|
|
|
6. |
Interest |
279.511 |
257.129 |
803.120 |
|
|
|
|
|
|
|
7. |
Profit
After Interest but before Exceptional Items (5-6) |
80.362 |
33.249 |
138.919 |
|
|
|
|
|
|
|
8. |
Exceptional
Items |
-- |
-- |
-- |
|
|
|
|
|
|
|
9. |
Profit
from Ordinary Activities before Tax (7+8) |
80.362 |
33.249 |
138.919 |
|
|
|
|
|
|
|
10. |
Tax
Expense |
31.789 |
18.529 |
65.642 |
|
|
|
|
|
|
|
11. |
Net
Profit from Ordinary Activities after Tax (9-10) |
48.573 |
14.720 |
73.277 |
|
|
|
|
|
|
|
12. |
Extraordinary
Item (net of expense) |
-- |
-- |
-- |
|
|
|
|
|
|
|
13. |
Net
Profit for the period (11-12) |
48.573 |
14.720 |
73.277 |
|
|
|
|
|
|
|
14. |
Paid-up
Equity Share Capital (Face Value of Rs.10/- Each) |
147.475 |
147.475 |
147.475 |
|
|
|
|
|
|
|
15. |
Reserves
Excluding Revaluation Reserve |
-- |
-- |
-- |
|
|
|
|
|
|
|
16. |
Basic and Diluted Earning Per
Share (EPS) (Rs.)-Not Annualised |
|
|
|
|
|
a)
Basic and diluted EPS before extraordinary items |
0.66 |
0.20 |
1.01 |
|
|
b)
Basic and diluted EPS after extraordinary items |
0.63 |
0.19 |
0.98 |
|
|
|
|
|
|
|
17. |
Public Shareholding |
|
|
|
|
|
-Number
of Shares |
39088972 |
39088972 |
39088972 |
|
|
-
Percentage of Shareholding |
53.01 |
3.01 |
53.01 |
|
|
|
|
|
|
|
18. |
Promoters and Promoter Group
Shareholding |
|
|
|
|
|
a) Pledged/Encumbered |
|
|
|
|
|
-
Number of Shares |
Nil |
Nil |
Nil |
|
|
- Percentage
of Shares (as a % of the Total Shareholding of promoter and promoter group) |
Nil |
Nil |
Nil |
|
|
-
Percentage of Shares (as a % of the Total Share Capital of the Company) |
Nil |
Nil |
Nil |
|
|
|
|
|
|
|
|
b) Non Encumbered |
|
|
|
|
|
-
Number of Shares |
34648466 |
34648466 |
34648466 |
|
|
-
Percentage of Shares (as a % of the Total Shareholding of Promoter and
Promoter Group) |
100% |
100% |
100% |
|
|
-
Percentage of Shares (as a % of the Total Share Capital of the Company) |
46.99 |
46.99 |
46.99 |
|
Particulars |
3 MONTHS ENDED 31.12.2013 |
|
Pending at the beginning of the quarter |
Nil |
|
Received during the quarter |
23 |
|
Disposed of during the quarter |
23 |
|
Remaining unresolved at the end of the
quarter |
Nil |
SEGMENT WISE REVENUE,
RESULTS AND CAPITAL EMPLOYED
Rs. In Millions
|
Particulars |
Quarter
Ended |
Nine
Months Ended |
|
|
31.12.2013 |
30.09.2013 |
31.12.2013 |
|
|
Unaudited |
Unaudited |
Unaudited |
|
|
Segment Revenue |
|
|
|
|
Cables |
3727.257 |
3430.120 |
10346.604 |
|
Stainless Steel Wire |
236.030 |
241.241 |
689.848 |
|
Turnkey Projects |
146.844 |
110.456 |
479.730 |
|
TOTAL |
4110.131 |
3781.817 |
11516.182 |
|
|
|
|
|
|
Less : Inter Segment Revenue (Net of Excise) |
-- |
-- |
-- |
|
|
|
|
|
|
Net Sales / Income
from Operation |
4110.131 |
3781.817 |
11516.182 |
|
|
|
|
|
|
Segment Results |
|
|
|
|
Cables |
451.728 |
416.064 |
1269.006 |
|
Stainless Steel Wire |
17.100 |
9.926 |
45.461 |
|
Turnkey Projects |
5.813 |
(4.753) |
3.124 |
|
TOTAL |
474.641 |
421.237 |
1317.591 |
|
|
|
|
|
|
Less :Interest |
279.511 |
257.128 |
803.120 |
|
Less : Other Unallocable Expenses and Extra Ordinary Items |
114.768 |
130.860 |
375.552 |
|
NET PROFIT (+) /
LOSS(-) BEFORE TAX |
80.362 |
33.249 |
138.919 |
|
|
|
|
|
|
Capital Employed |
|
|
|
|
Cables |
6942.590 |
6632.436 |
6942.590 |
|
Stainless Steel Wire |
175.155 |
136.253 |
175.155 |
|
Turnkey Projects |
1023.395 |
999.878 |
1023.395 |
|
Unallocated Segment |
(3301.331) |
(2790.604) |
(3301.331) |
|
TOTAL |
4839.809 |
4977.963 |
4839.809 |
NOTES:
- The above
financial results reviewed by the audit committee, have been approved and
taken on record by the board of directors at their meeting held on January
29, 2014.
- The statutory
auditors of the company have carried out Limited Review of Financial Results
for the quarter and nine months ended December 31, 2013 pursuant to clause
41 of the listing agreement.
- Pursuant to
changes made in AS-11 vide companies (Accounting Standard) Amendment
Rules, 2009, further amended vide Amendment Rules, 2011, during the
quarter/nine months period foreign exchange difference arising on long
term foreign currency monetary items-Foreign Currency Term Loan/ECB has
been adjusted in foreign currency monetary item Translation Differences
Account [FCMITDA]
- The share
allotment committee of the board of directors at its meeting held on
11.07.2013, have issued and allotted 3500000 equity shares at a price of
Rs.14/- per equity share (including premium of Rs.12/-) and 3500000
warrants convertible into equivalent number of equity shares @ Rs.14/- per
equity share (including premium of Rs.12/- per share) on preferential
basis to promoter group in accordance with SEBI (ICDR) Regulations, 2009.
As a result of allotment of equity shares, paid up equity share capital of
the company has increased form 70237438 equity share of Rs.2/- each to
73737438 equity shares of Rs.2/- each.
- During the
quarter and nine months ended 31st December, 2013, Tax Expense
includes deferred tax of Rs.15.000 Millions and Rs.35.000 Millions on
estimated basis respectively.
- Previous
year/periods figures have been regrouped/reclassified, wherever necessary.
CMT REPORT (Corruption, Money Laundering & Terrorism]
The Public Notice information has been collected from various sources including
but not limited to: The Courts,
1] INFORMATION ON
DESIGNATED PARTY
No exist designating subject or any of its beneficial owners,
controlling shareholders or senior officers as terrorist or terrorist organization
or whom notice had been received that all financial transactions involving
their assets have been blocked or convicted, found guilty or against whom a
judgement or order had been entered in a proceedings for violating
money-laundering, anti-corruption or bribery or international economic or
anti-terrorism sanction laws or whose assets were seized, blocked, frozen or
ordered forfeited for violation of money laundering or international
anti-terrorism laws.
2] Court Declaration :
No exist to suggest that subject is or was
the subject of any formal or informal allegations, prosecutions or other
official proceeding for making any prohibited payments or other improper
payments to government officials for engaging in prohibited transactions or
with designated parties.
3] Asset Declaration :
No exist to suggest that the property or assets of the subject are
derived from criminal conduct or a prohibited transaction.
4] Record on Financial
Crime :
Charges or conviction
registered against subject: None
5] Records on Violation of
Anti-Corruption Laws :
Charges or
investigation registered against subject: None
6] Records on Int’l
Anti-Money Laundering Laws/Standards :
Charges or
investigation registered against subject: None
7] Criminal Records
No
available information exist that suggest that subject or any of its principals
have been formally charged or convicted by a competent governmental authority
for any financial crime or under any formal investigation by a competent government
authority for any violation of anti-corruption laws or international anti-money
laundering laws or standard.
8] Affiliation with
Government :
No record
exists to suggest that any director or indirect owners, controlling
shareholders, director, officer or employee of the company is a government
official or a family member or close business associate of a Government
official.
9] Compensation Package :
Our market
survey revealed that the amount of compensation sought by the subject is fair
and reasonable and comparable to compensation paid to others for similar
services.
10] Press Report :
No press reports / filings exists on
the subject.
CORPORATE GOVERNANCE
MIRA INFORM as part of its Due Diligence do provide comments on
Corporate Governance to identify management and governance. These factors often
have been predictive and in some cases have created vulnerabilities to credit
deterioration.
Our Governance Assessment focuses principally on the interactions
between a company’s management, its Board of Directors, Shareholders and other
financial stakeholders.
CONTRAVENTION
Subject is not known to have contravened any existing local laws,
regulations or policies that prohibit, restrict or otherwise affect the terms and
conditions that could be included in the agreement with the subject.
FOREIGN EXCHANGE RATES
|
Currency |
Unit
|
Indian Rupees |
|
US Dollar |
1 |
Rs.60.32 |
|
|
1 |
Rs.100.04 |
|
Euro |
1 |
Rs.82.65 |
INFORMATION DETAILS
|
Analysis Done by
: |
KAR |
|
|
|
|
Report Prepared
by : |
TPT |
SCORE & RATING EXPLANATIONS
|
SCORE FACTORS |
RANGE |
POINTS |
|
HISTORY |
1~10 |
6 |
|
PAID-UP CAPITAL |
1~10 |
5 |
|
OPERATING SCALE |
1~10 |
6 |
|
FINANCIAL CONDITION |
|
|
|
--BUSINESS SCALE |
1~10 |
6 |
|
--PROFITABILIRY |
1~10 |
5 |
|
--LIQUIDITY |
1~10 |
5 |
|
--LEVERAGE |
1~10 |
5 |
|
--RESERVES |
1~10 |
5 |
|
--CREDIT LINES |
1~10 |
6 |
|
--MARGINS |
-5~5 |
-- |
|
DEMERIT POINTS |
|
|
|
--BANK CHARGES |
YES/NO |
YES |
|
--LITIGATION |
YES/NO |
YES |
|
--OTHER ADVERSE INFORMATION |
YES/NO |
NO |
|
MERIT POINTS |
|
|
|
--SOLE DISTRIBUTORSHIP |
YES/NO |
NO |
|
--EXPORT ACTIVITIES |
YES/NO |
NO |
|
--AFFILIATION |
YES/NO |
YES |
|
--LISTED |
YES/NO |
YES |
|
--OTHER MERIT FACTORS |
YES/NO |
YES |
|
DEFAULTER |
|
|
|
--RBI |
YES/NO |
NO |
|
--EPF |
YES/NO |
NO |
|
TOTAL |
|
49 |
This score serves as a reference to assess
SC’s credit risk and to set the amount of credit to be extended. It is
calculated from a composite of weighted scores obtained from each of the major
sections of this report. The assessed factors and their relative weights (as
indicated through %) are as follows:
Financial
condition (40%) Ownership
background (20%) Payment
record (10%)
Credit history
(10%) Market trend (10%) Operational size
(10%)
RATING EXPLANATIONS
|
RATING |
STATUS |
PROPOSED CREDIT LINE |
|
|
>86 |
Aaa |
Possesses an extremely sound financial base with the strongest capability
for timely payment of interest and principal sums |
Unlimited |
|
71-85 |
Aa |
Possesses adequate working capital. No caution needed for credit
transaction. It has above average (strong) capability for payment of interest
and principal sums |
Large |
|
56-70 |
A |
Financial & operational base are regarded healthy. General
unfavourable factors will not cause fatal effect. Satisfactory capability for
payment of interest and principal sums |
Fairly Large |
|
41-55 |
Ba |
Overall operation is considered normal. Capable to meet normal
commitments. |
Satisfactory |
|
26-40 |
B |
Capability to overcome financial difficulties seems comparatively
below average. |
Small |
|
11-25 |
Ca |
Adverse factors are apparent. Repayment of interest and principal sums
in default or expected to be in default upon maturity |
Limited with
full security |
|
<10 |
C |
Absolute credit risk exists. Caution needed to be exercised |
Credit not
recommended |
|
-- |
NB |
New Business |
-- |
This report is issued at your request without any
risk and responsibility on the part of MIRA INFORM PRIVATE LIMITED (MIPL)
or its officials.