MIRA
INFORM REPORT
|
Report Date : |
08.04.2014 |
IDENTIFICATION DETAILS
|
Name : |
MARKLEEN TERRA SL |
|
|
|
|
Registered Office : |
P.I. Rio Gallego, 22 Calle
E. - San Mateo De Gallego - 50840 - Zaragoza |
|
|
|
|
Country : |
Spain |
|
|
|
|
Financials (as on) : |
2012 |
|
|
|
|
Date of Incorporation : |
21.03.1994 |
|
|
|
|
Legal Form : |
Private Company |
|
|
|
|
Line of Business : |
engaged in engineering and manufacturing of
equipment’s to avoid hydrocarbons spill. |
|
|
|
|
No. of Employees |
Not Available |
RATING & COMMENTS
|
MIRA’s Rating : |
Ba |
|
RATING |
STATUS |
PROPOSED CREDIT LINE |
|
|
41-55 |
Ba |
Overall operation is considered normal. Capable to meet normal
commitments. |
Satisfactory |
|
Maximum Credit Limit : |
305.000 Euro (€) |
|
|
|
|
Status : |
Satisfactory |
|
|
|
|
Payment Behaviour : |
Slow but Correct |
|
|
|
|
Litigation : |
Clear |
NOTES :
Any query related to this report can be made
on e-mail : infodept@mirainform.com
while quoting report number, name and date.
ECGC Country Risk Classification List – december 01, 2013
|
Country Name |
Previous Rating (30.09.2013) |
Current Rating (01.12.2013) |
|
Spain |
A2 |
A2 |
|
Risk Category |
ECGC
Classification |
|
Insignificant |
A1 |
|
Low |
A2 |
|
Moderate |
B1 |
|
High |
B2 |
|
Very High |
C1 |
|
Restricted |
C2 |
|
Off-credit |
D |
Spain ECONOMIC OVERVIEW
Spain experienced a prolonged
recession in the wake of the global financial crisis. GDP contracted by 3.7% in
2009, ending a 16-year growth trend, and continued contracting through most of
2013. Economic growth resumed in late 2013, albeit only modestly, as credit
contraction in the private sector, fiscal austerity, and high unemployment
continued to weigh on domestic consumption and investment. Exports, however,
have been resilient throughout the economic downturn, partially offsetting
declines in domestic consumption and helped to bring Spain's current account
into surplus in 2013 for the first time since 1986. The unemployment rate rose
from a low of about 8% in 2007 to more than 26% in 2013, straining Spain's
public finances as spending on social benefits increased while tax revenues
fell. Spain's budget deficit peaked at 11.1% of GDP in 2009. Spain gradually reduced
the deficit to 6.8% of GDP in 2013, slightly above the 6.5% target negotiated
between Spain and the EU. Public debt has increased substantially - from 70.4%
in 2010 to 93.7% in 2013. Rising labor productivity, moderating labor costs,
and lower inflation have helped to improve foreign investor interest in the
economy and to reduce government borrowing costs. The government's ongoing
efforts to implement reforms - labor, pension, health, tax, and education - are
aimed at supporting investor sentiment. The government also has shored up
struggling banks exposed to Spain's depressed domestic construction and real
estate sectors by successfully completing an EU-funded restructuring and
recapitalization program in December 2013.
|
Source : CIA |
EXECUTIVE SUMMARY
|
Name: |
MARKLEEN
TERRA SL |
|
NIF
/ Fiscal code: |
B50579101 |
|
Status: |
ACTIVE |
|
Incorporation
Date: |
21/03/1994 |
|
Register
Data |
Register
Section 8 Sheet 13870 |
|
Last
Publication in BORME: |
07/10/2010
[Annual accounts' deposit] |
|
Last
Published Account Deposit: |
2012 |
|
Share
Capital: |
86.357,69 |
|
|
|
|
Localization: |
P.I.
RIO GALLEGO, 22 CALLE E. - SAN MATEO DE GALLEGO - 50840 - ZARAGOZA |
|
Telephone
- Fax - Email - Website: |
Ph.:.
976211044 |
|
|
|
|
Activity: |
|
|
NACE: |
7219
- Other research and experimental development on natural sciences and
engineering |
|
Registered
Trademarks: |
|
|
Audited
/ Opinion: |
Si / |
|
Tenders
and Awards: |
8
for a total cost of NaN |
|
Subsidies: |
5
for a total cost of 103708.35 |
|
Quality
Certificate: |
No |
|
Strong
capacity to meet its credit obligations. However, this rating may deteriorate
in the event of moderately adverse changes in the financial environment. |
|||||
|
Maximum
recommended commercial credit: |
305.000
Euro (€) |
||||
|
|
|||||
|
Defaults,
Legal Claims and Insolvency Proceedings : |
|||||
|
|
|
Number |
Amount (€) |
Most Recent Entry |
|
|
Insolvency
Proceedings, Bankruptcy and Suspension of Payments |
|
Unpublished |
--- |
--- |
|
|
Defaults
on debt with Financial Institutions and Large Companies |
|
None |
--- |
--- |
|
|
Judicial
Claims (Notices, Executive Proceedings, Attachments, Auctions, Bad Debt) |
|
None |
0 |
--- |
|
|
Proceedings
heard by the Civil Court |
|
Unpublished |
0 |
--- |
|
|
Proceedings
heard by the Labour Court |
|
Unpublished |
0 |
--- |
|
|
Partners: |
||
|
MARKLEEN
MANAGEMENT SL |
100
% |
|
|
Shares: |
2 |
|
|
Other
Links: |
2 |
|
|
No.
of Active Corporate Bodies: |
SINGLE
ADMINISTRATOR 1 |
|
|
Guarantees: |
|
|
Properties
Registered: |
Company
NO, Administrator NO |
|
Financing
/ Guarantee Sources : |
Sources
YES, Guarantees NO |
|
|
|
INVESTIGATION SUMMARY |
|
|
The company was set up several years ago so it has a lot of experience in the sector and has a good concept in general among the sources consulted. Its turnover increased a 46,39 % in 2012 , compared with the previous year. The company meets normally its payment engagements. |
|
Identification |
|
|
Social
Denomination: |
MARKLEEN TERRA SL |
|
NIF
/ Fiscal code: |
B50579101 |
|
Corporate
Status: |
ACTIVE |
|
Start
of activity: |
1994 |
|
Registered
Office: |
P.I. RIO GALLEGO, 22 CALLE
E. |
|
Locality: |
SAN MATEO DE GALLEGO |
|
Province: |
ZARAGOZA |
|
Postal
Code: |
50840 |
|
Telephone: |
976211044 |
Branch Offices
|
Activity |
|
|
NACE: |
7219 |
|
Additional
Information: |
The subject is engaged in
engineering and manufacturing of equipment’s to avoid hydrocarbons spill. |
|
Additional
Address: |
Registered office, factory,
warehouse, offices, shed, and other premises, all owned by the company, are
located in P.I. RIO GALLEGO, 22 CALLE E. 50840 SAN MATEO DE GALLEGO (
ZARAGOZA ). |
|
Import
/ export: |
IMPORT / EXPORT |
|
Future
Perspective: |
Consolidation |
|
Industry
situation: |
Maturity |
Chronological
Summary
|
|
Year |
Act |
|
|
|
1994 |
Appointments/ Re-elections
(2) Company Formation (1) |
|
|
|
1995 |
Accounts deposit (ejer. 1994) Increase of Capital (1) |
|
|
|
1996 |
Accounts deposit (ejer. 1995) |
|
|
|
1997 |
Accounts deposit (ejer. 1996) Adaptation to Law (1) Appointments/
Re-elections (1) Cessations/ Resignations/ Reversals (1) Increase of Capital
(1) |
|
|
|
1998 |
Accounts deposit (ejer. 1997) |
|
|
|
1999 |
Accounts deposit (ejer. 1998) |
|
|
|
2000 |
Accounts deposit (ejer. 1999) Change of Social address (1) |
|
|
|
2001 |
Accounts deposit (ejer. 2000) |
|
|
|
2002 |
Accounts deposit (ejer. 2001) Appointments/ Re-elections (2) Cessations/
Resignations/ Reversals (1) Change of Social Denomination (1) Statutory
Modifications (1) |
|
|
|
2003 |
Accounts deposit (ejer. 2002) Appointments/ Re-elections (1) Cessations/
Resignations/ Reversals (2) Declaration of Sole Propietorship
(1) Increase of Capital (1) Statutory Modifications (1) |
|
|
|
2004 |
Appointments/ Re-elections
(3) |
|
|
|
2005 |
Accounts deposit (ejer. 2003, 2004) |
|
|
|
2006 |
Appointments/ Re-elections
(1) |
|
|
|
2007 |
Accounts deposit (ejer. 2005, 2006) |
|
|
|
2008 |
Accounts deposit (ejer. 2007) Appointments/ Re-elections (1) Cessations/
Resignations/ Reversals (1) |
|
|
|
2009 |
Accounts deposit (ejer. 2008) |
|
|
|
2010 |
Accounts deposit (ejer. 2009) |
|
|
|
2012 |
Accounts deposit (ejer. 2010) |
|
|
|
2013 |
Accounts deposit (ejer. 2011, 2012) |
|
Breakdown of
Owners' Equity
|
Registered
Capital: |
86.357,69 |
|
Paid
up capital: |
86.357,69 |
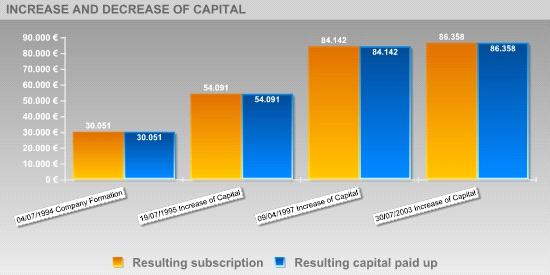
Updated Evolution of the Subscribed and Paid-in Capital
|
|
|||||
|
|
|
|
|
|
|
|
Publishing Date |
Registration Type |
Capital Subscribed |
Paid up capital |
Underwritten result |
Disbursed Result |
|
04/07/1994 |
Company Formation |
30.051 |
30.051 |
30.051 |
30.051 |
|
19/07/1995 |
Increase of Capital |
24.040 |
24.040 |
54.091 |
54.091 |
|
09/04/1997 |
Increase of Capital |
30.051 |
30.051 |
84.142 |
84.142 |
|
30/07/2003 |
Increase of Capital |
2.218 |
2.218 |
86.358 |
86.358 |
Active Social Bodies
|
Post published |
Social Body's Name |
Appointment Date |
Other Positions in this
Company |
|
SINGLE PARTNER |
MARKLEEN MANAGEMENT SL |
10/09/2003 |
2 |
|
SINGLE ADMINISTRATOR |
MARKLEEN MANAGEMENT SL |
10/09/2003 |
2 |
|
COMBINED PROXY |
ALCAINE ABAD ANA ISABEL |
14/11/2008 |
1 |
|
|
GOING INVESTMENT GESTION
SA S G E C R |
14/11/2008 |
1 |
|
JOINT ATTORNEY |
AISA PEREZ LAURA |
14/11/2008 |
2 |
|
|
CABREJAS LOPEZ JAVIER |
27/02/2004 |
1 |
|
|
SALDAÑA GRACIA JORGE MARIA |
27/02/2004 |
1 |
|
JOINT ATTORNEY/COMBINED
PROXY |
ODENA ROMEO ALFONSO |
14/11/2008 |
3 |
|
|
PETER ANDERS OYE |
02/12/2002 |
5 |
|
ACCOUNTS' AUDITOR / HOLDER |
POSTIGO AUDITORES SL |
16/01/2004 |
1 |
Historical Social Bodies
|
Social Body's Name |
Post published |
End Date |
Other Positions in this
Company |
|
AISA PEREZ LAURA |
JOINT ATTORNEY |
14/11/2008 |
2 |
|
GONZALEZ PEREZ PILAR |
SECRETARY |
09/04/1997 |
7 |
|
|
SECRETARY |
02/12/2002 |
|
|
|
MEMBER OF THE BOARD |
02/12/2002 |
|
|
|
PROXY |
02/12/2002 |
|
|
|
JOINT ADMINISTRATOR |
10/09/2003 |
|
|
|
JOINT ATTORNEY/COMBINED
PROXY |
10/09/2003 |
|
|
|
PROXY |
10/09/2003 |
|
|
JON ANDERS NYGAARD |
JOINT ADMINISTRATOR |
10/09/2003 |
8 |
|
|
MEMBER OF THE BOARD |
09/04/1997 |
|
|
|
MEMBER OF THE BOARD |
02/12/2002 |
|
|
|
PROXY |
02/12/2002 |
|
|
|
PROXY |
10/09/2003 |
|
|
|
PRESIDENT |
09/04/1997 |
|
|
|
PRESIDENT |
02/12/2002 |
|
|
|
JOINT ATTORNEY/COMBINED
PROXY |
10/09/2003 |
|
|
ODENA ROMEO ALFONSO |
JOINT ATTORNEY/COMBINED
PROXY |
18/05/2006 |
3 |
|
|
PROXY |
14/11/2008 |
|
|
ODENA ROMERO ALFONSO |
JOINT ATTORNEY |
14/11/2008 |
1 |
|
PETER ANDERS OYE |
MEMBER OF THE BOARD |
02/12/2002 |
5 |
|
|
MEMBER OF THE BOARD |
09/04/1997 |
|
|
|
JOINT ADMINISTRATOR |
10/09/2003 |
|
|
|
PROXY |
02/12/2002 |
|
Defaults, Legal Claims and Insolvency Proceedings
Section enabling assessment of the degree of compliance of the company queried with its payment obligations. It provides information on the existence and nature of all stages of Insolvency and Legal Proceedings published with reference to the Company in the country's various Official Bulletins and national newspapers, as well Defaults Registered in the main national credit bureaus (ASNEF Industrial and RAI ).
> Summary
Chronological summary
|
|
|
Number
of Publications |
Amount
(_) |
Start
date |
End
date |
|
Insolvency
Proceedings, Bankruptcy and Suspension of Payments |
|
Unpublished |
--- |
--- |
--- |
|
Request/Declaration |
|
0 |
--- |
date |
|
|
Proceedings |
|
--- |
--- |
|
--- |
|
Resolution |
|
--- |
--- |
|
--- |
|
Defaults
on debt with Financial Institutions and Large Companies |
Bank and Commercial Delinquency |
None |
0 |
|
|
|
Status:
Friendly |
|
--- |
|
|
|
|
Status:
Pre-Litigation |
|
--- |
|
|
|
|
Status:
Litigation |
|
--- |
|
|
|
|
Status:
Non-performing |
|
--- |
|
|
|
|
Status:
insolvency proceedings, bankruptcy and suspension of payments |
|
--- |
|
|
|
|
Other
status |
|
--- |
|
|
|
|
Legal
and Administrative Proceedings |
|
Unpublished |
--- |
|
|
|
Notices
of defaults and enforcement |
|
--- |
--- |
|
--- |
|
Seizures |
|
--- |
--- |
|
--- |
|
Auctions |
|
--- |
--- |
|
--- |
|
Declarations
of insolvency and bad debt |
|
--- |
--- |
|
--- |
|
Proceedings
heard by the Civil Court |
|
Unpublished |
--- |
|
|
|
Proceedings
heard by the Labour Court |
|
Unpublished |
--- |
|
|
> Details
|
Basis for rating Positive Factors |
|
No judicial claims have been detected in the Official Gazettes, regarding any Company's outstanding debts with the Tax Bureau or Social Security administrations, as submitted by Courts of the various court jurisdictions. It has been found to have regular payment performance and has paid all of its debts in a timely manner. Significant level of financial autonomy. The asset is financed mostly with equity and financing with maturity exceeding one year, providing a solid financial structure. The current debt represents a 33.37of the financial structure. In principle, a decrease in this ratio would indicate an improvement in the short-term financial situation. MARKLEEN TERRA SL obtains economic profitability from the necessary investments in the development of its activity in comparison with its assets. |
Probability of
default
> Probabilidad
Estimada de Impago para los próximos
12 meses: 0.517 %
> Latest Rating Changes :
|
Sector
in which comparison is carried out : 721 Research
and experimental development on natural sciences and engineering |
|
|
Relative
Position:
|
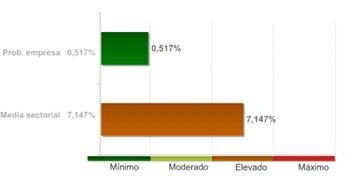
The company's comparative analysis with the rest of the companies that comprise the sector, shows the company holds a better position with regard to the probability of non-compliance.
The 99.00% of the companies of the sector MARKLEEN TERRA SL belongs to show a higher probability of non-compliance
The probability of the company's non-compliance with its payment obligations within deadlines estimated by our qualifications models is 0.52%.
In the event they fail to comply with the payment, the seriousness of the loss will depend on factors such as the promptness of the commencement of the charging management, the existence of executive documents which match the credit or the existence of guarantees and free debt assets under the name of the debtor. Therefore, the probability of non-compliance should not be solely interpreted as the total loss of the owed amount.
Recommended commercial credit
Favourable
until 305.000 Euro
(Guideline value of outstanding commercial balance)
Result of query
submitted to the R.A.I.
(Spanish Bad Debt
Register) on
|
LEGAL CLAIMS |
|
Summary of Judicial Claims |
|
|
|
|
|
|
|
No se han publicado
|
|
|
|
No se han publicado
|
|
|
|
|
|
|
|
No se han publicado
|
|
|
|
No se han publicado
|
|
|
|
No se han publicado
|
|
|
|
No se han publicado
|
|
|
|
|
|
|
|
No se han publicado
|
|
|
|
No se han publicado
|
|
|
|
|
|
|
|
No se han publicado
|
Guarantees
References
Link List
|
HAS IN ITS ADMINISTRATION
BOARD TO: |
2 Entities |
|
PARTICIPATES IN: |
2 Entities |
|
SHAREHOLDERS: |
1 Entities |
> Shareholders
|
Relationship |
Entity |
Province |
Shareholding stake |
|
SHAREHOLDERS |
MARKLEEN MANAGEMENT SL |
ZARAGOZA |
100 |
|
PARTICIPATES IN |
MARKLEEN SALVAGE SL |
ZARAGOZA |
100 |
|
|
MARKLEEN AS |
|
100 |
> Other relationships
|
Relationship |
Entity |
Province |
Shareholding stake |
|
HAS IN ITS ADMINISTRATION
BOARD TO |
MARKLEEN MANAGEMENT SL |
ZARAGOZA |
|
|
|
GOING INVESTMENT GESTION
S.A. S.G.E.C.R. |
ZARAGOZA |
|
Turnover
|
Total
Sales 2013 |
6.800.000 |
Financial Accounts and Balance Sheets
Financial Years
Presented
|
Ejercicio |
Tipo de Cuentas
Anuales |
Fecha Presentacion |
|
2012 |
Normales |
July
2013 |
|
2011 |
Normales |
March
2013 |
|
2010 |
Normales |
March
2012 |
|
2009 |
Normales |
September
2010 |
|
2008 |
Normales |
November
2009 |
|
2007 |
Normales |
September
2008 |
|
2006 |
Normales |
October
2007 |
|
2005 |
Normales |
December
2006 |
|
2004 |
Normales |
September
2005 |
|
2003 |
Normales |
December
2004 |
|
2002 |
Normales |
September
2003 |
|
2001 |
Normales |
September
2002 |
|
2000 |
Normales |
September
2001 |
|
1999 |
Normales |
September
2000 |
|
1998 |
Normales |
November
1999 |
|
1997 |
Normales |
September
1998 |
|
1996 |
Normales |
September
1997 |
|
1995 |
Normales |
September
1996 |
|
1994 |
Normales |
August
1995 |
The data in the report regarding the last Company Accounts submitted by the company is taken from the TRADE REGISTER serving the region in which the company's address is located 31/12/2012
> Balance en
formato Pyme de acuerdo al Nuevo Plan General Contable
2007
Information corresponding to the fiscal year 2012 2011 2010 2009 2008 is taken from information submitted to the TRADE REGISTER. Data corresponding to fiscal years before 2012 2011 2010 2009 2008 has been compiled based on the equivalence criteria stipulated in Act JUS/206/2009. Where the provisions of the Act did not establish relevant equivalence criteria
|
|
ORIGINAL |
ORIGINAL |
ORIGINAL |
ORIGINAL |
ORIGINAL |
|
|
Assets |
2012 |
2011 |
2010 |
2009 |
2008 |
|
|
A)
NON-CURRENT ASSETS: 11000 |
1.125.186,00 |
1.339.099,00 |
1.232.296,00 |
1.300.907,00 |
655.589,00 |
|
|
I. Intangible fixed assets : 11100 |
89.603,00 |
112.496,00 |
81.533,00 |
84.631,00 |
53.713,00 |
|
|
II. Tangible fixed assets : 11200 |
296.135,00 |
309.998,00 |
251.082,00 |
282.288,00 |
353.703,00 |
|
|
III. Real estate investment: 11300 |
0,00 |
0,00 |
0,00 |
0,00 |
0,00 |
|
|
IV. Long-term investments in Group companies and associates :
11400 |
515.600,00 |
556.680,00 |
417.027,00 |
208.694,00 |
138.694,00 |
|
|
V. Long-term financial investments: 11500 |
2.423,00 |
2.423,00 |
196.827,00 |
558.969,00 |
57.175,00 |
|
|
VI. Assets for deferred tax : 11600 |
221.425,00 |
357.502,00 |
285.827,00 |
166.325,00 |
52.305,00 |
|
|
VII. Non-current trade debtors : 11700 |
0,00 |
0,00 |
0,00 |
0,00 |
0,00 |
|
|
B)
CURRENT ASSETS: 12000 |
2.699.027,00 |
2.603.201,00 |
2.150.761,00 |
2.302.283,00 |
3.905.705,00 |
|
|
I. Stocks : 12200 |
954.277,00 |
1.696.782,00 |
1.417.487,00 |
1.404.494,00 |
1.420.830,00 |
|
|
II. Trade debtors and others receivable accounts : 12300 |
1.079.731,00 |
563.122,00 |
500.400,00 |
843.873,00 |
2.355.773,00 |
|
|
1. Trade debtors / accounts receivable: 12380 |
803.627,00 |
443.799,00 |
306.191,00 |
710.206,00 |
1.712.753,00 |
|
|
a) Long-term
receivables from sales and services supplied : 12381 |
0,00 |
0,00 |
0,00 |
0,00 |
0,00 |
|
|
b) Customers for sales
and provisions of services : 12382 |
803.627,00 |
443.799,00 |
306.191,00 |
710.206,00 |
1.712.753,00 |
|
|
2. Called up share capital: 12370 |
0,00 |
0,00 |
0,00 |
0,00 |
0,00 |
|
|
3. Other accounts receivable : 12390 |
276.104,00 |
119.323,00 |
194.208,00 |
133.667,00 |
643.020,00 |
|
|
III. Short-term investment in Group companies and associates:
12400 |
44.085,00 |
4.085,00 |
585,00 |
0,00 |
0,00 |
|
|
IV. Short-term financial investments : 12500 |
149.362,00 |
182.362,00 |
1.160,00 |
1.160,00 |
1.235,00 |
|
|
V. Short-term accruals : 12600 |
1.692,00 |
1.692,00 |
2.055,00 |
0,00 |
0,00 |
|
|
VI. Cash and other equivalent liquid assets : 12700 |
469.879,00 |
155.158,00 |
229.075,00 |
52.756,00 |
127.867,00 |
|
|
TOTAL
ASSETS (A + B) : 10000 |
3.824.213,00 |
3.942.300,00 |
3.383.057,00 |
3.603.190,00 |
4.561.295,00 |
|
|
|
ORIGINAL |
ORIGINAL |
ORIGINAL |
ORIGINAL |
ORIGINAL |
|
|
Liabilities
and Net Worth |
2012 |
2011 |
2010 |
2009 |
2008 |
|
|
A)
NET WORTH: 20000 |
2.297.295,00 |
2.076.242,00 |
2.241.479,00 |
2.519.570,00 |
2.776.290,00 |
|
|
A-1)
Shareholders' equity: 21000 |
2.297.295,00 |
2.076.242,00 |
2.241.240,00 |
2.517.080,00 |
2.766.413,00 |
|
|
I. Capital: 21100 |
86.358,00 |
86.358,00 |
86.358,00 |
86.358,00 |
86.358,00 |
|
|
1. Registered capital : 21110 |
86.358,00 |
86.358,00 |
86.358,00 |
86.358,00 |
86.358,00 |
|
|
2. (Uncalled capital): 21120 |
0,00 |
0,00 |
0,00 |
0,00 |
0,00 |
|
|
II. Share premium: 21200 |
92.256,00 |
92.256,00 |
92.256,00 |
92.256,00 |
92.256,00 |
|
|
III. Reserves: 21300 |
2.587.800,00 |
2.587.800,00 |
2.587.800,00 |
2.587.800,00 |
2.058.341,00 |
|
|
IV. (Common stock equity): 21400 |
0,00 |
0,00 |
0,00 |
0,00 |
0,00 |
|
|
V. Profit or loss brought forward: 21500 |
-690.173,00 |
-546.963,00 |
-249.333,00 |
0,00 |
0,00 |
|
|
VI. Other shareholders'
contributions: 21600 |
0,00 |
0,00 |
0,00 |
0,00 |
0,00 |
|
|
VII. Result of the period: 21700 |
221.054,00 |
-143.209,00 |
-275.841,00 |
-249.333,00 |
529.459,00 |
|
|
VIII. (Interim dividend): 21800 |
0,00 |
0,00 |
0,00 |
0,00 |
0,00 |
|
|
A-2)
Changes in net worth : 22000 |
0,00 |
0,00 |
0,00 |
0,00 |
0,00 |
|
|
A-3)
Received subsidies, donations and legacies: 23000 |
0,00 |
0,00 |
239,00 |
2.490,00 |
9.877,00 |
|
|
B)
NON-CURRENT LIABILITIES: 31000 |
250.836,00 |
263.951,00 |
317.617,00 |
177.329,00 |
262.139,00 |
|
|
I. Long-term provisions: 31100 |
92.792,00 |
0,00 |
0,00 |
0,00 |
0,00 |
|
|
II. Long-term creditors : 31200 |
104.322,00 |
207.452,00 |
312.896,00 |
169.187,00 |
246.769,00 |
|
|
1. Amounts owed to credit institutions:
31220 |
104.322,00 |
207.452,00 |
238.614,00 |
138.614,00 |
206.005,00 |
|
|
2. Creditors from financial leasing :
31230 |
0,00 |
0,00 |
0,00 |
0,00 |
0,00 |
|
|
3. Other long-term creditors : 31290 |
0,00 |
0,00 |
74.282,00 |
30.573,00 |
40.764,00 |
|
|
III. Long-term debts with Group companies and associates:
31300 |
52.350,00 |
53.900,00 |
0,00 |
0,00 |
0,00 |
|
|
IV. Liabilities for deferred tax: 31400 |
1.372,00 |
2.599,00 |
4.721,00 |
8.142,00 |
15.370,00 |
|
|
V. Long-term accruals: 31500 |
0,00 |
0,00 |
0,00 |
0,00 |
0,00 |
|
|
VI. Non-current trade creditors : 31600 |
0,00 |
0,00 |
0,00 |
0,00 |
0,00 |
|
|
VII. Special long-term debts : 31700 |
0,00 |
0,00 |
0,00 |
0,00 |
0,00 |
|
|
C)
CURRENT LIABILITIES : 32000 |
1.276.082,00 |
1.602.107,00 |
823.961,00 |
906.292,00 |
1.522.865,00 |
|
|
I. Short-term provisions: 32200 |
0,00 |
0,00 |
0,00 |
0,00 |
0,00 |
|
|
II. Short-term creditors : 32300 |
202.418,00 |
294.976,00 |
12.132,00 |
-45.542,00 |
64.935,00 |
|
|
1. Amounts owed to credit institutions:
32320 |
203.816,00 |
286.182,00 |
12.729,00 |
-44.919,00 |
64.935,00 |
|
|
2. Creditors from financial leasing :
32330 |
0,00 |
0,00 |
0,00 |
0,00 |
0,00 |
|
|
3. Other short-term creditors :
32390 |
-1.397,00 |
8.794,00 |
-597,00 |
-623,00 |
0,00 |
|
|
III. Short-term amounts owed to group and associated companies:
32400 |
0,00 |
0,00 |
0,00 |
1.915,00 |
1.915,00 |
|
|
IV. Trade creditors and other accounts payable: 32500 |
1.073.664,00 |
1.307.131,00 |
811.829,00 |
949.919,00 |
1.456.015,00 |
|
|
1. Suppliers: 32580 |
971.313,00 |
980.842,00 |
734.874,00 |
874.892,00 |
1.285.853,00 |
|
|
a) Long-term debts :
32581 |
0,00 |
0,00 |
0,00 |
0,00 |
0,00 |
|
|
b) Short-term debts :
32582 |
971.313,00 |
980.842,00 |
734.874,00 |
874.892,00 |
1.285.853,00 |
|
|
2. Other creditors: 32590 |
102.351,00 |
326.289,00 |
76.955,00 |
75.027,00 |
170.163,00 |
|
|
V. Short-term accruals : 32600 |
0,00 |
0,00 |
0,00 |
0,00 |
0,00 |
|
|
VI. Special short-term debts : 32700 |
0,00 |
0,00 |
0,00 |
0,00 |
0,00 |
|
|
TOTAL
NET WORTH AND LIABILITIES (A + B + C) : 30000 |
3.824.213,00 |
3.942.300,00 |
3.383.057,00 |
3.603.190,00 |
4.561.295,00 |
|
|
|
ORIGINAL |
ORIGINAL |
ORIGINAL |
ORIGINAL |
ORIGINAL |
|
|
Profit
and Loss |
2012 |
2011 |
2010 |
2009 |
2008 |
|
|
1. Net turnover: 40100 |
6.752.062,00 |
4.612.374,00 |
3.474.800,00 |
3.147.359,00 |
5.080.272,00 |
|
|
2. Changes in stocks of finished goods and work in progress:
40200 |
-639.660,00 |
419.231,00 |
170.776,00 |
-73.877,00 |
258.845,00 |
|
|
3. Works carried out by the company for its assets: 40300 |
0,00 |
29.932,00 |
21.400,00 |
41.876,00 |
0,00 |
|
|
4. Supplies : 40400 |
-2.932.266,00 |
-2.734.735,00 |
-1.728.851,00 |
-1.231.364,00 |
-2.020.654,00 |
|
|
5. Other operating income: 40500 |
6.069,00 |
8.735,00 |
3.538,00 |
5.522,00 |
0,00 |
|
|
6. Personnel costs: 40600 |
-1.358.611,00 |
-1.436.606,00 |
-1.142.235,00 |
-1.064.460,00 |
-1.215.590,00 |
|
|
7. Other operating costs: 40700 |
-1.289.501,00 |
-981.131,00 |
-1.089.977,00 |
-1.090.179,00 |
-1.406.419,00 |
|
|
8. Amortisation of fixed assets:
40800 |
-122.500,00 |
-71.135,00 |
-92.347,00 |
-118.765,00 |
-153.494,00 |
|
|
9. Allocation of subsidies of non-financial fixed assets and
other: 40900 |
0,00 |
341,00 |
3.215,00 |
10.553,00 |
9.177,00 |
|
|
10. Excess provisions : 41000 |
0,00 |
0,00 |
0,00 |
0,00 |
0,00 |
|
|
11. Impairment and result of transfers of fixed assets:
41100 |
0,00 |
0,00 |
3.446,00 |
2.000,00 |
1.735,00 |
|
|
12. Other results : 41300 |
0,00 |
0,00 |
-433,00 |
3.442,00 |
2.075,00 |
|
|
A)
OPERATING INCOME (1 + 2 + 3 + 4 + 5 + 6 + 7 + 8 + 9 + 10 + 11 + 12) :
49100 |
415.593,00 |
-152.994,00 |
-376.668,00 |
-367.893,00 |
555.946,00 |
|
|
13. Financial income : 41400 |
1.509,00 |
1.636,00 |
5.348,00 |
1.950,00 |
22.934,00 |
|
|
a) Allocation of financial subsidies,
donations and legacies: 41430 |
0,00 |
0,00 |
0,00 |
0,00 |
0,00 |
|
|
b) Other financial income: 41490 |
1.509,00 |
1.636,00 |
5.348,00 |
1.950,00 |
22.934,00 |
|
|
14. Financial expenditure : 41500 |
-39.857,00 |
-41.067,00 |
-26.094,00 |
-16.765,00 |
-10.569,00 |
|
|
15. Changes in fair value of financial instruments :
41600 |
0,00 |
0,00 |
0,00 |
0,00 |
0,00 |
|
|
16. Exchange rate differences: 41700 |
-21.339,00 |
-24.480,00 |
-384,00 |
15.292,00 |
15.122,00 |
|
|
17. Impairment and result for transfers of financial
instruments : 41800 |
0,00 |
0,00 |
0,00 |
0,00 |
0,00 |
|
|
18. Other financial income and expenditure: 42100 |
0,00 |
0,00 |
0,00 |
0,00 |
0,00 |
|
|
a) Incorporation of financial expenditure
to assets: 42110 |
0,00 |
0,00 |
0,00 |
0,00 |
0,00 |
|
|
b) Financial income from arrangement with
creditors: 42120 |
0,00 |
0,00 |
0,00 |
0,00 |
0,00 |
|
|
c) Other income and expenditure:
42130 |
0,00 |
0,00 |
0,00 |
0,00 |
0,00 |
|
|
B)
FINANCIAL REVENUE ( 13 + 14 + 15 + 16 + 17 +18 ) : 49200 |
-59.687,00 |
-63.911,00 |
-21.130,00 |
477,00 |
27.486,00 |
|
|
C)
NET RESULT BEFORE TAXES ( A + B ) : 49300 |
355.906,00 |
-216.905,00 |
-397.799,00 |
-367.416,00 |
583.432,00 |
|
|
19. Income taxes : 41900 |
-134.851,00 |
73.696,00 |
121.958,00 |
118.083,00 |
-53.973,00 |
|
|
D)
RESULT OF THE PERIOD ( C + 19 ) : 49500 |
221.054,00 |
-143.209,00 |
-275.841,00 |
-249.333,00 |
529.459,00 |
|
> Normal Balance Sheet under the rules of the 1990 General Accounting Plan (repealed since 1st January of 2008)
Information corresponding to the fiscal year 2012 2011 2010 2009 2008 has been compiled based on the equivalence criteria stipulated in Act JUS/206/2009. Where the provisions of the Act did not establish relevant equivalence criteria
|
|
EQUIVALENCIA |
EQUIVALENCIA |
EQUIVALENCIA |
EQUIVALENCIA |
EQUIVALENCIA |
|
|
ASSETS |
2012 |
2011 |
2010 |
2009 |
2008 |
|
|
A)
SHAREHOLDERS (PARTNERS) BY UNCALLED SUSCRIBED CAPITAL: |
0,00 |
0,00 |
0,00 |
0,00 |
0,00 |
|
|
B)
FIXED ASSETS: |
903.761,00 |
981.597,00 |
946.469,00 |
1.134.582,00 |
603.285,00 |
|
|
I. Formation expenses: |
0,00 |
0,00 |
0,00 |
0,00 |
0,00 |
|
|
II. Intangible fixed assets: |
89.603,00 |
112.496,00 |
81.533,00 |
84.631,00 |
53.713,00 |
|
|
III. Tangible fixed assets: |
296.135,00 |
309.998,00 |
251.082,00 |
282.288,00 |
353.703,00 |
|
|
IV. Financial investments: |
518.023,00 |
559.103,00 |
613.854,00 |
767.663,00 |
195.869,00 |
|
|
V. Own shares: |
0,00 |
0,00 |
0,00 |
0,00 |
0,00 |
|
|
VI. Long-term trade receivables: |
0,00 |
0,00 |
0,00 |
0,00 |
0,00 |
|
|
C)
Deferred expenses: |
0,00 |
0,00 |
0,00 |
0,00 |
0,00 |
|
|
D)
CURRENT ASSETS: |
2.920.452,00 |
2.960.703,00 |
2.436.587,00 |
2.468.609,00 |
3.958.010,00 |
|
|
I. Called-up share capital (not paid): |
0,00 |
0,00 |
0,00 |
0,00 |
0,00 |
|
|
II. Stocks: |
954.277,00 |
1.696.782,00 |
1.417.487,00 |
1.404.494,00 |
1.420.830,00 |
|
|
III. Debtors: |
1.301.157,00 |
920.624,00 |
786.226,00 |
1.010.198,00 |
2.408.077,00 |
|
|
IV. Short-term investments: |
193.447,00 |
186.447,00 |
1.745,00 |
1.160,00 |
1.235,00 |
|
|
V. Short-term treasury shares: |
0,00 |
0,00 |
0,00 |
0,00 |
0,00 |
|
|
VI. Cash at bank and in hand: |
469.879,00 |
155.158,00 |
229.075,00 |
52.756,00 |
127.867,00 |
|
|
VII. Prepayments and accrued income: |
1.692,00 |
1.692,00 |
2.055,00 |
0,00 |
0,00 |
|
|
GENERAL
TOTAL (A + B + C + D): |
3.824.213,00 |
3.942.300,00 |
3.383.057,00 |
3.603.190,00 |
4.561.295,00 |
|
MERCANTILE
REGISTRY.
|
|
EQUIVALENCIA |
EQUIVALENCIA |
EQUIVALENCIA |
EQUIVALENCIA |
EQUIVALENCIA |
|
|
LIABILITIES |
2012 |
2011 |
2010 |
2009 |
2008 |
|
|
A)
EQUITY: |
2.297.295,00 |
2.076.242,00 |
2.241.240,00 |
2.517.080,00 |
2.766.413,00 |
|
|
I. Subscribed capital: |
86.358,00 |
86.358,00 |
86.358,00 |
86.358,00 |
86.358,00 |
|
|
II. Share premium: |
92.256,00 |
92.256,00 |
92.256,00 |
92.256,00 |
92.256,00 |
|
|
III. Revaluation reserves: |
0,00 |
0,00 |
0,00 |
0,00 |
0,00 |
|
|
IV. Reserves: |
2.587.800,00 |
2.587.800,00 |
2.587.800,00 |
2.587.800,00 |
2.058.341,00 |
|
|
a) Differences for capital adjustment to
euros: |
2,00 |
2,00 |
2,00 |
2,00 |
2,00 |
|
|
b) Remaining Reserves: |
2.587.798,00 |
2.587.798,00 |
2.587.798,00 |
2.587.798,00 |
2.058.339,00 |
|
|
V. Profit or loss brought forward: |
-690.173,00 |
-546.963,00 |
-249.333,00 |
0,00 |
0,00 |
|
|
VI. Profit or loss for the financial year: |
221.054,00 |
-143.209,00 |
-275.841,00 |
-249.333,00 |
529.459,00 |
|
|
VII. Interim dividend paid: |
0,00 |
0,00 |
0,00 |
0,00 |
0,00 |
|
|
VIII. Own shares for capital reduction: |
0,00 |
0,00 |
0,00 |
0,00 |
0,00 |
|
|
B)
Deferred income: |
0,00 |
0,00 |
239,00 |
2.490,00 |
9.877,00 |
|
|
C)
PROVISIONS FOR LIABILITIES AND CHARGES: |
92.792,00 |
0,00 |
0,00 |
0,00 |
0,00 |
|
|
D)
LONG TERM LIABILITIES: |
158.044,00 |
263.951,00 |
317.617,00 |
177.329,00 |
262.139,00 |
|
|
E)
SHORT TERM CREDITORS: |
1.276.082,00 |
1.602.107,00 |
823.961,00 |
906.292,00 |
1.522.865,00 |
|
|
F)
SHORT-TERM PROVISIONS FOR LIABILITIES AND CHARGES: |
0,00 |
0,00 |
0,00 |
0,00 |
0,00 |
|
|
GENERAL
TOTAL (A + B + C + D + E + F): |
3.824.213,00 |
3.942.300,00 |
3.383.057,00 |
3.603.190,00 |
4.561.295,00 |
|
MERCANTILE
REGISTRY.
|
|
EQUIVALENCIA |
EQUIVALENCIA |
EQUIVALENCIA |
EQUIVALENCIA |
EQUIVALENCIA |
|
|
DEBIT |
2012 |
2011 |
2010 |
2009 |
2008 |
|
|
A)
CHARGES (A.1 to A.15): |
6.538.586,00 |
4.796.227,00 |
3.787.587,00 |
3.477.327,00 |
4.601.855,00 |
|
|
A.1. Operating consumption: |
3.571.926,00 |
2.315.504,00 |
1.558.075,00 |
1.305.241,00 |
1.761.809,00 |
|
|
A.2. Staff Costs: |
1.358.611,00 |
1.436.606,00 |
1.142.235,00 |
1.064.460,00 |
1.215.590,00 |
|
|
a) Wages, salaries et
al.: |
966.479,00 |
1.021.963,00 |
812.555,00 |
757.228,00 |
864.738,00 |
|
|
b) Social security
costs: |
392.132,00 |
414.643,00 |
329.680,00 |
307.232,00 |
350.852,00 |
|
|
A.3. Depreciation expense: |
122.500,00 |
71.135,00 |
92.347,00 |
118.765,00 |
153.494,00 |
|
|
A.4. Variation of trade provisions and losses
of unrecovered receivables: |
0,00 |
0,00 |
0,00 |
0,00 |
0,00 |
|
|
A.5. Other operating charges: |
1.289.501,00 |
981.131,00 |
1.089.977,00 |
1.090.179,00 |
1.406.419,00 |
|
|
A.I. OPERATING BENEFITS (B.1-A.1-A.2-A.3-A.4-A.5): |
415.593,00 |
0,00 |
0,00 |
0,00 |
542.960,00 |
|
|
A.6. Financial and similar charges: |
39.857,00 |
41.067,00 |
26.094,00 |
16.765,00 |
10.569,00 |
|
|
a) Due to liabilities
with companies of the group: |
4.415,00 |
4.549,00 |
2.891,00 |
1.857,00 |
1.171,00 |
|
|
b) Due to liabilities
with associated companies: |
0,00 |
0,00 |
0,00 |
0,00 |
0,00 |
|
|
c) Due to other
debts: |
35.441,00 |
36.518,00 |
23.204,00 |
14.908,00 |
9.399,00 |
|
|
d) Losses from
financial investments: |
0,00 |
0,00 |
0,00 |
0,00 |
0,00 |
|
|
A.7. Financial investment provision
change: |
0,00 |
0,00 |
0,00 |
0,00 |
0,00 |
|
|
A.8. Exchange losses: |
21.339,00 |
24.480,00 |
384,00 |
0,00 |
0,00 |
|
|
A.II. POSITIVE FINANCIAL RESULTS (B.2+B.3-A.6-A.7-A.8): |
0,00 |
0,00 |
0,00 |
477,00 |
27.486,00 |
|
|
A.III. PROFIT FROM ORDINARY ACTIVITIES (A.I+A.II-B.I-B.II):
|
355.906,00 |
0,00 |
0,00 |
0,00 |
570.446,00 |
|
|
A.9. Changes in provisions for intangible,
tangible and securities portfolio: |
0,00 |
0,00 |
0,00 |
0,00 |
0,00 |
|
|
A.10. Losses from tangible and intangible
fixed assets and portfolio: |
0,00 |
0,00 |
0,00 |
0,00 |
0,00 |
|
|
A.11. Losses from transactions with own
shares and debentures: |
0,00 |
0,00 |
0,00 |
0,00 |
0,00 |
|
|
A.12. Extraordinary expenses: |
0,00 |
0,00 |
433,00 |
0,00 |
0,00 |
|
|
A.13. Prior year expenses and losses:
|
0,00 |
0,00 |
0,00 |
0,00 |
0,00 |
|
|
A.IV. EXTRAORDINARY PROFIT (B.4+B.5+B.6+B.7+B.8-A.9-A.10-A.11-A.12-A.13):
|
0,00 |
341,00 |
6.227,00 |
15.995,00 |
12.986,00 |
|
|
A.V. PROFIT BEFORE TAXES (A.III+A.IV-B.III-B.IV): |
355.906,00 |
0,00 |
0,00 |
0,00 |
583.432,00 |
|
|
A.14. Corporation Tax: |
134.851,00 |
-73.696,00 |
-121.958,00 |
-118.083,00 |
53.973,00 |
|
|
A.15. Miscellaneous taxes: |
0,00 |
0,00 |
0,00 |
0,00 |
0,00 |
|
|
A.VI. FINANCIAL YEAR RESULT (PROFIT) (A.V-A.14-A.15): |
221.054,00 |
0,00 |
0,00 |
0,00 |
529.459,00 |
|
MERCANTILE
REGISTRY.
|
|
EQUIVALENCIA |
EQUIVALENCIA |
EQUIVALENCIA |
EQUIVALENCIA |
EQUIVALENCIA |
|
|
CREDIT |
2012 |
2011 |
2010 |
2009 |
2008 |
|
|
B)
INCOME ( B.1 to B.8): |
6.759.640,00 |
4.653.018,00 |
3.511.747,00 |
3.227.994,00 |
5.131.314,00 |
|
|
B.1. Operating income: |
6.758.131,00 |
4.651.041,00 |
3.499.738,00 |
3.194.757,00 |
5.080.272,00 |
|
|
a) Net total sales:
|
6.752.062,00 |
4.612.374,00 |
3.474.800,00 |
3.147.359,00 |
5.080.272,00 |
|
|
b) Miscellaneous
operating income: |
6.069,00 |
38.667,00 |
24.938,00 |
47.398,00 |
0,00 |
|
|
B.I. PÉRDIDAS DE EXPLOTACIÓN (A.1+A.2+A.3+A.4+A.5-B.1 ): |
0,00 |
153.335,00 |
382.895,00 |
383.888,00 |
0,00 |
|
|
B.2. Financial income: |
1.509,00 |
1.636,00 |
5.348,00 |
1.950,00 |
22.934,00 |
|
|
a) Companies of the
group: |
0,00 |
0,00 |
0,00 |
0,00 |
0,00 |
|
|
b) In associated
companies: |
0,00 |
0,00 |
0,00 |
0,00 |
0,00 |
|
|
c) Miscellaneous:
|
1.509,00 |
1.636,00 |
5.348,00 |
1.950,00 |
22.934,00 |
|
|
d) Profit on
financial investment: |
0,00 |
0,00 |
0,00 |
0,00 |
0,00 |
|
|
B.3. Exchange gains: |
0,00 |
0,00 |
0,00 |
15.292,00 |
15.122,00 |
|
|
B.II. NEGATIVE FINANCIAL RESULTS (A.6+A.7+A.8-B.2-B.3): |
59.687,00 |
63.911,00 |
21.130,00 |
0,00 |
0,00 |
|
|
B.III. LOSSES ON ORDINARY ACTIVITIES ( B.I + B.II - A.I - A.II
): |
0,00 |
217.246,00 |
404.026,00 |
383.411,00 |
0,00 |
|
|
B.4. Profit on disposal of both tangible
and intangible fixed assets and securities portfolio: |
0,00 |
0,00 |
3.446,00 |
2.000,00 |
1.735,00 |
|
|
B.5. Profit on transactions with own
shares and debentures: |
0,00 |
0,00 |
0,00 |
0,00 |
0,00 |
|
|
B.6. Capital grants transferred to profit
and loss: |
0,00 |
341,00 |
3.215,00 |
10.553,00 |
9.177,00 |
|
|
B.7. Extraordinary income: |
0,00 |
0,00 |
0,00 |
3.442,00 |
2.075,00 |
|
|
B.8. Income and profit of former financial
years: |
0,00 |
0,00 |
0,00 |
0,00 |
0,00 |
|
|
B.IV. NEGATIVE EXTRAORDINARY RESULTS
(A.9+A.10+A.11+A.12+A.13-B.4-B.5-B.6-B.7-B.8): |
0,00 |
0,00 |
0,00 |
0,00 |
0,00 |
|
|
B.V. LOSSES BEFORE TAXES (B.III+B.IV-A.III-A.IV): |
0,00 |
216.905,00 |
397.799,00 |
367.416,00 |
0,00 |
|
|
B.VI. FINANCIAL YEAR RESULTS (LOSSES) (B.V+A.14+A.15): |
0,00 |
143.209,00 |
275.841,00 |
249.333,00 |
0,00 |
|
MERCANTILE
REGISTRY.
CASH FLOW STATEMENT
Model: Normal
>
Source of information: Data contained in this section is taken from the
information declared in the Annual Accounts submitted to the Trade Register.
|
|
2012 |
2011 |
2010 |
2009 |
2008 |
|
|
1.
Fiscal year result before taxes.: 61100 |
355.906,00 |
-216.905,00 |
-397.799,00 |
-367.416,00 |
583.432,00 |
|
|
2.
Results adjustments.: 61200 |
253.640,00 |
110.566,00 |
113.093,00 |
133.580,00 |
141.130,00 |
|
|
a) Fixed Assets Amortization (+).: 61201 |
122.500,00 |
71.135,00 |
92.347,00 |
118.765,00 |
153.494,00 |
|
|
c) Variation in Provision (+/-). : 61203 |
92.792,00 |
0,00 |
0,00 |
0,00 |
0,00 |
|
|
g) Financial income (-).: 61207 |
-1.509,00 |
-1.636,00 |
-5.348,00 |
-1.950,00 |
-22.934,00 |
|
|
h) Financial Expenses (+). : 61208 |
39.857,00 |
41.067,00 |
26.094,00 |
16.765,00 |
10.569,00 |
|
|
3.
Changes in current capital equity.: 61300 |
-149.423,00 |
42.641,00 |
311.709,00 |
1.140.298,00 |
-1.175.780,00 |
|
|
a) Stock (+/-).: 61301 |
742.505,00 |
-279.295,00 |
-12.993,00 |
16.336,00 |
-197.559,00 |
|
|
d) Debtors and other accounts receivable (+/-). : 61302 |
-516.609,00 |
-62.722,00 |
343.473,00 |
1.511.900,00 |
-961.408,00 |
|
|
c) Other current assets (+/-). : 61303 |
-7.000,00 |
-184.340,00 |
-2.640,00 |
76,00 |
5.078,00 |
|
|
d) Creditors and other accounts payable (+/-). : 61304 |
-368.319,00 |
568.998,00 |
-16.131,00 |
-388.013,00 |
-21.891,00 |
|
|
4.
Other cash flows for operating activities.: 61400 |
-38.348,00 |
-39.431,00 |
-20.747,00 |
-14.814,00 |
12.364,00 |
|
|
a) Interest payments (-). : 61401 |
-39.857,00 |
-41.067,00 |
-26.094,00 |
-16.765,00 |
-10.569,00 |
|
|
c) Interest collection (+). : 61403 |
1.509,00 |
1.636,00 |
5.348,00 |
1.950,00 |
22.934,00 |
|
|
5.
Operating activity cash flows (1 + 2 + 3 + 4) : 61500 |
421.774,00 |
-103.129,00 |
6.257,00 |
891.647,00 |
-438.854,00 |
|
|
6.
Payments for investment (-).: 62100 |
0,00 |
-301.207,00 |
-327.834,00 |
-716.733,00 |
-153.450,00 |
|
|
a) Companies of the group and affiliates. : 62101 |
0,00 |
-139.653,00 |
-208.333,00 |
-70.000,00 |
0,00 |
|
|
b) Intangible fixed assets. : 62102 |
0,00 |
-30.963,00 |
0,00 |
-30.918,00 |
0,00 |
|
|
c) Fixed assets. : 62103 |
0,00 |
-58.916,00 |
0,00 |
0,00 |
-101.145,00 |
|
|
e) Other financial assets. : 62105 |
0,00 |
0,00 |
0,00 |
-501.794,00 |
0,00 |
|
|
h) Other assets. : 62108 |
0,00 |
-71.676,00 |
-119.501,00 |
-114.021,00 |
-52.305,00 |
|
|
7.
Divestment payment collection (+). : 62200 |
213.913,00 |
194.404,00 |
396.445,00 |
71.415,00 |
585.422,00 |
|
|
a) Companies of the group and affiliates. : 62201 |
41.080,00 |
0,00 |
0,00 |
0,00 |
407.737,00 |
|
|
b) Intangible fixed assets. : 62202 |
22.893,00 |
0,00 |
3.098,00 |
0,00 |
9.601,00 |
|
|
c) Fixed assets. : 62203 |
13.863,00 |
0,00 |
31.205,00 |
71.415,00 |
0,00 |
|
|
e) Other financial assets. : 62205 |
0,00 |
194.404,00 |
362.142,00 |
0,00 |
168.084,00 |
|
|
h) Other assets. : 62208 |
136.077,00 |
0,00 |
0,00 |
0,00 |
0,00 |
|
|
8.
Investment activity cash flows (6 + 7) minus Amortization: 62300 |
91.413,00 |
-177.938,00 |
-23.736,00 |
-764.083,00 |
278.478,00 |
|
|
9.
Payment collection and payments for equity instruments. : 63100 |
-2,00 |
-22.028,00 |
-2.250,00 |
-7.387,00 |
658,00 |
|
|
b) Amortization of assets instruments (-). : 63102 |
-2,00 |
-21.789,00 |
0,00 |
0,00 |
-1.591,00 |
|
|
e) Grants, donations and bequests received (+). : 63105 |
0,00 |
-239,00 |
-2.250,00 |
-7.387,00 |
2.248,00 |
|
|
10.
Payment collection and payments for financial liabilities instruments.:
63200 |
-198.464,00 |
229.178,00 |
196.047,00 |
-195.288,00 |
153.754,00 |
|
|
a) Issuance : 63201 |
0,00 |
336.744,00 |
201.383,00 |
0,00 |
153.754,00 |
|
|
2. Debts incurred with credit institutions (+). : 63203 |
0,00 |
273.453,00 |
157.648,00 |
0,00 |
118.791,00 |
|
|
3. Debts incurred with companies of the group and affiliates
(+).: 63204 |
0,00 |
53.900,00 |
0,00 |
0,00 |
42,00 |
|
|
5. Other debts (+). : 63206 |
0,00 |
9.391,00 |
43.736,00 |
0,00 |
34.920,00 |
|
|
b) Repayment and amortization of : 63207 |
-198.464,00 |
-107.566,00 |
-5.336,00 |
-195.288,00 |
0,00 |
|
|
2. Debts incurred with credit institutions (-).: 63209 |
-185.496,00 |
-31.162,00 |
0,00 |
-177.245,00 |
0,00 |
|
|
3. Debts incurred with companies of the group and affiliates
(-). : 63210 |
-1.550,00 |
0,00 |
-1.915,00 |
0,00 |
0,00 |
|
|
5. Other debts (-). : 63212 |
-11.418,00 |
-76.404,00 |
-3.421,00 |
-18.043,00 |
0,00 |
|
|
11.
Payments from dividends and remunerations from other assets instruments. :
63300 |
0,00 |
0,00 |
0,00 |
0,00 |
0,00 |
|
|
12.
Cash flows for financing activities (9+10+11).: 63400 |
-198.466,00 |
207.150,00 |
193.797,00 |
-202.675,00 |
154.412,00 |
|
|
D)
EFECTO DE LAS VARIACIONES DE LOS TIPOS DE CAMBIO: 64000 |
0,00 |
0,00 |
0,00 |
0,00 |
0,00 |
|
|
E)
NET INCREASE/DECREASE OF CASH OR EQUIVALENT ASSETS (+/-5+/-8+/12+/-D) :
65000 |
314.721,00 |
-73.917,00 |
176.318,00 |
-75.111,00 |
-5.964,00 |
|
|
Cash or equivalent assets as of beginning of the fiscal year.:
65100 |
155.158,00 |
229.075,00 |
52.756,00 |
127.867,00 |
133.831,00 |
|
|
Cash or equivalent assets as of end of the fiscal year.:
65200 |
469.879,00 |
155.158,00 |
229.075,00 |
52.756,00 |
127.867,00 |
|
FINANCIAL DIAGNOSIS
>
Economic-Financial Comparative Analysis
Data used in the following ratios and indicators is taken from the
Annual Accounts submitted by the company to the TRADE REGISTER.
>
Comparison within the Sector
|
Cash
Flow |
2012 |
2011 |
Variación 2012 - 2011 |
|
|||
|
|
Empresa |
Sector |
Empresa |
Sector |
Empresa |
Sector |
|
|
Cash
Flow over Sales: |
0,05
% |
0,00
% |
-0,02
% |
0,01
% |
390,85
% |
-104,06
% |
|
|
EBITDA
over Sales: |
7,97
% |
2,62
% |
-1,78
% |
4,34
% |
547,17
% |
-39,55
% |
|
|
Cash
Flow Yield: |
0,08
% |
0,00
% |
-0,02
% |
0,01
% |
538,92
% |
-103,76
% |
|
|
Profitability |
2012 |
2011 |
Variación 2012 - 2011 |
|
|||
|
|
Empresa |
Sector |
Empresa |
Sector |
Empresa |
Sector |
|
|
Operating
economic profitability: |
13,35
% |
0,95
% |
-4,79
% |
1,44
% |
378,97
% |
-34,08
% |
|
|
Total
economic profitability: |
10,35
% |
1,35
% |
-4,46
% |
1,81
% |
332,02
% |
-25,45
% |
|
|
Financial
profitability: |
9,62
% |
-0,34
% |
-6,90
% |
0,39
% |
239,51
% |
-187,53
% |
|
|
Margin:
|
6,15
% |
1,06
% |
-3,29
% |
1,57
% |
286,95
% |
-32,35
% |
|
|
Mark-up:
|
5,27
% |
-0,22
% |
-4,66
% |
0,27
% |
212,92
% |
-182,85
% |
|
|
Solvency |
2012 |
2011 |
Variación 2012 - 2011 |
|
|||
|
|
Empresa |
Sector |
Empresa |
Sector |
Empresa |
Sector |
|
|
Liquidity:
|
0,37 |
0,23 |
0,10 |
0,22 |
280,21 |
8,31 |
|
|
Acid
Test: |
1,37 |
1,07 |
0,56 |
1,02 |
141,88 |
5,42 |
|
|
Working
Capital / Investment: |
0,37 |
0,21 |
0,25 |
0,23 |
46,53 |
-5,33 |
|
|
Solvency:
|
2,29 |
1,79 |
1,85 |
1,76 |
23,84 |
1,99 |
|
|
Indebtedness |
2012 |
2011 |
Variación 2012 - 2011 |
|
|||
|
|
Empresa |
Sector |
Empresa |
Sector |
Empresa |
Sector |
|
|
Indebtedness
level: |
0,60 |
1,08 |
0,90 |
1,36 |
-33,24 |
-20,70 |
|
|
Borrowing
Composition: |
0,12 |
0,80 |
0,16 |
0,83 |
-24,83 |
-3,33 |
|
|
Repayment
Ability: |
4,56 |
-1.451,83 |
-25,25 |
60,69 |
118,05 |
-2.492,18 |
|
|
Warranty:
|
2,67 |
1,93 |
2,11 |
1,74 |
26,22 |
11,02 |
|
|
Generated
resources / Total creditors: |
0,24 |
0,04 |
-0,04 |
0,05 |
720,23 |
-5,81 |
|
|
Efficiency |
2012 |
2011 |
Variación 2012 - 2011 |
|
|||
|
|
Empresa |
Sector |
Empresa |
Sector |
Empresa |
Sector |
|
|
Productivity:
|
1,40 |
1,11 |
0,94 |
1,19 |
48,08 |
-7,34 |
|
|
Turnover
of Collection Rights : |
6,26 |
4,25 |
8,26 |
4,13 |
-24,22 |
2,81 |
|
|
Turnover
of Payment Entitlements: |
3,34 |
2,76 |
3,16 |
2,75 |
5,46 |
0,36 |
|
|
Stock
rotation: |
6,65 |
3,66 |
2,83 |
3,39 |
134,73 |
8,05 |
|
|
Assets
turnover: |
2,17 |
0,90 |
1,45 |
0,92 |
49,23 |
-2,56 |
|
|
Borrowing
Cost: |
2,78 |
2,43 |
2,20 |
2,40 |
26,28 |
1,14 |
|
>
Trend of indicators under the General Accounting Plan of 2007 (2012, 2011,
2010, 2009, 2008)
|
Cash
Flow |
2012 |
2011 |
2010 |
2009 |
2008 |
|
|
Cash
Flow over Sales: |
0,05
% |
-0,02
% |
0,05
% |
-0,02
% |
-0,09
% |
|
|
EBITDA
over Sales: |
7,97
% |
-1,78
% |
-8,36
% |
-8,42
% |
13,71
% |
|
|
Cash
Flow Yield: |
0,08
% |
-0,02
% |
0,05
% |
-0,02
% |
-0,10
% |
|
|
Profitability |
2012 |
2011 |
2010 |
2009 |
2008 |
|
|
Operating
economic profitability: |
13,35
% |
-4,79
% |
-13,59
% |
-13,10
% |
12,69
% |
|
|
Total
economic profitability: |
10,35
% |
-4,46
% |
-10,99
% |
-9,73
% |
13,02
% |
|
|
Financial
profitability: |
9,62
% |
-6,90
% |
-12,31
% |
-9,91
% |
19,14
% |
|
|
Margin:
|
6,15
% |
-3,29
% |
-10,75
% |
-11,62
% |
10,90
% |
|
|
Mark-up:
|
5,27
% |
-4,66
% |
-11,35
% |
-11,61
% |
0,50
% |
|
|
Solvency |
2012 |
2011 |
2010 |
2009 |
2008 |
|
|
Liquidity:
|
0,37 |
0,10 |
0,28 |
0,06 |
0,08 |
|
|
Acid
Test: |
1,37 |
0,56 |
0,89 |
0,99 |
1,63 |
|
|
Working
Capital / Investment: |
0,37 |
0,25 |
0,39 |
0,39 |
0,53 |
|
|
Solvency:
|
2,29 |
1,85 |
2,96 |
2,72 |
2,60 |
|
|
Indebtedness |
2012 |
2011 |
2010 |
2009 |
2008 |
|
|
Indebtedness
level: |
0,60 |
0,90 |
0,51 |
0,43 |
0,64 |
|
|
Borrowing
Composition: |
0,12 |
0,16 |
0,39 |
0,20 |
0,17 |
|
|
Repayment
Ability: |
4,56 |
-25,25 |
6,47 |
-14,43 |
1,50 |
|
|
Warranty:
|
2,67 |
2,11 |
2,96 |
3,33 |
2,56 |
|
|
Generated
resources / Total creditors: |
0,24 |
-0,04 |
-0,16 |
-0,12 |
0,38 |
|
|
Efficiency |
2012 |
2011 |
2010 |
2009 |
2008 |
|
|
Productivity:
|
1,40 |
0,94 |
0,75 |
0,75 |
1,57 |
|
|
Turnover
of Collection Rights : |
6,26 |
8,26 |
6,99 |
3,79 |
2,16 |
|
|
Turnover
of Payment Entitlements: |
3,34 |
3,16 |
3,68 |
2,37 |
2,53 |
|
|
Stock
rotation: |
6,65 |
2,83 |
2,74 |
2,55 |
3,19 |
|
|
Assets
turnover: |
2,17 |
1,45 |
1,26 |
1,13 |
1,16 |
|
|
Borrowing
Cost: |
2,78 |
2,20 |
2,29 |
1,55 |
0,59 |
|
COMPARATIVE SECTORIAL BALANCE
Sector-based
Comparison under the rules of the New General Accounting Plan.
|
|
Variación - |
|
|
|
Empresa |
Sector |
|
|
Variación - |
|
|
|
Empresa |
Sector |
|
|
Variación - |
|
|
|
Empresa |
Sector |
Public Tenders and Works Won
|
|
|
Organisation
that calls the tender: |
|
AUTORIDAD
PORTUARIA DE SANTA CRUZ DE TENERIFE |
|
Objective
of Tender: |
|
Dotación de los
medios de lucha contra la
contaminación marina accidental necesarios
para que la Autoridad Portuaria, debido al acuerdo de colaboración y coordinación conjunta entre los agentes implicados
en el desarrollo de contingencias
que impliquen la activación del PICCMA, pueda actuar de manera eficaz en caso de suceso de contaminación marina
accidental |
|
Date
Awarded: |
|
12/11/2009 |
|
Cost: |
|
418.620,74
EURO. |
|
|
|
Organisation
that calls the tender: |
|
SOCIEDAD
DE SALVAMENTO Y SEGURIDAD MARITIMA SASEMAR |
|
Objective
of Tender: |
|
Suministro de absorbentes
de hidrocarburos para operaciones especiales de lucha contra la contaminación
marina |
|
Date
Awarded: |
|
16/10/2007 |
|
Cost: |
|
564.664,80
EURO. |
|
|
|
Organisation
that calls the tender: |
|
SOCIEDAD
DE SALVAMENTO Y SEGURIDAD MARITIMA SASEMAR |
|
Objective
of Tender: |
|
Suministro de cuarenta
y tres (43) bombas neumáticas destinadas a las unidades de salvamento y lucha contra la contaminación de la Sociedad de
Salvamento y Seguridad Marítima |
|
Date
Awarded: |
|
02/02/2006 |
|
Cost: |
|
131.500,00
EURO. |
|
|
|
Organisation
that calls the tender: |
|
ARSENAL
MILITAR DE FERROL |
|
Objective
of Tender: |
|
Equipos de lucha
contra la contaminación Marítima
por derrame de hidrocarburos |
|
Date
Awarded: |
|
21/09/2005 |
|
Cost: |
|
90.391,06
EURO. |
|
|
|
Organisation
that calls the tender: |
|
SOCIEDAD
DE SALVAMENTO Y SEGURIDAD MARITIMA SASEMAR |
|
Objective
of Tender: |
|
Suministro de ciento
ochenta y cinco jaulas metálicas plegables para el almacenaje y transporte de equipos de lucha contra la contaminación |
|
Date
Awarded: |
|
20/07/2005 |
|
Cost: |
|
146.126,00
EURO. |
|
|
|
Organisation
that calls the tender: |
|
SOCIEDAD
DE SALVAMENTO Y SEGURIDAD MARITIMA SASEMAR |
|
Objective
of Tender: |
|
SUMINISTRO
DE UNA MAQUINA DE LIMPIEZA DE CERCOS PARA LA CONTENCION DE HIDROCARBUROS CON
DESTINO A LA BASE ESTRATEGICA CENTRAL. |
|
Date
Awarded: |
|
28/06/2002 |
|
Cost: |
|
117.753,64
EURO. |
|
|
|
Organisation
that calls the tender: |
|
SOCIEDAD
DE SALVAMENTO Y SEGURIDAD MARITIMA SASEMAR |
|
Objective
of Tender: |
|
SUMINISTRO
DE CUATRO CERCOS DE MAR Y COSTEROS PARA CONTENCION DE HIDROCARBUROS. |
|
Date
Awarded: |
|
27/03/2001 |
|
Cost: |
|
55.500.000
PTS. |
|
|
|
Organisation
that calls the tender: |
|
SOCIEDAD
DE SALVAMENTO Y SEGURIDAD MARITIMA SASEMAR |
|
Objective
of Tender: |
|
SUMINISTRO
DE 20 TANQUES PORTATILES PARA ALMACENAMIENTO DE HIDROCARBUROS |
|
Date
Awarded: |
|
23/02/2001 |
|
Cost: |
|
14.800.000
PTS. |
Detail of Subsidies appearing in Balances Memories
|
Entity |
ORGANISMO
NO ESPECIFICADO |
|
Status |
CONCEDIDA |
|
Amount
Granted |
6.752,97 |
|
Notes |
El
imoprte es el imputado a la cuenta de pérdidas y ganancias. |
|
Entity |
ORGANISMO
NO ESPECIFICADO |
|
Subsidy
Concept |
Subvención de capital |
|
Status |
CONCEDIDA |
|
Amount
Granted |
45.146,28 |
|
Notes |
El
importe referido es el imputado a resultados del ejercicio. |
|
Entity |
DIPUTACION
GENERAL DE ARAGON |
|
Subsidy
Concept |
SUBVENCION
DE EXPLOTACION |
|
Status |
CONCEDIDA |
|
Amount
Granted |
16.230,00 |
|
Notes |
PARA
INVESTIGACION Y DESARROLLO |
|
Entity |
DIPUTACION
GENERAL DE ARAGON |
|
Status |
CONCEDIDA |
|
Amount
Granted |
28.065,07 |
|
Entity |
DIPUTACION
GENERAL DE ARAGON |
|
Status |
CONCEDIDA |
|
Project |
INVESTIGACION
Y DESARROLLO |
|
Amount
Granted |
7.514,03 |
Research Summary
|
The company was set up several years ago so it has a lot of experience in the sector and has a good concept in general among the sources consulted. Its turnover increased a 46,39 % in 2012 , compared with the previous year. The company meets normally its payment engagements. |
FOREIGN EXCHANGE RATES
|
Currency |
Unit
|
Indian Rupees |
|
US Dollar |
1 |
Rs.59.95 |
|
UK Pound |
1 |
Rs.99.36 |
|
Euro |
1 |
Rs.82.15 |
INFORMATION DETAILS
|
Analysis Done by
: |
DIV |
|
|
|
|
Report Prepared
by : |
MNL |
RATING EXPLANATIONS
|
RATING |
STATUS |
PROPOSED CREDIT LINE |
|
|
|
>86 |
Aaa |
Possesses an extremely sound financial base with the strongest
capability for timely payment of interest and principal sums |
Unlimited |
|
|
71-85 |
Aa |
Possesses adequate working capital. No caution needed for credit
transaction. It has above average (strong) capability for payment of interest
and principal sums |
Large |
|
|
56-70 |
A |
Financial & operational base are regarded healthy. General unfavourable factors will not cause fatal effect.
Satisfactory capability for payment of interest and principal sums |
Fairly Large |
|
|
41-55 |
Ba |
Overall
operation is considered normal. Capable to meet normal commitments. |
Satisfactory |
|
|
26-40 |
B |
Capability to overcome financial difficulties seems comparatively
below average. |
Small |
|
|
11-25 |
Ca |
Adverse factors are apparent. Repayment of interest and principal sums
in default or expected to be in default upon maturity |
Limited with
full security |
|
|
<10 |
C |
Absolute credit risk exists. Caution needed to be exercised |
Credit not
recommended |
|
|
-- |
NB |
New Business |
-- |
|
This score serves as a reference to assess SC’s credit risk
and to set the amount of credit to be extended. It is calculated from a
composite of weighted scores obtained from each of the major sections of this
report. The assessed factors and their relative weights (as indicated through
%) are as follows:
Financial
condition (40%) Ownership
background (20%) Payment
record (10%)
Credit history
(10%) Market trend
(10%) Operational
size (10%)
This report is issued at your request without any
risk and responsibility on the part of MIRA INFORM PRIVATE LIMITED (MIPL)
or its officials.