MIRA INFORM REPORT
|
Report Date : |
09.04.2014 |
IDENTIFICATION DETAILS
|
Name : |
TRADEBE SOCIEDAD ANONIMA |
|
|
|
|
Registered Office : |
C/ Punta Sollana, 12., Zierbena, Vizcaya, 48508 |
|
|
|
|
Country : |
Spain |
|
|
|
|
Financials (as on) : |
31.12.2011 |
|
|
|
|
Date of Incorporation : |
03.03.1986 |
|
|
|
|
Legal Form : |
Public Limited
Company |
|
|
|
|
Line of Business : |
Collection and integral treatment of waste of Marpol (marine
pollution) and used oils with industrial origin. |
|
|
|
|
No. of Employees : |
35 |
RATING & COMMENTS
|
MIRA’s Rating : |
Ba |
|
RATING |
STATUS |
PROPOSED CREDIT LINE |
|
|
41-55 |
Ba |
Overall operation is considered normal. Capable to meet normal
commitments. |
Satisfactory |
|
Maximum Credit Limit : |
1.215.000 EURO |
|
Status : |
Satisfactory |
|
Payment Behaviour : |
No complaints |
|
Litigation : |
Clear |
NOTES :
Any query related to this report can be made
on e-mail : infodept@mirainform.com
while quoting report number, name and date.
ECGC Country Risk Classification List – September 30, 2013
|
Country Name |
Previous Rating (30.06.2013) |
Current Rating (30.09.2013) |
|
Spain |
A2 |
A2 |
|
Risk Category |
ECGC
Classification |
|
Insignificant |
A1 |
|
Low |
A2 |
|
Moderate |
B1 |
|
High |
B2 |
|
Very High |
C1 |
|
Restricted |
C2 |
|
Off-credit |
D |
SPAIN - ECONOMIC OVERVIEW
Spain experienced a prolonged
recession in the wake of the global financial crisis. GDP contracted by 3.7% in
2009, ending a 16-year growth trend, and continued contracting through most of
2013. Economic growth resumed in late 2013, albeit only modestly, as credit
contraction in the private sector, fiscal austerity, and high unemployment
continued to weigh on domestic consumption and investment. Exports, however,
have been resilient throughout the economic downturn, partially offsetting
declines in domestic consumption and helped to bring Spain's current account
into surplus in 2013 for the first time since 1986. The unemployment rate rose
from a low of about 8% in 2007 to more than 26% in 2013, straining Spain's
public finances as spending on social benefits increased while tax revenues
fell. Spain’s budget deficit peaked at 11.4% of GDP in 2009. Spain gradually
reduced the deficit to just under 7% of GDP in 2013, slightly above the 6.5%
target negotiated between Spain and the EU. Public debt has increased
substantially – from 60.1% of GDP in 2010 to 93.4% in 2013. Rising labor
productivity, moderating labor costs, and lower inflation have helped to
improve foreign investor interest in the economy and to reduce government
borrowing costs. The government's ongoing efforts to implement reforms - labor,
pension, health, tax, and education - are aimed at supporting investor
sentiment. The government also has shored up struggling banks exposed to
Spain's depressed domestic construction and real estate sectors by successfully
completing an EU-funded restructuring and recapitalization program in December
2013.
|
Source
: CIA |
EXECUTIVE
SUMMARY
|
Name: |
TRADEBE SOCIEDAD ANONIMA |
|
NIF / Fiscal code: |
A48192108 |
|
Trade Name |
TRADEBE |
|
Status: |
ACTIVE WITH PARTIAL DIVISION OF CAPITAL |
|
Incorporation Date: |
03/03/1986 |
|
Register Data |
Register Section 8 Sheet 497 |
|
Last Publication
in BORME: |
19/12/2013 [Appointments] |
|
Last Published Account Deposit: |
2011 |
|
Share Capital: |
402.630,88 |
|
|
|
|
Localization: |
C/ PUNTA SOLLANA, 12. - ZIERBENA - 48508 - VIZCAYA |
|
Telephone - Fax - Email - Website: |
Ph.:. 944836726 Emailtra. info@debe.com
Website. www.tradebe.com |
|
|
|
|
Activity: |
|
|
NACE: |
3822 - Treatment and disposal of hazardous waste |
|
Registered Trademarks: |
|
|
Audited / Opinion: |
No |
|
Tenders and Awards: |
0 for a total cost of 0 |
|
Subsidies: |
2 for a total cost of 134364.43 |
|
Quality Certificate: |
No |
|
|
|
|
Rating and Risk: |
|
|
Maximum recommended commercial credit: |
1.215.000 EURO |
|
|
|
|
Defaults, Legal
Claims and Insolvency Proceedings : |
|
|
|
|
|
Number |
Amount (€) |
Most Recent Entry |
|
Insolvency Proceedings, Bankruptcy and Suspension of Payments |
|
Unpublished |
--- |
--- |
|
Defaults on debt with Financial Institutions and Large Companies |
|
None |
--- |
--- |
|
Judicial Claims (Notices, Executive Proceedings, Attachments, Auctions,
Bad Debt) |
|
2 |
0 |
--- |
|
Proceedings heard by the Civil Court |
|
Unpublished |
0 |
--- |
|
Proceedings heard by the Labour Court |
|
Unpublished |
0 |
--- |
|
|
|
Partners: |
|
|
|
GRUPO TRADEBE MEDIOAMBIENTE SL |
100 % |
|
|
Shares: |
1 |
|
|
Other Links: |
4 |
|
|
No. of Active Corporate Bodies: |
SINGLE ADMINISTRATOR 1 |
|
|
Ratios |
2011 |
2010 |
Change |
|
|
|
|
|
Guarantees: |
|
|
Properties Registered: |
Company NO, Administrator NO |
|
Financing / Guarantee Sources : |
Sources YES, Guarantees NO |
|
|
|
|
|
|
|
INVESTIGATION
SUMMARY |
|
|
Collection and integral treatment of waste of Marpol (marine
pollution) and used oils with industrial origin. It belongs to the group
GRUPO TRADEBE |
|
Identification
|
Social
Denomination: |
TRADEBE SOCIEDAD ANONIMA |
|
Trade Name: |
TRADEBE |
|
NIF / Fiscal
code: |
A48192108 |
|
Corporate
Status: |
ACTIVE WITH PARTIAL DIVISION OF CAPITAL |
|
Start of
activity: |
1986 |
|
Registered
Office: |
C/ PUNTA SOLLANA, 12. |
|
Locality: |
ZIERBENA |
|
Province: |
VIZCAYA |
|
Postal Code: |
48508 |
|
Telephone: |
944836726 |
|
Website: |
www.tradebe.com |
|
Email: |
info@tradebe.com |
Activity
|
NACE: |
3822 |
|
Additional
Information: |
Collection and integral treatment of waste of Marpol (marine
pollution) and used oils with industrial origin. It belongs to the group
GRUPO TRADEBE In 13/01/2003 the subject was partially spun off in the company
GRUPO TRADEBE MEDIOAMBIENTE SL |
|
Additional
Address: |
Registered office, offices, recycling plant and other premises, all
owned by the company, are located in C/ PUNTA SOLLANA, 12. , 48508 ZIERBENA
(VIZCAYA). |
|
Import / export: |
DOES NOT IMPORT / DOES NOT EXPORT |
|
Future
Perspective: |
Product / service improvement |
|
Industry
situation: |
Maturity |
Number
of Employees
|
|
Year |
No. of employees |
Established |
Incidentals |
|
|
|
2014 |
35 |
|
|
|
Chronological
Summary
|
|
Year |
Act |
|
|
|
1990 |
Accounts deposit (ejer. 1989) Appointments/ Re-elections (5)
Cessations/ Resignations/ Reversals (2) Increase of Capital (1) Statutory
Modifications (1) |
|
|
|
1991 |
Adaptation to Law (1) Appointments/ Re-elections (1) Increase of Capital
(1) |
|
|
|
1992 |
Accounts deposit (ejer. 1990, 1991) Appointments/ Re-elections (1)
Cessations/ Resignations/ Reversals (1) |
|
|
|
1993 |
Appointments/ Re-elections (2) Capital Reduction (1) Cessations/ Resignations/
Reversals (2) Increase of Capital (1) |
|
|
|
1994 |
Accounts deposit (ejer. 1992) Appointments/ Re-elections (1) Statutory
Modifications (1) |
|
|
|
1995 |
Accounts deposit (ejer. 1993, 1994) Appointments/ Re-elections (1) Cessations/
Resignations/ Reversals (1) |
|
|
|
1996 |
Accounts deposit (ejer. 1995) Appointments/ Re-elections (1)
Cessations/ Resignations/ Reversals (1) |
|
|
|
1997 |
Accounts deposit (ejer. 1996) Appointments/ Re-elections (2) Cessations/
Resignations/ Reversals (1) |
|
|
|
1998 |
Accounts deposit (ejer. 1997) Appointments/ Re-elections (2)
Cessations/ Resignations/ Reversals (1) Change of Social address (1) |
|
|
|
1999 |
Accounts deposit (ejer. 1998) Appointments/ Re-elections (1) |
|
|
|
2000 |
Accounts deposit (ejer. 1999) Appointments/ Re-elections (2)
Cessations/ Resignations/ Reversals (3) |
|
|
|
2001 |
Accounts deposit (ejer. 2000) Appointments/ Re-elections (1) |
|
|
|
2002 |
Accounts deposit (ejer. 2001) Appointments/ Re-elections (3)
Cessations/ Resignations/ Reversals (2) Partial split (4) Statutory
Modifications (1) |
|
|
|
2003 |
Accounts deposit (ejer. 2002) Appointments/ Re-elections (1) Capital
Reduction (1) Partial split (1) |
|
|
|
2004 |
Accounts deposit (ejer. 2003) |
|
|
|
2005 |
Accounts deposit (ejer. 2004) |
|
|
|
2006 |
Accounts deposit (ejer. 2005) Appointments/ Re-elections (2)
Cessations/ Resignations/ Reversals (1) |
|
|
|
2008 |
Accounts deposit (ejer. 2006, 2007) Appointments/ Re-elections (1)
Cessations/ Resignations/ Reversals (1) Change of Social address (1)
Statutory Modifications (1) |
|
|
|
2009 |
Accounts deposit (ejer. 2008) Appointments/ Re-elections (2)
Cessations/ Resignations/ Reversals (2) |
|
|
|
2010 |
Accounts deposit (ejer. 2009) Appointments/ Re-elections (1) Cessations/
Resignations/ Reversals (1) |
|
|
|
2011 |
Accounts deposit (ejer. 2010) Appointments/ Re-elections (1) |
|
|
|
2012 |
Accounts deposit (ejer. 2011) Cessations/ Resignations/ Reversals (2) |
|
|
|
2013 |
Appointments/ Re-elections (2) Cessations/ Resignations/ Reversals (1) |
|
Breakdown
of Owners' Equity
|
Registered
Capital: |
402.630,88 |
|
Paid up capital: |
402.630,88 |
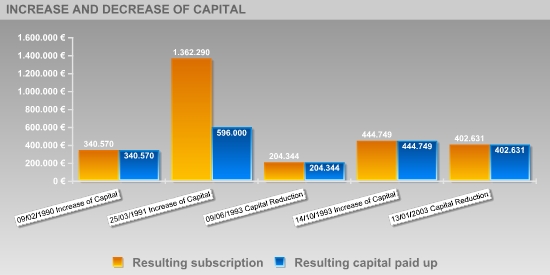
Updated
Evolution of the Subscribed and Paid-in Capital
|
|
|
|
|
|
|
|
|
|||||
|
|
|
|
|
|
|
|
Publishing Date |
Registration Type |
Capital Subscribed |
Paid up capital |
Underwritten result |
Disbursed Result |
|
09/02/1990 |
Increase of Capital |
238.397 |
238.397 |
340.570 |
340.570 |
|
25/03/1991 |
Increase of Capital |
1.021.721 |
255.430 |
1.362.290 |
596.000 |
|
09/06/1993 |
Capital Reduction |
-1.157.946 |
-1.157.946 |
204.344 |
204.344 |
|
14/10/1993 |
Increase of Capital |
240.405 |
240.405 |
444.749 |
444.749 |
|
13/01/2003 |
Capital Reduction |
-42.118 |
-42.118 |
402.631 |
402.631 |
Active
Social Bodies
|
Post published |
Social Body's Name |
Appointment Date |
Other Positions in this Company |
|
SINGLE ADMINISTRATOR |
SECOND CODE SOCIEDAD LIMITADA |
11/12/2013 |
6 |
|
COMBINED PROXY |
ZALDUA RODRIGUEZ GACHS JOSE IGNACIO |
14/01/2009 |
1 |
|
|
BORRELL PAPACEIT JORDI |
14/01/2009 |
1 |
|
|
DIEZ QUINTANILLA ALBERTO |
14/01/2009 |
1 |
|
|
GAZULLA PLANELLES ALEJANDRO |
14/01/2009 |
1 |
|
JOINT ATTORNEY/COMBINED PROXY |
PINEDA CALVO MIRIAM |
14/01/2009 |
1 |
|
|
ALEX GAZULLA PLANELLAS |
07/02/2003 |
1 |
|
|
BERNABE CRESPO ALONSO |
07/02/2003 |
1 |
|
|
GRAVES SANCHEZ MIGUEL |
07/02/2003 |
1 |
|
|
RUIZ FELTRER CARLOS |
07/02/2003 |
1 |
|
PROXY |
CREIXELL SUREDA JORDI |
05/11/2013 |
4 |
|
|
NUÑEZ ZORRILLA CARLOS |
25/03/2011 |
1 |
|
|
CASAÑAS BAIGET JOSE |
21/06/2010 |
1 |
|
|
LLORENS MALUQUER BERNARDO |
29/11/2006 |
1 |
|
|
CREIXELL SUREDA JOSE |
13/03/1997 |
9 |
Historical
Social Bodies
|
Social Body's Name |
Post published |
End Date |
Other Positions in this Company |
|
AGUIRRE ALLENDE ANTONIO |
PRESIDENT |
03/11/1993 |
1 |
|
AGUIRRE ALLENDE JOSE ANTONIO |
MEMBER OF THE BOARD |
19/02/1990 |
10 |
|
|
PROXY |
22/10/1990 |
|
|
|
PROXY |
30/10/1990 |
|
|
|
VICE CHAIRMAN |
01/12/1992 |
|
|
|
VICE CHAIRMAN |
04/12/1995 |
|
|
|
MEMBER OF THE BOARD |
04/12/1995 |
|
|
|
CHIEF EXECUTIVE OFFICER |
04/12/1995 |
|
|
|
MEMBER OF THE BOARD |
23/05/2000 |
|
|
|
PROXY |
11/01/2012 |
|
|
|
ADMINISTRATOR |
09/02/1990 |
|
|
AYESTARAN PICABEA ANTONIO |
ADMINISTRATOR |
09/02/1990 |
1 |
|
BACHRACH ERNEST |
MEMBER |
03/11/1993 |
3 |
|
|
MEMBER OF THE BOARD |
13/03/1997 |
|
|
|
MEMBER OF THE BOARD |
17/06/2002 |
|
|
BAYABO SARRATE ALFREDO |
SECRETARY |
30/10/1990 |
1 |
|
BAYANO SARRATE ALFREDO |
MEMBER OF THE BOARD |
19/02/1990 |
2 |
|
|
MEMBER OF THE BOARD |
01/12/1992 |
|
|
BROWN DOUGLAS |
MEMBER OF THE BOARD |
17/06/2002 |
3 |
|
|
MEMBER |
03/11/1993 |
|
|
|
MEMBER OF THE BOARD |
16/12/1996 |
|
|
CHAVES SANCHEZ MIGUEL |
MEMBER OF THE BOARD |
14/10/1993 |
1 |
|
CHAVOS SANCHEZ MIGUEL ANGEL |
MEMBER |
14/10/1993 |
1 |
|
CREIXELL SUREDA JORDI |
PROXY |
05/11/2013 |
4 |
|
|
NON CONSELLOR SECRETARY |
17/06/2002 |
|
|
|
PROXY |
04/05/2009 |
|
|
CREIXELL SUREDA JOSE |
MEMBER OF THE BOARD |
14/10/1993 |
9 |
|
|
MEMBER |
14/10/1993 |
|
|
|
MEMBER OF THE BOARD |
19/02/1990 |
|
|
|
MEMBER OF THE BOARD |
30/07/2008 |
|
|
|
CHIEF EXECUTIVE OFFICER |
30/07/2008 |
|
|
|
PRESIDENT |
23/05/2000 |
|
|
|
MEMBER OF THE BOARD |
23/05/2000 |
|
|
|
PRESIDENT |
17/06/2002 |
|
|
CREIXELL SURERA JORDI |
SECRETARY |
17/06/2002 |
2 |
|
|
SECRETARY |
30/07/2008 |
|
|
CREIXELL SURERA JOSE |
MEMBER OF THE BOARD |
17/06/2002 |
3 |
|
|
CHIEF EXECUTIVE OFFICER |
17/06/2002 |
|
|
|
PRESIDENT |
17/06/2002 |
|
|
CRESPO ALONSO BERNABE |
JOINT ATTORNEY/COMBINED PROXY |
11/01/2012 |
1 |
|
DE OTEIZA SANJOSE JORGE MARIA |
PROXY |
06/06/2002 |
1 |
|
FRAGMENTADORA SA |
MEMBER OF THE BOARD |
16/02/1998 |
1 |
|
FRAGNOR SL |
MEMBER OF THE BOARD |
30/07/2008 |
1 |
|
FRAGNOR SOCIEDAD LIMITADA |
MEMBER OF THE BOARD |
16/02/1998 |
1 |
|
GALLARRETA OTAOLAURRUCHI JOSE LUIS |
MEMBER OF THE BOARD |
14/10/1993 |
2 |
|
|
PROXY |
11/01/2012 |
|
|
GALLEGO ROIG ESTANISLAO |
JOINT ATTORNEY/COMBINED PROXY |
04/09/2012 |
1 |
|
GONZALEZ DEUBIETA CARASA MANUEL |
NON CONSELLOR SECRETARY |
03/11/1993 |
1 |
|
GONZALEZ UBIETA CARASA MANUEL |
PROXY |
11/01/2012 |
1 |
|
HERBOSA LANZA ENRIQUE |
PROXY |
11/12/2009 |
3 |
|
|
JOINT ATTORNEY/COMBINED PROXY |
11/12/2009 |
|
|
|
PROXY |
07/02/2003 |
|
|
INGENIERIA Y TRATAMIENTOS DE VALORIZACION SL |
MEMBER OF THE BOARD |
30/07/2008 |
1 |
|
INGENIERIA Y TRATAMIENTOS DE VALORIZACION SOCIEDAD |
MEMBER OF THE BOARD |
17/06/2002 |
1 |
|
JAMES JOANNA MARGARET |
MEMBER OF THE BOARD |
17/06/2002 |
1 |
|
MIERA NARANJO RAFAEL |
JOINT ATTORNEY/COMBINED PROXY |
11/12/2009 |
1 |
|
P.I. OSI SOCIEDAD LIMITADA |
MEMBER OF THE BOARD |
17/06/2002 |
2 |
|
|
MEMBER OF THE BOARD |
30/07/2008 |
|
|
RABELL TORELLO FRANCISCO JAVIER |
JOINT ATTORNEY |
29/11/2006 |
1 |
|
RECIO CANTALAPIEDRA CARLOS |
PROXY |
11/01/2012 |
1 |
|
RECONDE PORRUA RODRIGO |
PRESIDENT |
01/12/1992 |
1 |
|
RECONDO PORRUA RODRIGO |
MEMBER OF THE BOARD |
14/10/1993 |
4 |
|
|
MEMBER OF THE BOARD |
17/06/2002 |
|
|
|
PROXY |
11/01/2012 |
|
|
|
MEMBER |
04/12/1995 |
|
|
RIVERO RIOS JOSE ANTONIO |
ADMINISTRATOR |
09/02/1990 |
1 |
|
ROIG BADIA ERNEST |
MEMBER OF THE BOARD |
06/11/2000 |
1 |
|
RUIZ FELTRER CARLES |
JOINT ATTORNEY |
29/11/2006 |
2 |
|
|
JOINT ATTORNEY/COMBINED PROXY |
11/12/2009 |
|
|
SECOND CODE SL |
MEMBER OF THE BOARD |
06/11/2000 |
2 |
|
|
MEMBER OF THE BOARD |
30/07/2008 |
|
|
SECOND CODE SOCIEDAD LIMITADA |
SINGLE ADMINISTRATOR |
11/12/2013 |
6 |
|
|
MEMBER OF THE BOARD |
17/06/2002 |
|
|
|
MEMBER OF THE BOARD |
30/07/2008 |
|
|
|
CHIEF EXECUTIVE OFFICER |
30/07/2008 |
|
|
|
PRESIDENT |
30/07/2008 |
|
|
SOLA GUERRERO JOSEP |
PROXY |
21/06/2010 |
1 |
|
SOUCHEIRON MARCET ALBERTO |
JOINT ATTORNEY/COMBINED PROXY |
16/01/2009 |
1 |
|
TORRES CARRETERO JUAN CARLOS |
MEMBER OF THE BOARD |
19/02/1990 |
5 |
|
|
MEMBER |
03/11/1993 |
|
|
|
MEMBER |
04/12/1995 |
|
|
|
MEMBER OF THE BOARD |
14/10/1993 |
|
|
|
MEMBER |
14/10/1993 |
|
|
TRATAMIENTOS ECOLOGICOS DEL NORTE TECONOR SL |
MEMBER OF THE BOARD |
30/07/2008 |
1 |
|
TRATAMIENTOS ECOLOGICOS DEL NORTE TECONOR SOCIEDAD |
MEMBER OF THE BOARD |
17/06/2002 |
2 |
|
|
MEMBER OF THE BOARD |
30/07/2008 |
|
|
XAVIER RABELL TORELLO |
JOINT ATTORNEY/COMBINED PROXY |
11/01/2012 |
1 |
Executive
board
|
Post |
NIF |
Name |
|
FINANCIAL DIRECTOR |
|
JAVIER LARA |
|
MANAGING DIRECTOR |
|
CARLOS NUÑEZ |
Defaults,
Legal Claims and Insolvency Proceedings
Section enabling assessment of the degree of compliance of the company queried
with its payment obligations. It provides information on the existence and
nature of all stages of Insolvency and Legal Proceedings published with
reference to the Company in the country's various Official Bulletins and
national newspapers, as well Defaults Registered in the main national credit
bureaus (ASNEF Industrial and RAI ).
> Summary
Chronological summary
|
|
|
Number of Publications |
Amount (_) |
Start date |
End date |
|
Insolvency Proceedings, Bankruptcy and Suspension of Payments |
|
Unpublished |
--- |
--- |
--- |
|
Request/Declaration |
|
0 |
--- |
date |
|
|
Proceedings |
|
--- |
--- |
|
--- |
|
Resolution |
|
--- |
--- |
|
--- |
|
Defaults on debt with Financial Institutions and Large Companies |
Bank and Commercial Delinquency |
None |
0 |
|
|
|
Status: Friendly |
|
--- |
|
|
|
|
Status: Pre-Litigation |
|
--- |
|
|
|
|
Status: Litigation |
|
--- |
|
|
|
|
Status: Non-performing |
|
--- |
|
|
|
|
Status: insolvency proceedings, bankruptcy and suspension of payments |
|
--- |
|
|
|
|
Other status |
|
--- |
|
|
|
|
Legal and Administrative Proceedings |
|
2 |
--- |
05/06/2009 |
11/12/2009 |
|
Notices of defaults and enforcement |
|
2 |
--- |
|
--- |
|
Seizures |
|
--- |
--- |
|
--- |
|
Auctions |
|
--- |
--- |
|
--- |
|
Declarations of insolvency and bad debt |
|
--- |
--- |
|
--- |
|
Proceedings heard by the Civil Court |
|
Unpublished |
--- |
|
|
|
Proceedings heard by the Labour Court |
|
Unpublished |
--- |
|
|
> Details
|
Positive Factors |
Adverse Factors |
|
It has been found to have regular payment performance and has paid all
of its debts in a timely manner. TRADEBE SOCIEDAD ANONIMA obtains economic profitability from the
necessary investments in the development of its activity in comparison with
its assets. Alta rentabilidad financiera. El rendimiento neto derivado de la
actividad típica que la empresa obtiene como consecuencia de sus fondos
propios presenta unos valores elevados. {POSITIVO}Debts assumed by the company based on the volume of its own
resources have decreased in the previous financial year.{/POSITIVO} {POSITIVO}Adequate turnover of the current assets. The company shows
an efficient use of current assets by having good capacity to generate
incomes based on the dedicated assets available for sale. {/POSITIVO} |
TRADEBE SOCIEDAD ANONIMA it presents an excessive indebtedness that
may compromise their balance sheet. The current debt represents a 7.3564744e-001f the financial structure.
In principle, a decrease in this ratio would indicate an improvement in the
short-term financial situation. The company denotes a special dependence short-term financing which, a
priori, could cause problems of short-term solvency. TRADEBE SOCIEDAD ANONIMA 's Working Capital is negative, which means,
in principle, that its capacity to pay debts maturing within a year using its
resources available in the short run is insufficient. |
Probability
of default
> Probabilidad Estimada de Impago para los próximos 12 meses:
0.573 %
|
Sector in which comparison is carried out : 382 Waste treatment and disposal |
|
|
Relative Position:
|
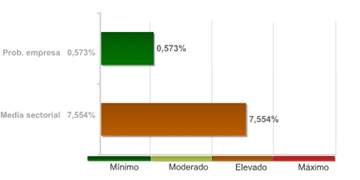
The company's comparative analysis with the rest of the companies that
comprise the sector, shows the company holds a better position with regard to
the probability of non-compliance.
The 96.00% of the companies of the sector TRADEBE SOCIEDAD ANONIMA
belongs to show a higher probability of non-compliance.
The probability of the company's non-compliance with its payment
obligations within deadlines estimated by our qualifications models is 0.57%.
In the event they fail to comply with the payment, the seriousness of
the loss will depend on factors such as the promptness of the commencement of
the charging management, the existence of executive documents which match the
credit or the existence of guarantees and free debt assets under the name of
the debtor. Therefore, the probability of non-compliance should not be solely
interpreted as the total loss of the owed amount.
LEGAL CLAIMS
|
Summary of Judicial Claims |
|
|
|
|
|
|
|
|
||
|
|
|
No se han publicado |
|
|
|
|
No se han publicado |
|
|
|
|
||
|
|
|
No se han publicado |
|
|
|
|
No se han publicado |
|
|
|
|
No se han publicado |
|
|
|
|
|
|
|
|
|
||
|
|
|
No se han publicado |
|
|
|
|
No se han publicado |
|
|
|
|
||
|
|
|
No se han publicado |
|
|
Incidences Detailed |
|
Incidences with the Local Administration |
|
|
|
Last Published Stage: |
SEIZURE |
|
Record Number: |
0911071 |
|
Amount of the incidence: |
0,00 E |
|
Requested by: |
ADMINISTRACION LOCAL |
|
Published domicile: |
(DESCONOCIDA) |
|
Source: |
B.O.P. VIZCAYA Nº243, 2009 PAGINA 17 |
|
|
|
Last Published Stage: |
SEIZURE |
|
Record Number: |
0814061 |
|
Amount of the incidence: |
0,00 E |
|
Requested by: |
ADMINISTRACION LOCAL |
|
Published domicile: |
(DESCONOCIDA) |
|
Source: |
B.O.P. VIZCAYA Nº105, 2009 PAGINA 51 |
Link
List
|
HAS IN ITS ADMINISTRATION BOARD TO: |
1 Entities |
|
IS RELATED WITH: |
2 Entities |
|
PARTICIPATES IN: |
1 Entities |
|
SE ESCINDE PARCIALMENTE EN: |
1 Entities |
|
SHAREHOLDERS: |
1 Entities |
> Shareholders
|
Relationship |
Entity |
Province |
Shareholding stake |
|
SHAREHOLDERS |
GRUPO TRADEBE MEDIOAMBIENTE SL |
VIZCAYA |
100 |
|
PARTICIPATES IN |
FRAGNOR SOCIEDAD LIMITADA |
VIZCAYA |
11.11 |
> Other relationships
|
Relationship |
Entity |
Province |
Shareholding stake |
|
IS RELATED WITH |
LUNAGUA SOCIEDAD LIMITADA |
CANTABRIA |
|
|
|
ECOLOGIA QUIMICA SA |
BARCELONA |
|
|
SE ESCINDE PARCIALMENTE EN |
GRUPO TRADEBE MEDIO AMBIENTE SOCIEDAD LIMITADA |
VIZCAYA |
|
|
HAS IN ITS ADMINISTRATION BOARD TO |
SECOND CODE SA |
BARCELONA |
|
Turnover
|
Total Sales 2013 |
7.500.000 |
Financial Accounts and Balance Sheets
Financial Years
Presented
|
Ejercicio |
Tipo de Cuentas Anuales |
Fecha Presentacion |
|
2011 |
Normales |
November 2012 |
|
2010 |
Normales |
August 2011 |
|
2009 |
Normales |
August 2010 |
|
2008 |
Normales |
August 2009 |
|
2007 |
Normales |
July 2008 |
|
2006 |
Normales |
July 2008 |
|
2005 |
Normales |
July 2006 |
|
2004 |
Normales |
August 2005 |
|
2003 |
Normales |
August 2004 |
|
2002 |
Normales |
August 2003 |
|
2001 |
Normales |
October 2002 |
|
2000 |
Normales |
August 2001 |
|
1999 |
Normales |
July 2000 |
|
1998 |
Normales |
July 1999 |
|
1997 |
Normales |
July 1998 |
|
1996 |
Normales |
July 1997 |
|
1995 |
Normales |
July 1996 |
|
1994 |
Normales |
July 1995 |
|
1993 |
Normales |
July 1995 |
|
1992 |
Normales |
April 1994 |
|
1991 |
Normales |
July 1992 |
|
1990 |
Normales |
July 1991 |
|
1989 |
Normales |
July 1990 |
The data in the
report regarding the last Company Accounts submitted by the company is taken from
the TRADE REGISTER serving the region in which the company's address is located
31/12/2011
> Balance en formato Mixto de acuerdo al Nuevo Plan General
Contable 2007
Information
corresponding to the fiscal year 2011 2010 2009 2008 is taken
from information submitted to the TRADE REGISTER. Data corresponding to fiscal
years before 2011 2010 2009 2008 has been compiled based
on the equivalence criteria stipulated in Act JUS/206/2009. Where the
provisions of the Act did not establish relevant equivalence criteria, created
such criteria using its own methodology. To view details on the methodology.
|
|
ORIGINAL |
ORIGINAL |
ORIGINAL |
ORIGINAL |
EQUIVALENCIA |
|
|
Assets |
2011 |
2010 |
2009 |
2008 |
2007 |
|
|
A) NON-CURRENT ASSETS: 11000 |
3.039.550,00 |
4.086.538,00 |
4.844.672,00 |
5.355.935,00 |
5.616.331,00 |
|
|
I. Intangible fixed assets : 11100 |
6.591,00 |
7.591,00 |
0,00 |
271,00 |
2.262.690,00 |
|
|
1. Development: 11110 |
0,00 |
0,00 |
0,00 |
0,00 |
0,00 |
|
|
2. Concessions: 11120 |
0,00 |
0,00 |
0,00 |
0,00 |
0,00 |
|
|
3. Patents, licencing, trade
marks and similar: 11130 |
0,00 |
0,00 |
0,00 |
0,00 |
0,00 |
|
|
4. Goodwill: 11140 |
0,00 |
0,00 |
0,00 |
0,00 |
0,00 |
|
|
5. IT applications:
11150 |
0,00 |
0,00 |
0,00 |
0,00 |
2.262.690,00 |
|
|
6. Investigation:
11160 |
0,00 |
0,00 |
0,00 |
0,00 |
0,00 |
|
|
7. Other intangible fixed
assets: 11170 |
0,00 |
0,00 |
0,00 |
0,00 |
0,00 |
|
|
II. Tangible fixed assets : 11200 |
2.150.029,00 |
3.077.497,00 |
3.880.351,00 |
4.546.885,00 |
2.786.839,00 |
|
|
1. Land and buildings:
11210 |
0,00 |
0,00 |
0,00 |
0,00 |
2.786.839,00 |
|
|
2. Technical installations
and other tangible fixed assets: 11220 |
0,00 |
0,00 |
0,00 |
0,00 |
0,00 |
|
|
3. Tangible asset in progress
and advances: 11230 |
0,00 |
0,00 |
0,00 |
0,00 |
0,00 |
|
|
III. Real estate investment: 11300 |
0,00 |
0,00 |
0,00 |
0,00 |
0,00 |
|
|
1. Land: 11310 |
0,00 |
0,00 |
0,00 |
0,00 |
0,00 |
|
|
2. Buildings: 11320 |
0,00 |
0,00 |
0,00 |
0,00 |
0,00 |
|
|
IV. Long-term investments in Group companies and
associates : 11400 |
779.723,00 |
555.427,00 |
555.396,00 |
555.396,00 |
0,00 |
|
|
1. Equity instruments:
11410 |
0,00 |
0,00 |
0,00 |
0,00 |
0,00 |
|
|
2. Credits to businesses:
11420 |
0,00 |
0,00 |
0,00 |
0,00 |
0,00 |
|
|
3. Debt securities:
11430 |
0,00 |
0,00 |
0,00 |
0,00 |
0,00 |
|
|
4. Derivatives : 11440 |
0,00 |
0,00 |
0,00 |
0,00 |
0,00 |
|
|
5. Other financial assets :
11450 |
0,00 |
0,00 |
0,00 |
0,00 |
0,00 |
|
|
6. Other investments:
11460 |
0,00 |
0,00 |
0,00 |
0,00 |
0,00 |
|
|
V. Long-term financial investments: 11500 |
5.356,00 |
4.725,00 |
13.232,00 |
13.007,00 |
566.803,00 |
|
|
1. Equity instruments:
11510 |
0,00 |
0,00 |
0,00 |
0,00 |
566.803,00 |
|
|
2. Credits to third parties :
11520 |
0,00 |
0,00 |
0,00 |
0,00 |
0,00 |
|
|
3. Debt securities:
11530 |
0,00 |
0,00 |
0,00 |
0,00 |
0,00 |
|
|
4. Derivatives : 11540 |
0,00 |
0,00 |
0,00 |
0,00 |
0,00 |
|
|
5. Other financial assets :
11550 |
0,00 |
0,00 |
0,00 |
0,00 |
0,00 |
|
|
6. Other investments:
11560 |
0,00 |
0,00 |
0,00 |
0,00 |
0,00 |
|
|
VI. Assets for deferred tax : 11600 |
97.851,00 |
441.299,00 |
395.694,00 |
240.376,00 |
0,00 |
|
|
VII. Non-current trade debts : 11700 |
0,00 |
0,00 |
0,00 |
0,00 |
0,00 |
|
|
B) CURRENT ASSETS: 12000 |
3.393.269,00 |
1.592.349,00 |
2.452.284,00 |
2.241.658,00 |
2.702.143,00 |
|
|
I. Non-current assets held for sale : 12100 |
0,00 |
0,00 |
0,00 |
0,00 |
0,00 |
|
|
II. Stocks: 12200 |
0,00 |
0,00 |
0,00 |
0,00 |
0,00 |
|
|
1. Commercial: 12210 |
0,00 |
0,00 |
0,00 |
0,00 |
0,00 |
|
|
2. Primary material and
other supplies: 12220 |
0,00 |
0,00 |
0,00 |
0,00 |
0,00 |
|
|
3. Work in progress:
12230 |
0,00 |
0,00 |
0,00 |
0,00 |
0,00 |
|
|
a) Of
long-term production cycle : 12231 |
0,00 |
0,00 |
0,00 |
0,00 |
0,00 |
|
|
b) Of
short-term production cycle : 12232 |
0,00 |
0,00 |
0,00 |
0,00 |
0,00 |
|
|
4. Finished goods:
12240 |
0,00 |
0,00 |
0,00 |
0,00 |
0,00 |
|
|
a) Of long-term
production cycle : 12241 |
0,00 |
0,00 |
0,00 |
0,00 |
0,00 |
|
|
b) Of
short-term production cycle : 12242 |
0,00 |
0,00 |
0,00 |
0,00 |
0,00 |
|
|
5. By-products, residues and
recycled materials: 12250 |
0,00 |
0,00 |
0,00 |
0,00 |
0,00 |
|
|
6. Advances to suppliers:
12260 |
0,00 |
0,00 |
0,00 |
0,00 |
0,00 |
|
|
III. Trade debtors and others receivable
accounts: 12300 |
3.096.188,00 |
1.494.372,00 |
2.009.617,00 |
1.879.845,00 |
2.651.848,00 |
|
|
1. Trade debtors / accounts
receivable: 12310 |
0,00 |
1.450.989,00 |
1.929.714,00 |
1.750.622,00 |
2.469.557,00 |
|
|
a) Long-term
receivables from sales and services supplied : 12311 |
0,00 |
0,00 |
0,00 |
0,00 |
0,00 |
|
|
b)
Customers for sales and provisions of services : 12312 |
0,00 |
1.450.989,00 |
1.929.714,00 |
1.750.622,00 |
2.469.557,00 |
|
|
2. Customers, Group
companies and associates : 12320 |
0,00 |
0,00 |
0,00 |
0,00 |
0,00 |
|
|
3. Other accounts
receivable: 12330 |
0,00 |
43.383,00 |
79.903,00 |
129.223,00 |
182.291,00 |
|
|
4. Personnel: 12340 |
0,00 |
0,00 |
0,00 |
0,00 |
0,00 |
|
|
5. Assets for deferred tax:
12350 |
0,00 |
0,00 |
0,00 |
0,00 |
0,00 |
|
|
6. Other debtors, including
tax and social security: 12360 |
0,00 |
0,00 |
0,00 |
0,00 |
0,00 |
|
|
7. Called up share capital:
12370 |
0,00 |
0,00 |
0,00 |
0,00 |
0,00 |
|
|
IV. Short-term investments in Group companies and
associates: 12400 |
0,00 |
10.194,00 |
392.666,00 |
76.270,00 |
0,00 |
|
|
1. Equity instruments:
12410 |
0,00 |
0,00 |
0,00 |
0,00 |
0,00 |
|
|
2. Credits to businesses:
12420 |
0,00 |
0,00 |
0,00 |
0,00 |
0,00 |
|
|
3. Debt securities:
12430 |
0,00 |
0,00 |
0,00 |
0,00 |
0,00 |
|
|
4. Derivatives : 12440 |
0,00 |
0,00 |
0,00 |
0,00 |
0,00 |
|
|
5. Other financial assets :
12450 |
0,00 |
0,00 |
0,00 |
0,00 |
0,00 |
|
|
6. Other investments:
12460 |
0,00 |
0,00 |
0,00 |
0,00 |
0,00 |
|
|
V. Short-term financial investments : 12500 |
36.385,00 |
36.385,00 |
36.385,00 |
36.385,00 |
34.885,00 |
|
|
1. Equity instruments:
12510 |
0,00 |
0,00 |
0,00 |
0,00 |
34.885,00 |
|
|
2. Credits to businesses:
12520 |
0,00 |
0,00 |
0,00 |
0,00 |
0,00 |
|
|
3. Debt securities:
12530 |
0,00 |
0,00 |
0,00 |
0,00 |
0,00 |
|
|
4. Derivatives : 12540 |
0,00 |
0,00 |
0,00 |
0,00 |
0,00 |
|
|
5. Other financial assets :
12550 |
0,00 |
0,00 |
0,00 |
0,00 |
0,00 |
|
|
6. Other investments:
12560 |
0,00 |
0,00 |
0,00 |
0,00 |
0,00 |
|
|
VI. Short-term accruals: 12600 |
-6.558,00 |
252,00 |
252,00 |
6.262,00 |
252,00 |
|
|
VII. Cash and other equivalent liquid assets :
12700 |
267.253,00 |
51.146,00 |
13.365,00 |
242.896,00 |
15.158,00 |
|
|
1. Treasury: 12710 |
0,00 |
0,00 |
0,00 |
0,00 |
15.158,00 |
|
|
2. Other equivalent liquid
assets: 12720 |
0,00 |
0,00 |
0,00 |
0,00 |
0,00 |
|
|
TOTAL ASSETS (A + B) : 10000 |
6.432.819,00 |
5.678.887,00 |
7.296.956,00 |
7.597.593,00 |
8.318.474,00 |
|
|
|
ORIGINAL |
ORIGINAL |
ORIGINAL |
ORIGINAL |
EQUIVALENCIA |
|
|
Liabilities and Net Worth |
2011 |
2010 |
2009 |
2008 |
2007 |
|
|
A) NET WORTH: 20000 |
1.432.830,00 |
510.042,00 |
778.043,00 |
1.317.502,00 |
1.123.159,00 |
|
|
A-1) Shareholders' equity: 21000 |
1.425.942,00 |
503.155,00 |
571.831,00 |
972.321,00 |
1.101.749,00 |
|
|
I. Capital: 21100 |
402.630,00 |
402.630,00 |
402.630,00 |
402.630,00 |
402.630,00 |
|
|
1. Registered capital :
21110 |
402.630,00 |
402.630,00 |
402.630,00 |
402.630,00 |
402.630,00 |
|
|
2. (Uncalled capital):
21120 |
0,00 |
0,00 |
0,00 |
0,00 |
0,00 |
|
|
II. Share premium: 21200 |
0,00 |
0,00 |
0,00 |
0,00 |
0,00 |
|
|
III. Reserves: 21300 |
979.007,00 |
963.596,00 |
974.523,00 |
917.098,00 |
472.920,00 |
|
|
1. Legal y estatutarias:
21310 |
0,00 |
0,00 |
0,00 |
0,00 |
0,00 |
|
|
2. Other reserves:
21320 |
0,00 |
0,00 |
0,00 |
0,00 |
472.920,00 |
|
|
IV. (Common stock equity): 21400 |
0,00 |
0,00 |
0,00 |
0,00 |
0,00 |
|
|
V. Results from previous periods: 21500 |
-863.072,00 |
-805.321,00 |
-446.994,00 |
0,00 |
0,00 |
|
|
1. Brought forward:
21510 |
0,00 |
0,00 |
0,00 |
0,00 |
0,00 |
|
|
2. (Negative results from
previous periods): 21520 |
0,00 |
0,00 |
0,00 |
0,00 |
0,00 |
|
|
VI. Other shareholders' contributions:
21600 |
0,00 |
0,00 |
0,00 |
0,00 |
0,00 |
|
|
VII. Result of the period: 21700 |
907.377,00 |
-57.750,00 |
-358.328,00 |
-347.407,00 |
226.200,00 |
|
|
VIII. (Interim dividend): 21800 |
0,00 |
0,00 |
0,00 |
0,00 |
0,00 |
|
|
IX. Other net worth instruments: 21900 |
0,00 |
0,00 |
0,00 |
0,00 |
0,00 |
|
|
A-2) Adjustments due to changes in value:
22000 |
0,00 |
0,00 |
0,00 |
0,00 |
0,00 |
|
|
I. Financial assets held for sale: 22100 |
0,00 |
0,00 |
0,00 |
0,00 |
0,00 |
|
|
II. Hedge operations: 22200 |
0,00 |
0,00 |
0,00 |
0,00 |
0,00 |
|
|
III. Linked non-current assets and liabilities
held for sale : 22300 |
0,00 |
0,00 |
0,00 |
0,00 |
0,00 |
|
|
IV. Exchange rate difference: 22400 |
0,00 |
0,00 |
0,00 |
0,00 |
0,00 |
|
|
V. Other: 22500 |
0,00 |
0,00 |
0,00 |
0,00 |
0,00 |
|
|
A-3) Received subsidies, donations and legacies:
23000 |
6.887,00 |
6.887,00 |
206.212,00 |
345.180,00 |
21.410,00 |
|
|
B) NON-CURRENT LIABILITIES: 31000 |
267.702,00 |
397.765,00 |
819.964,00 |
1.308.175,00 |
1.677.199,00 |
|
|
I. Long-term provisions: 31100 |
-397,00 |
0,00 |
0,00 |
0,00 |
0,00 |
|
|
1. Long-term employee benefits
liability: 31110 |
0,00 |
0,00 |
0,00 |
0,00 |
0,00 |
|
|
2. Environmental actions:
31120 |
0,00 |
0,00 |
0,00 |
0,00 |
0,00 |
|
|
3. Restructuring provisions:
31130 |
0,00 |
0,00 |
0,00 |
0,00 |
0,00 |
|
|
4. Other provisions:
31140 |
0,00 |
0,00 |
0,00 |
0,00 |
0,00 |
|
|
II Long-term creditors: 31200 |
131.956,00 |
266.937,00 |
567.300,00 |
1.113.643,00 |
1.419.015,00 |
|
|
1. Liabilities and other securities:
31210 |
0,00 |
0,00 |
0,00 |
0,00 |
0,00 |
|
|
2. Amounts owed to credit
institutions: 31220 |
131.956,00 |
155.679,00 |
0,00 |
0,00 |
0,00 |
|
|
3. Creditors from financial
leasing: 31230 |
0,00 |
111.258,00 |
567.300,00 |
1.113.643,00 |
1.419.015,00 |
|
|
4. Derivatives : 31240 |
0,00 |
0,00 |
0,00 |
0,00 |
0,00 |
|
|
5. Other financial
liabilities : 31250 |
0,00 |
0,00 |
0,00 |
0,00 |
0,00 |
|
|
III. Long-term debts with Group companies and
associates: 31300 |
0,00 |
0,00 |
0,00 |
0,00 |
0,00 |
|
|
IV. Liabilities for deferred tax: 31400 |
136.143,00 |
130.828,00 |
252.663,00 |
194.533,00 |
258.184,00 |
|
|
V. Long-term accruals: 31500 |
0,00 |
0,00 |
0,00 |
0,00 |
0,00 |
|
|
VI. Non-current trade creditors : 31600 |
0,00 |
0,00 |
0,00 |
0,00 |
0,00 |
|
|
VII. Special long-term debts : 31700 |
0,00 |
0,00 |
0,00 |
0,00 |
0,00 |
|
|
C) CURRENT LIABILITIES : 32000 |
4.732.287,00 |
4.771.080,00 |
5.698.950,00 |
4.971.915,00 |
5.518.116,00 |
|
|
I. Liabilities linked to non-current assets held
for sale: 32100 |
0,00 |
0,00 |
0,00 |
0,00 |
0,00 |
|
|
II. Short-term provisions: 32200 |
-567,00 |
0,00 |
0,00 |
-567,00 |
-714,00 |
|
|
III. Short-term creditors : 32300 |
2.025.155,00 |
541.482,00 |
744.711,00 |
1.012.426,00 |
1.275.483,00 |
|
|
1. Liabilities and other securities:
32310 |
0,00 |
0,00 |
0,00 |
0,00 |
0,00 |
|
|
2. Amounts owed to credit
institutions: 32320 |
1.913.571,00 |
86.207,00 |
198.970,00 |
496.354,00 |
625.320,00 |
|
|
3. Creditors from financial leasing:
32330 |
111.584,00 |
455.276,00 |
545.741,00 |
516.073,00 |
650.163,00 |
|
|
4. Derivatives : 32340 |
0,00 |
0,00 |
0,00 |
0,00 |
0,00 |
|
|
5. Other financial
liabilities : 32350 |
0,00 |
0,00 |
0,00 |
0,00 |
0,00 |
|
|
IV. Short-term debts with Group companies and
associates: 32400 |
864.093,00 |
2.313.408,00 |
4.045.954,00 |
2.754.349,00 |
3.470.007,00 |
|
|
V. Trade creditors and other accounts payable:
32500 |
1.843.605,00 |
1.916.190,00 |
908.284,00 |
1.205.707,00 |
773.340,00 |
|
|
1. Suppliers: 32510 |
0,00 |
557.474,00 |
259.405,00 |
613.845,00 |
773.340,00 |
|
|
a)
Long-term debts : 32511 |
0,00 |
0,00 |
0,00 |
0,00 |
0,00 |
|
|
b)
Short-term debts : 32512 |
0,00 |
557.474,00 |
259.405,00 |
613.845,00 |
773.340,00 |
|
|
2. Suppliers, Group
companies and associates: 32520 |
0,00 |
0,00 |
0,00 |
0,00 |
0,00 |
|
|
3. Other creditors:
32530 |
0,00 |
0,00 |
0,00 |
0,00 |
0,00 |
|
|
4. Personnel (remuneration
due): 32540 |
0,00 |
0,00 |
0,00 |
0,00 |
0,00 |
|
|
5. Liabilities for current
tax: 32550 |
0,00 |
0,00 |
0,00 |
0,00 |
0,00 |
|
|
6. Otras deudas con las
Administraciones Públicas. : 32560 |
0,00 |
0,00 |
0,00 |
0,00 |
0,00 |
|
|
7. Advances from clients:
32570 |
0,00 |
0,00 |
0,00 |
0,00 |
0,00 |
|
|
VI. Short-term accruals: 32600 |
0,00 |
0,00 |
0,00 |
0,00 |
0,00 |
|
|
VII. Special short-term debts : 32700 |
0,00 |
0,00 |
0,00 |
0,00 |
0,00 |
|
|
TOTAL NET WORTH AND LIABILITIES (A + B + C) : 30000 |
6.432.819,00 |
5.678.887,00 |
7.296.956,00 |
7.597.593,00 |
8.318.474,00 |
|
|
|
ORIGINAL |
ORIGINAL |
ORIGINAL |
ORIGINAL |
EQUIVALENCIA |
|
|
Profit and Loss |
2011 |
2010 |
2009 |
2008 |
2007 |
|
|
1. Net turnover: 40100 |
7.137.551,00 |
5.740.492,00 |
4.169.536,00 |
5.495.991,00 |
5.794.410,00 |
|
|
2. Changes in stocks of finished goods and work
in progress: 40200 |
0,00 |
0,00 |
0,00 |
0,00 |
0,00 |
|
|
3. Works carried out by the company for its
assets: 40300 |
0,00 |
0,00 |
0,00 |
0,00 |
0,00 |
|
|
4. Supplies : 40400 |
-1.252.597,00 |
-1.788.940,00 |
-2.147.485,00 |
-2.907.241,00 |
-3.288.821,00 |
|
|
5. Other operating income: 40500 |
0,00 |
72.933,00 |
300.774,00 |
175.996,00 |
49.857,00 |
|
|
6. Personnel costs: 40600 |
-1.356.429,00 |
-1.254.293,00 |
-1.346.938,00 |
-1.455.364,00 |
-1.301.501,00 |
|
|
7. Other operating costs: 40700 |
-1.788.501,00 |
-1.319.609,00 |
-746.055,00 |
-658.648,00 |
-778.121,00 |
|
|
8. Amortisation of fixed assets: 40800 |
-1.054.075,00 |
-977.770,00 |
-931.693,00 |
-782.876,00 |
-298.857,00 |
|
|
9. Allocation of subsidies of non-financial fixed
assets and other: 40900 |
0,00 |
324.054,00 |
464.327,00 |
0,00 |
8.053,00 |
|
|
10. Excess provisions : 41000 |
0,00 |
0,00 |
0,00 |
0,00 |
0,00 |
|
|
11. Impairment and result of transfers of fixed
assets: 41100 |
-6.056,00 |
0,00 |
0,00 |
-4.867,00 |
14.651,00 |
|
|
12. Negative difference in combined businesses:
41200 |
0,00 |
0,00 |
0,00 |
0,00 |
0,00 |
|
|
13. Other results : 41300 |
-258.959,00 |
-607.351,00 |
0,00 |
0,00 |
-190.486,00 |
|
|
A) OPERATING INCOME (1 + 2 + 3 + 4 + 5 + 6 + 7 + 8 + 9 + 10 + 11 + 12
+ 13) : 49100 |
1.420.934,00 |
189.517,00 |
-237.535,00 |
-137.010,00 |
9.186,00 |
|
|
14. Financial income : 41400 |
139,00 |
10.676,00 |
185,00 |
1.054,00 |
541.731,00 |
|
|
a) Allocation of financial
subsidies, donations and legacies: 41430 |
0,00 |
0,00 |
0,00 |
0,00 |
0,00 |
|
|
b) Other financial income:
41490 |
139,00 |
10.676,00 |
185,00 |
1.054,00 |
541.731,00 |
|
|
15. Financial expenditure: 41500 |
-159.365,00 |
-280.401,00 |
-256.406,00 |
-348.338,00 |
-274.503,00 |
|
|
16. Changes in fair value of financial
instruments : 41600 |
0,00 |
0,00 |
0,00 |
0,00 |
0,00 |
|
|
17. Exchange rate differences : 41700 |
-3.218,00 |
0,00 |
-3.922,00 |
1.785,00 |
2.205,00 |
|
|
18. Impairment and result for transfers of
financial instruments: 41800 |
0,00 |
0,00 |
0,00 |
0,00 |
0,00 |
|
|
19. Other financial income and expenditure:
42100 |
0,00 |
0,00 |
0,00 |
0,00 |
0,00 |
|
|
a) Incorporation of
financial expenditure to assets: 42110 |
0,00 |
0,00 |
0,00 |
0,00 |
0,00 |
|
|
b) Financial income from arrangement
with creditors: 42120 |
0,00 |
0,00 |
0,00 |
0,00 |
0,00 |
|
|
c) Other income and
expenditure: 42130 |
0,00 |
0,00 |
0,00 |
0,00 |
0,00 |
|
|
B) FINANCIAL REVENUE (14 + 15 + 16 + 17 + 18 + 19) : 49200 |
-162.445,00 |
-269.725,00 |
-260.142,00 |
-345.500,00 |
269.433,00 |
|
|
C) NET RESULT BEFORE TAXES (A + B) : 49300 |
1.258.490,00 |
-80.209,00 |
-497.677,00 |
-482.510,00 |
278.619,00 |
|
|
20. Income taxes: 41900 |
-351.113,00 |
22.458,00 |
139.350,00 |
135.103,00 |
-52.419,00 |
|
|
D) RESULT OF THE PERIOD (C + 20) : 49500 |
907.377,00 |
-57.750,00 |
-358.328,00 |
-347.407,00 |
226.200,00 |
|
> Normal Balance Sheet under the rules of the 1990 General Accounting
Plan (repealed since 1st January of 2008)
Information
corresponding to the fiscal year 2011 2010 2009 2008 has
been compiled based on the equivalence criteria stipulated in Act JUS/206/2009.
Where the provisions of the Act did not establish relevant equivalence
criteria, created such criteria using its own methodology. To view details on
the methodology 2011 2010 2009 2008 is taken from
information submitted to the TRADE REGISTER.
|
|
EQUIVALENCIA |
EQUIVALENCIA |
EQUIVALENCIA |
EQUIVALENCIA |
ORIGINAL |
|
|
ASSETS |
2011 |
2010 |
2009 |
2008 |
2007 |
|
|
A) SHAREHOLDERS (PARTNERS) BY UNCALLED SUSCRIBED CAPITAL: |
0,00 |
0,00 |
0,00 |
0,00 |
0,00 |
|
|
B) FIXED ASSETS: |
2.941.699,00 |
3.645.239,00 |
4.448.979,00 |
5.115.559,00 |
5.618.455,00 |
|
|
I. Formation expenses: |
0,00 |
0,00 |
0,00 |
0,00 |
2.124,00 |
|
|
II. Intangible fixed assets: |
6.591,00 |
7.591,00 |
0,00 |
271,00 |
2.262.690,00 |
|
|
III. Tangible fixed assets: |
2.150.029,00 |
3.077.497,00 |
3.880.351,00 |
4.546.885,00 |
2.786.839,00 |
|
|
IV. Financial investments: |
785.079,00 |
560.151,00 |
568.628,00 |
568.403,00 |
566.803,00 |
|
|
V. Own shares: |
0,00 |
0,00 |
0,00 |
0,00 |
0,00 |
|
|
VI. Long-term trade receivables: |
0,00 |
0,00 |
0,00 |
0,00 |
0,00 |
|
|
C) Deferred expenses: |
0,00 |
0,00 |
0,00 |
0,00 |
217.342,00 |
|
|
D) CURRENT ASSETS: |
3.491.120,00 |
2.033.648,00 |
2.847.978,00 |
2.482.033,00 |
2.702.143,00 |
|
|
I. Called-up share capital (not paid): |
0,00 |
0,00 |
0,00 |
0,00 |
0,00 |
|
|
II. Stocks: |
0,00 |
0,00 |
0,00 |
0,00 |
0,00 |
|
|
III. Debtors: |
3.194.040,00 |
1.935.671,00 |
2.405.310,00 |
2.120.221,00 |
2.651.848,00 |
|
|
IV. Short-term investments: |
36.385,00 |
46.579,00 |
429.050,00 |
112.655,00 |
34.885,00 |
|
|
V. Short-term treasury shares: |
0,00 |
0,00 |
0,00 |
0,00 |
0,00 |
|
|
VI. Cash at bank and in hand: |
267.253,00 |
51.146,00 |
13.365,00 |
242.896,00 |
15.158,00 |
|
|
VII. Prepayments and accrued income: |
-6.558,00 |
252,00 |
252,00 |
6.262,00 |
252,00 |
|
|
GENERAL TOTAL (A + B + C + D): |
6.432.819,00 |
5.678.887,00 |
7.296.956,00 |
7.597.593,00 |
8.537.939,00 |
|
MERCANTILE
REGISTRY.
|
|
EQUIVALENCIA |
EQUIVALENCIA |
EQUIVALENCIA |
EQUIVALENCIA |
ORIGINAL |
|
|
LIABILITIES |
2011 |
2010 |
2009 |
2008 |
2007 |
|
|
A) EQUITY: |
1.425.942,00 |
503.155,00 |
571.831,00 |
972.321,00 |
1.321.215,00 |
|
|
I. Subscribed capital: |
402.630,00 |
402.630,00 |
402.630,00 |
402.630,00 |
402.630,00 |
|
|
II. Share premium: |
0,00 |
0,00 |
0,00 |
0,00 |
0,00 |
|
|
III. Revaluation reserves: |
316.919,00 |
311.930,00 |
315.467,00 |
296.878,00 |
224.135,00 |
|
|
IV. Reserves: |
662.088,00 |
651.666,00 |
659.056,00 |
620.220,00 |
468.250,00 |
|
|
a) Differences for capital
adjustment to euros: |
0,00 |
0,00 |
0,00 |
0,00 |
0,00 |
|
|
b) Remaining Reserves:
|
662.088,00 |
651.666,00 |
659.056,00 |
620.220,00 |
468.250,00 |
|
|
V. Profit or loss brought forward: |
-863.072,00 |
-805.321,00 |
-446.994,00 |
0,00 |
0,00 |
|
|
VI. Profit or loss for the financial year: |
907.377,00 |
-57.750,00 |
-358.328,00 |
-347.407,00 |
226.200,00 |
|
|
VII. Interim dividend paid: |
0,00 |
0,00 |
0,00 |
0,00 |
0,00 |
|
|
VIII. Own shares for capital reduction: |
0,00 |
0,00 |
0,00 |
0,00 |
0,00 |
|
|
B) Deferred income: |
6.887,00 |
6.887,00 |
206.212,00 |
345.180,00 |
31.718,00 |
|
|
C) PROVISIONS FOR LIABILITIES AND CHARGES: |
-397,00 |
0,00 |
0,00 |
0,00 |
0,00 |
|
|
D) LONG TERM LIABILITIES: |
268.099,00 |
397.765,00 |
819.964,00 |
1.308.175,00 |
1.666.890,00 |
|
|
E) SHORT TERM CREDITORS: |
4.732.853,00 |
4.771.080,00 |
5.698.950,00 |
4.972.482,00 |
5.518.116,00 |
|
|
F) SHORT-TERM PROVISIONS FOR LIABILITIES AND CHARGES: |
-567,00 |
0,00 |
0,00 |
-567,00 |
0,00 |
|
|
GENERAL TOTAL (A + B + C + D + E + F): |
6.432.819,00 |
5.678.887,00 |
7.296.956,00 |
7.597.593,00 |
8.537.939,00 |
|
MERCANTILE
REGISTRY.
|
|
EQUIVALENCIA |
EQUIVALENCIA |
EQUIVALENCIA |
EQUIVALENCIA |
ORIGINAL |
|
|
DEBIT |
2011 |
2010 |
2009 |
2008 |
2007 |
|
|
A) CHARGES (A.1 to A.15): |
6.230.313,00 |
6.205.905,00 |
5.293.149,00 |
6.292.438,00 |
6.204.785,00 |
|
|
A.1. Operating consumption:
|
1.252.597,00 |
1.788.940,00 |
2.147.485,00 |
2.907.241,00 |
3.288.821,00 |
|
|
A.2. Staff Costs: |
1.356.429,00 |
1.254.293,00 |
1.346.938,00 |
1.455.364,00 |
1.301.501,00 |
|
|
a)
Wages, salaries et al.: |
1.064.853,00 |
984.673,00 |
1.057.403,00 |
1.142.522,00 |
1.021.733,00 |
|
|
b) Social
security costs: |
291.575,00 |
269.620,00 |
289.535,00 |
312.842,00 |
279.768,00 |
|
|
A.3. Depreciation expense:
|
1.054.075,00 |
977.770,00 |
931.693,00 |
782.876,00 |
298.857,00 |
|
|
A.4. Variation of trade
provisions and losses of unrecovered receivables: |
0,00 |
0,00 |
0,00 |
0,00 |
6.825,00 |
|
|
A.5. Other operating
charges: |
1.788.501,00 |
1.319.609,00 |
746.055,00 |
658.648,00 |
771.297,00 |
|
|
A.I. OPERATING BENEFITS
(B.1-A.1-A.2-A.3-A.4-A.5): |
1.685.950,00 |
472.814,00 |
0,00 |
0,00 |
176.967,00 |
|
|
A.6. Financial and similar
charges: |
159.365,00 |
280.401,00 |
256.406,00 |
348.338,00 |
274.503,00 |
|
|
a) Due
to liabilities with companies of the group: |
22.115,00 |
38.911,00 |
35.581,00 |
48.339,00 |
38.093,00 |
|
|
b) Due
to liabilities with associated companies: |
0,00 |
0,00 |
0,00 |
0,00 |
0,00 |
|
|
c) Due
to other debts: |
137.250,00 |
241.490,00 |
220.824,00 |
300.000,00 |
236.411,00 |
|
|
d)
Losses from financial investments: |
0,00 |
0,00 |
0,00 |
0,00 |
0,00 |
|
|
A.7. Financial investment
provision change: |
0,00 |
0,00 |
0,00 |
0,00 |
0,00 |
|
|
A.8. Exchange losses: |
3.218,00 |
0,00 |
3.922,00 |
0,00 |
611,00 |
|
|
A.II. POSITIVE FINANCIAL RESULTS
(B.2+B.3-A.6-A.7-A.8): |
0,00 |
0,00 |
0,00 |
0,00 |
269.433,00 |
|
|
A.III. PROFIT FROM ORDINARY ACTIVITIES
(A.I+A.II-B.I-B.II): |
1.523.505,00 |
203.089,00 |
0,00 |
0,00 |
446.400,00 |
|
|
A.9. Changes in provisions for
intangible, tangible and securities portfolio: |
0,00 |
0,00 |
0,00 |
0,00 |
0,00 |
|
|
A.10. Losses from tangible
and intangible fixed assets and portfolio: |
6.056,00 |
0,00 |
0,00 |
4.867,00 |
0,00 |
|
|
A.11. Losses from
transactions with own shares and debentures: |
0,00 |
0,00 |
0,00 |
0,00 |
0,00 |
|
|
A.12. Extraordinary
expenses: |
258.959,00 |
607.351,00 |
0,00 |
0,00 |
917,00 |
|
|
A.13. Prior year expenses and
losses: |
0,00 |
0,00 |
0,00 |
0,00 |
209.035,00 |
|
|
A.IV. EXTRAORDINARY PROFIT
(B.4+B.5+B.6+B.7+B.8-A.9-A.10-A.11-A.12-A.13): |
0,00 |
0,00 |
464.327,00 |
0,00 |
0,00 |
|
|
A.V. PROFIT BEFORE TAXES (A.III+A.IV-B.III-B.IV):
|
1.258.490,00 |
0,00 |
0,00 |
0,00 |
278.619,00 |
|
|
A.14. Corporation Tax:
|
351.113,00 |
-22.458,00 |
-139.350,00 |
135.103,00 |
52.419,00 |
|
|
A.15. Miscellaneous taxes:
|
0,00 |
0,00 |
0,00 |
0,00 |
0,00 |
|
|
A.VI. FINANCIAL YEAR RESULT (PROFIT)
(A.V-A.14-A.15): |
907.377,00 |
0,00 |
0,00 |
0,00 |
226.200,00 |
|
MERCANTILE
REGISTRY.
|
|
EQUIVALENCIA |
EQUIVALENCIA |
EQUIVALENCIA |
EQUIVALENCIA |
ORIGINAL |
|
|
CREDIT |
2011 |
2010 |
2009 |
2008 |
2007 |
|
|
B) INCOME ( B.1 to B.8): |
7.137.690,00 |
6.148.155,00 |
4.934.822,00 |
5.674.825,00 |
6.430.985,00 |
|
|
B.1. Operating income:
|
7.137.551,00 |
5.813.425,00 |
4.470.310,00 |
5.671.987,00 |
5.844.267,00 |
|
|
a) Net
total sales: |
7.137.551,00 |
5.740.492,00 |
4.169.536,00 |
5.495.991,00 |
5.794.410,00 |
|
|
b)
Miscellaneous operating income: |
0,00 |
72.933,00 |
300.774,00 |
175.996,00 |
49.857,00 |
|
|
B.I. PÉRDIDAS DE EXPLOTACIÓN
(A.1+A.2+A.3+A.4+A.5-B.1 ): |
0,00 |
0,00 |
701.862,00 |
132.142,00 |
0,00 |
|
|
B.2. Financial income:
|
139,00 |
10.676,00 |
185,00 |
1.054,00 |
541.731,00 |
|
|
a)
Companies of the group: |
0,00 |
0,00 |
0,00 |
0,00 |
0,00 |
|
|
b) In
associated companies: |
0,00 |
0,00 |
0,00 |
0,00 |
0,00 |
|
|
c)
Miscellaneous: |
139,00 |
10.676,00 |
185,00 |
1.054,00 |
2.127,00 |
|
|
d)
Profit on financial investment: |
0,00 |
0,00 |
0,00 |
0,00 |
539.604,00 |
|
|
B.3. Exchange gains: |
0,00 |
0,00 |
0,00 |
1.785,00 |
2.816,00 |
|
|
B.II. NEGATIVE FINANCIAL RESULTS
(A.6+A.7+A.8-B.2-B.3): |
162.445,00 |
269.725,00 |
260.142,00 |
345.500,00 |
0,00 |
|
|
B.III. LOSSES ON ORDINARY ACTIVITIES ( B.I + B.II
- A.I - A.II ): |
0,00 |
0,00 |
962.004,00 |
477.642,00 |
0,00 |
|
|
B.4. Profit on disposal of
both tangible and intangible fixed assets and securities portfolio: |
0,00 |
0,00 |
0,00 |
0,00 |
14.651,00 |
|
|
B.5. Profit on transactions
with own shares and debentures: |
0,00 |
0,00 |
0,00 |
0,00 |
0,00 |
|
|
B.6. Capital grants
transferred to profit and loss: |
0,00 |
324.054,00 |
464.327,00 |
0,00 |
8.053,00 |
|
|
B.7. Extraordinary income:
|
0,00 |
0,00 |
0,00 |
0,00 |
0,00 |
|
|
B.8. Income and profit of
former financial years: |
0,00 |
0,00 |
0,00 |
0,00 |
19.467,00 |
|
|
B.IV. NEGATIVE EXTRAORDINARY RESULTS
(A.9+A.10+A.11+A.12+A.13-B.4-B.5-B.6-B.7-B.8): |
265.015,00 |
283.297,00 |
0,00 |
4.867,00 |
167.781,00 |
|
|
B.V. LOSSES BEFORE TAXES (B.III+B.IV-A.III-A.IV):
|
0,00 |
80.209,00 |
497.677,00 |
482.510,00 |
0,00 |
|
|
B.VI. FINANCIAL YEAR RESULTS (LOSSES)
(B.V+A.14+A.15): |
0,00 |
57.750,00 |
358.328,00 |
347.407,00 |
0,00 |
|
MERCANTILE
REGISTRY.
CASHFLOW
STATEMENT
Model: Normal
> Source of information: Data contained in this section is taken from
the information declared in the Annual Accounts submitted to the Trade
Register.
|
|
2011 |
2010 |
2009 |
2008 |
2007 |
|
|
1. Fiscal year result before taxes.: 61100 |
1.258.490,00 |
-80.209,00 |
-497.677,00 |
-482.510,00 |
278.619,00 |
|
|
2. Results adjustments.: 61200 |
1.212.338,00 |
1.247.495,00 |
1.188.480,00 |
1.129.594,00 |
28.813,00 |
|
|
a) Fixed Assets Amortization (+).: 61201 |
1.054.075,00 |
977.770,00 |
931.693,00 |
782.876,00 |
298.857,00 |
|
|
c) Variation in Provision (+/-). : 61203 |
-964,00 |
0,00 |
567,00 |
-567,00 |
0,00 |
|
|
g) Financial income (-).: 61207 |
-139,00 |
-10.676,00 |
-185,00 |
-1.054,00 |
-544.547,00 |
|
|
h) Financial Expenses (+). : 61208 |
159.365,00 |
280.401,00 |
256.406,00 |
348.338,00 |
274.503,00 |
|
|
3. Changes in current capital equity.: 61300 |
-2.008.509,00 |
1.928.080,00 |
-598.230,00 |
691.022,00 |
1.240.153,00 |
|
|
d) Debtors and other accounts receivable (+/-). :
61302 |
-1.601.817,00 |
515.245,00 |
-129.772,00 |
772.003,00 |
-327.205,00 |
|
|
c) Other current assets (+/-). : 61303 |
17.004,00 |
382.471,00 |
-310.386,00 |
-83.780,00 |
318.871,00 |
|
|
d) Creditors and other accounts payable (+/-). :
61304 |
-423.697,00 |
1.030.364,00 |
-158.073,00 |
2.800,00 |
1.248.486,00 |
|
|
4. Other cash flows for operating activities.: 61400 |
-159.226,00 |
-269.725,00 |
-256.221,00 |
-347.285,00 |
270.044,00 |
|
|
a) Interest payments (-). : 61401 |
-159.365,00 |
-280.401,00 |
-256.406,00 |
-348.338,00 |
-274.503,00 |
|
|
c) Interest collection (+). : 61403 |
139,00 |
10.676,00 |
185,00 |
1.054,00 |
544.547,00 |
|
|
5. Operating activity cash flows (1 + 2 + 3 + 4) : 61500 |
303.092,00 |
2.825.641,00 |
-163.648,00 |
990.822,00 |
1.817.628,00 |
|
|
6. Payments for investment (-).: 62100 |
-224.928,00 |
-53.227,00 |
-155.543,00 |
-2.002.023,00 |
-3.317.351,00 |
|
|
a) Companies of the group and affiliates. :
62101 |
-224.296,00 |
-31,00 |
0,00 |
-1.563,00 |
0,00 |
|
|
b) Intangible fixed assets. : 62102 |
0,00 |
-7.591,00 |
0,00 |
0,00 |
-2.034.564,00 |
|
|
c) Fixed assets. : 62103 |
0,00 |
0,00 |
0,00 |
-1.760.047,00 |
-1.090.326,00 |
|
|
e) Other financial assets. : 62105 |
-631,00 |
0,00 |
-225,00 |
-37,00 |
0,00 |
|
|
h) Other assets. : 62108 |
0,00 |
-45.605,00 |
-155.318,00 |
-240.376,00 |
-192.462,00 |
|
|
7. Divestment payment collection (+). : 62200 |
1.271.915,00 |
811.361,00 |
666.806,00 |
2.262.418,00 |
3.884,00 |
|
|
b) Intangible fixed assets. : 62202 |
1.000,00 |
0,00 |
271,00 |
2.262.418,00 |
0,00 |
|
|
c) Fixed assets. : 62203 |
927.468,00 |
802.854,00 |
666.534,00 |
0,00 |
0,00 |
|
|
e) Other financial assets. : 62205 |
0,00 |
8.508,00 |
0,00 |
0,00 |
0,00 |
|
|
h) Other assets. : 62208 |
343.448,00 |
0,00 |
0,00 |
0,00 |
3.884,00 |
|
|
8. Investment activity cash flows (6 + 7) minus Amortization:
62300 |
-7.088,00 |
-219.636,00 |
-420.430,00 |
-522.481,00 |
-3.612.324,00 |
|
|
9. Payment collection and payments for equity instruments. :
63100 |
15.411,00 |
-210.251,00 |
-181.131,00 |
541.750,00 |
-8.053,00 |
|
|
a) Issuance of equity instruments (+). :
63101 |
15.411,00 |
0,00 |
0,00 |
217.979,00 |
0,00 |
|
|
b) Amortization of assets instruments (-). :
63102 |
0,00 |
-10.926,00 |
-42.163,00 |
0,00 |
0,00 |
|
|
e) Grants, donations and bequests received (+). :
63105 |
0,00 |
-199.324,00 |
-138.969,00 |
323.771,00 |
-8.053,00 |
|
|
10. Payment collection and payments for financial liabilities
instruments.: 63200 |
-95.308,00 |
-2.357.974,00 |
535.678,00 |
-782.354,00 |
1.401.445,00 |
|
|
a) Issuance : 63201 |
-1.927.987,00 |
155.679,00 |
1.379.404,00 |
184.224,00 |
1.401.445,00 |
|
|
2. Debts incurred with credit institutions (+). :
63203 |
-23.724,00 |
155.679,00 |
0,00 |
0,00 |
1.401.445,00 |
|
|
3. Debts incurred with companies of the group and
affiliates (+).: 63204 |
-1.449.315,00 |
0,00 |
1.291.605,00 |
0,00 |
0,00 |
|
|
4. Special characteristic debts (+). :
63205 |
-454.949,00 |
0,00 |
29.669,00 |
0,00 |
0,00 |
|
|
5. Other debts (+). : 63206 |
0,00 |
0,00 |
58.131,00 |
184.224,00 |
0,00 |
|
|
b) Repayment and amortization of : 63207 |
1.832.680,00 |
-2.513.653,00 |
-843.726,00 |
-966.578,00 |
0,00 |
|
|
2. Debts incurred with credit institutions (-).:
63209 |
1.827.364,00 |
-112.763,00 |
-297.383,00 |
-54.465,00 |
0,00 |
|
|
3. Debts incurred with companies of the group and
affiliates (-). : 63210 |
0,00 |
-1.732.546,00 |
0,00 |
-302.236,00 |
0,00 |
|
|
4. Special characteristic debts (-). :
63211 |
0,00 |
-546.508,00 |
-546.342,00 |
-609.877,00 |
0,00 |
|
|
5. Other debts (-). : 63212 |
5.316,00 |
-121.836,00 |
0,00 |
0,00 |
0,00 |
|
|
11. Payments from dividends and remunerations from other assets
instruments. : 63300 |
0,00 |
0,00 |
0,00 |
0,00 |
0,00 |
|
|
12. Cash flows for financing activities (9+10+11).: 63400 |
-79.897,00 |
-2.568.224,00 |
354.547,00 |
-240.604,00 |
1.393.391,00 |
|
|
D) EFECTO DE LAS VARIACIONES DE LOS TIPOS DE CAMBIO: 64000 |
0,00 |
0,00 |
0,00 |
0,00 |
0,00 |
|
|
E) NET INCREASE/DECREASE OF CASH OR EQUIVALENT ASSETS
(+/-5+/-8+/12+/-D) : 65000 |
216.107,00 |
37.781,00 |
-229.531,00 |
227.737,00 |
-401.304,00 |
|
|
Cash or equivalent assets as of beginning of the fiscal
year.: 65100 |
51.146,00 |
13.365,00 |
242.896,00 |
15.158,00 |
416.462,00 |
|
|
Cash or equivalent assets as of end of the fiscal
year.: 65200 |
267.253,00 |
51.146,00 |
13.365,00 |
242.896,00 |
15.158,00 |
|
FINANCIAL
DIAGNOSIS
> Economic-Financial Comparative Analysis
Data used in the following ratios and indicators is taken from the
Annual Accounts submitted by the company to the TRADE REGISTER.
> Comparison within the Sector
|
Cash Flow |
2011 |
2010 |
Variación 2011 - 2010 |
|
|||
|
|
Empresa |
Sector |
Empresa |
Sector |
Empresa |
Sector |
|
|
Cash Flow over Sales: |
0,03 % |
0,00 % |
0,66 % |
0,12 % |
-95,40 % |
-99,75 % |
|
|
EBITDA over Sales: |
38,39 % |
6,11 % |
25,27 % |
16,22 % |
51,92 % |
-62,31 % |
|
|
Cash Flow Yield: |
0,03 % |
0,00 % |
0,67 % |
0,03 % |
-94,95 % |
-99,15 % |
|
|
Profitability |
2011 |
2010 |
Variación 2011 - 2010 |
|
|||
|
|
Empresa |
Sector |
Empresa |
Sector |
Empresa |
Sector |
|
|
Operating economic profitability: |
29,94 % |
3,26 % |
15,71 % |
5,23 % |
90,56 % |
-37,57 % |
|
|
Total economic profitability: |
22,04 % |
2,89 % |
3,53 % |
3,15 % |
525,24 % |
-8,25 % |
|
|
Financial profitability: |
63,63 % |
2,01 % |
-11,48 % |
3,14 % |
654,41 % |
-35,96 % |
|
|
Margin: |
23,54 % |
3,04 % |
13,71 % |
9,00 % |
71,70 % |
-66,23 % |
|
|
Mark-up: |
21,26 % |
1,33 % |
9,07 % |
6,42 % |
134,46 % |
-79,28 % |
|
|
Solvency |
2011 |
2010 |
Variación 2011 - 2010 |
|
|||
|
|
Empresa |
Sector |
Empresa |
Sector |
Empresa |
Sector |
|
|
Liquidity: |
0,06 |
0,16 |
0,01 |
0,14 |
426,75 |
10,86 |
|
|
Acid Test: |
0,72 |
1,03 |
0,33 |
1,01 |
115,27 |
2,52 |
|
|
Working Capital / Investment: |
-0,21 |
0,18 |
-0,56 |
0,14 |
62,81 |
23,30 |
|
|
Solvency: |
0,74 |
1,62 |
0,43 |
1,64 |
73,05 |
-1,11 |
|
|
Indebtedness |
2011 |
2010 |
Variación 2011 - 2010 |
|
|||
|
|
Empresa |
Sector |
Empresa |
Sector |
Empresa |
Sector |
|
|
Indebtedness level: |
3,49 |
1,58 |
10,13 |
1,13 |
-65,55 |
40,19 |
|
|
Borrowing Composition: |
0,06 |
0,94 |
0,08 |
1,12 |
-32,05 |
-16,26 |
|
|
Repayment Ability: |
23,14 |
2.473,85 |
4,43 |
18,10 |
422,60 |
13.565,54 |
|
|
Warranty: |
1,29 |
1,63 |
1,10 |
1,89 |
17,08 |
-13,72 |
|
|
Generated resources / Total creditors: |
0,39 |
0,06 |
0,18 |
0,06 |
120,35 |
5,64 |
|
|
Efficiency |
2011 |
2010 |
Variación 2011 - 2010 |
|
|||
|
|
Empresa |
Sector |
Empresa |
Sector |
Empresa |
Sector |
|
|
Productivity: |
3,02 |
1,35 |
2,16 |
1,68 |
40,04 |
-19,76 |
|
|
Turnover of Collection Rights : |
2,31 |
4,05 |
3,89 |
3,85 |
-40,74 |
5,40 |
|
|
Turnover of Payment Entitlements: |
1,65 |
3,61 |
1,62 |
2,02 |
1,68 |
79,22 |
|
|
Stock rotation: |
|
4,84 |
|
1,88 |
|
157,34 |
|
|
Assets turnover: |
1,27 |
1,07 |
1,15 |
0,58 |
10,98 |
84,90 |
|
|
Borrowing Cost: |
3,19 |
2,76 |
5,42 |
2,45 |
-41,26 |
12,73 |
|
> Trend of indicators under the General Accounting Plan of 2007
(2011, 2010, 2009, 2008, 2007)
|
Cash Flow |
2011 |
2010 |
2009 |
2008 |
2007 |
|
|
Cash Flow over Sales: |
0,03 % |
0,66 % |
-4,49 % |
4,14 % |
-6,93 % |
|
|
EBITDA over Sales: |
38,39 % |
25,27 % |
5,51 % |
11,84 % |
8,33 % |
|
|
Cash Flow Yield: |
0,03 % |
0,67 % |
-2,57 % |
3,00 % |
-4,82 % |
|
|
Profitability |
2011 |
2010 |
2009 |
2008 |
2007 |
|
|
Operating economic profitability: |
29,94 % |
15,71 % |
-3,77 % |
-1,98 % |
2,29 % |
|
|
Total economic profitability: |
22,04 % |
3,53 % |
-3,31 % |
-1,77 % |
6,65 % |
|
|
Financial profitability: |
63,63 % |
-11,48 % |
-62,66 % |
-35,73 % |
17,12 % |
|
|
Margin: |
23,54 % |
13,71 % |
-5,31 % |
-2,42 % |
3,03 % |
|
|
Mark-up: |
21,26 % |
9,07 % |
-5,82 % |
-6,09 % |
7,64 % |
|
|
Solvency |
2011 |
2010 |
2009 |
2008 |
2007 |
|
|
Liquidity: |
0,06 |
0,01 |
0,00 |
0,05 |
0,00 |
|
|
Acid Test: |
0,72 |
0,33 |
0,43 |
0,45 |
0,49 |
|
|
Working Capital / Investment: |
-0,21 |
-0,56 |
-0,39 |
-0,33 |
-0,34 |
|
|
Solvency: |
0,74 |
0,43 |
0,50 |
0,50 |
0,49 |
|
|
Indebtedness |
2011 |
2010 |
2009 |
2008 |
2007 |
|
|
Indebtedness level: |
3,49 |
10,13 |
8,38 |
4,77 |
5,31 |
|
|
Borrowing Composition: |
0,06 |
0,08 |
0,14 |
0,26 |
0,30 |
|
|
Repayment Ability: |
23,14 |
4,43 |
19,06 |
-6,05 |
-7,41 |
|
|
Warranty: |
1,29 |
1,10 |
1,12 |
1,21 |
1,16 |
|
|
Generated resources / Total creditors: |
0,39 |
0,18 |
0,09 |
0,07 |
0,07 |
|
|
Efficiency |
2011 |
2010 |
2009 |
2008 |
2007 |
|
|
Productivity: |
3,02 |
2,16 |
1,17 |
1,45 |
1,37 |
|
|
Turnover of Collection Rights : |
2,31 |
3,89 |
2,22 |
3,02 |
2,20 |
|
|
Turnover of Payment Entitlements: |
1,65 |
1,62 |
3,19 |
2,96 |
0,74 |
|
|
Assets turnover: |
1,27 |
1,15 |
0,71 |
0,82 |
0,76 |
|
|
Borrowing Cost: |
3,19 |
5,42 |
3,93 |
5,55 |
3,82 |
|
COMPARATIVE
SECTORIAL BALANCE
Sector-based
Comparison under the rules of the New General Accounting Plan.
|
|
Variación - |
|
|
|
Empresa |
Sector |
|
|
Variación - |
|
|
|
Empresa |
Sector |
|
|
Variación - |
|
|
|
Empresa |
Sector |
Public
Tenders and Works Won
No Public Tenders
assigned to the name of the company.
Detail
of Subsidies appearing in Balances Memories
|
Entity |
MINISTERIO DE INDUSTRIA, TURISMO Y COMERCIO |
|
Status |
CONCEDIDA |
|
Amount Granted |
6.887,45 |
|
Notes |
El importe reflejado corresponde al saldo imputado en la cuenta de
perdidas y ganancias. |
|
Entity |
MINISTERIO DE INDUSTRIA, TURISMO Y COMERCIO |
|
Status |
CONCEDIDA |
|
Amount Granted |
127.476,98 |
|
Notes |
El importe reflejado corresponde al saldo imputado en la cuenta de
perdidas y ganancias. |
Research
Summary
Collection and integral
treatment of waste of Marpol (marine pollution) and used oils with industrial
origin. It belongs to the group GRUPO TRADEBE
Sources
Registry of
Commerce's Official Gazette. Own and external data bases Company References
FOREIGN EXCHANGE RATES
|
Currency |
Unit
|
Indian Rupees |
|
US Dollar |
1 |
Rs.59.95 |
|
|
1 |
Rs.99.36 |
|
Euro |
1 |
Rs.82.15 |
INFORMATION DETAILS
|
Analysis Done by
: |
SUB |
|
|
|
|
Report Prepared
by : |
NNA |
RATING EXPLANATIONS
|
RATING |
STATUS |
PROPOSED CREDIT LINE |
|
|
>86 |
Aaa |
Possesses an extremely sound financial base with the strongest
capability for timely payment of interest and principal sums |
Unlimited |
|
71-85 |
Aa |
Possesses adequate working capital. No caution needed for credit
transaction. It has above average (strong) capability for payment of interest
and principal sums |
Large |
|
56-70 |
A |
Financial & operational base are regarded healthy. General
unfavourable factors will not cause fatal effect. Satisfactory capability for
payment of interest and principal sums |
Fairly Large |
|
41-55 |
Ba |
Overall
operation is considered normal. Capable to meet normal commitments. |
Satisfactory |
|
26-40 |
B |
Capability to overcome financial difficulties seems comparatively
below average. |
Small |
|
11-25 |
Ca |
Adverse factors are apparent. Repayment of interest and principal sums
in default or expected to be in default upon maturity |
Limited with full
security |
|
<10 |
C |
Absolute credit risk exists. Caution needed to be exercised |
Credit not
recommended |
|
-- |
NB |
New Business |
-- |
This score serves as a reference to assess SC’s
credit risk and to set the amount of credit to be extended. It is calculated
from a composite of weighted scores obtained from each of the major sections of
this report. The assessed factors and their relative weights (as indicated
through %) are as follows:
Financial
condition (40%) Ownership
background (20%) Payment
record (10%)
Credit history
(10%) Market trend (10%) Operational size
(10%)
This report is issued at your request without any
risk and responsibility on the part of MIRA INFORM PRIVATE LIMITED (MIPL) or
its officials.