MIRA INFORM REPORT
|
Report Date : |
10.04.2014 |
IDENTIFICATION DETAILS
|
Name : |
BENNETT INDUSTRIES PRIVATE LIMITED |
|
|
|
|
Registered
Office : |
316-317, The Commodity Exchange Building, Plot No.2, 3 and 4, Sector-19,
Vashi, Navi Mumbai – 400705, Maharashtra |
|
|
|
|
Country : |
|
|
|
|
|
Financials (as
on) : |
31.12.2013 |
|
|
|
|
Date of
Incorporation : |
21.06.2012 |
|
|
|
|
Com. Reg. No.: |
11-232502 |
|
|
|
|
Capital Investment
/ Paid-up Capital : |
Rs.0.200 Million |
|
|
|
|
CIN No.: [Company Identification
No.] |
U25203MH2012PTC232502 |
|
|
|
|
PAN No.: [Permanent Account No.] |
AAFCB0917R |
|
|
|
|
Legal Form : |
Private Limited Liability Company |
|
|
|
|
Line of Business
: |
Manufacturer and Trader of Adhesive Solvent Cement – Seal. |
|
|
|
|
No. of Employees
: |
32 (Approximately) (Office – 4, Factory – 25, Branch – 3) |
RATING & COMMENTS
|
MIRA’s Rating : |
B (27) |
|
RATING |
STATUS |
PROPOSED CREDIT LINE |
|
|
26-40 |
B |
Capability to overcome financial difficulties seems comparatively
below average. |
Small |
|
Status : |
Moderate |
|
|
|
|
Payment Behaviour : |
Slow but correct |
|
|
|
|
Litigation : |
Clear |
|
|
|
|
Comments : |
Subject is a relatively new company having a moderate track record. The company has achieved minimal sales turnover in its first year of
business operation. However, trade relations are improving. Business is active. Payment
terms are slow but correct. The company can be considered for business dealings with some caution.
|
NOTES:
Any query related to this report can be made
on e-mail : infodept@mirainform.com
while quoting report number, name and date.
ECGC Country Risk Classification List – December 1, 2013
|
Country Name |
Previous Rating (30.09.2013) |
Current Rating (01.12.2013) |
|
India |
A1 |
A1 |
|
Risk Category |
ECGC Classification |
|
Insignificant |
A1 |
|
Low |
A2 |
|
Moderate |
B1 |
|
High |
B2 |
|
Very High |
C1 |
|
Restricted |
C2 |
|
Off-credit |
D |
INDIAN ECONOMIC OVERVIEW
India’s current account deficit for the fiscal third quarter ended September
2013 narrowed to $4.2 billion or 0.9 % of the gross domestic product from $31.9
billion or 6.5 % of GDP a year earlier, thanks to a pick-up in exports and
moderation in gold imports. Manufacturing activity and new orders in India
showed their strongest growth in a year in February. The news comes as a relief
after data showed Asia’s third largest economy grew by a slower-than-expected
4.7 % annually in the three months through December. The HSBC Manufacturing
Purchasing Managers’ Index which gauges the business activity of India’s
factories but not its’ utilities, rose to 52.5 in February, its highest in a
year from 51.4 in January. Overall new orders for factory goods which rose to a
one-year high of 54.9 contributed to the surge. China has emerged as India’s
biggest trading partner in the current financial year replacing the United Arab
Emirates and pushing it to the third spot. India-China trade has reached $49.5
billion with a 8.7 % share in India’s total trade. The US comes second at $46
billion with 8.1 % share during the first nine months of the current financial
year.
The Reserve Bank of India has granted an additional nine months to the
public to exchange currency notes printed before 2005 including Rs 500 and Rs
1,000 denominations, pushing the deadline to January 1, 2015. A day before
dates for the Lok Sabha polls were announced, the government decided to hike
interest rates on fixed deposit schemes offered by post offices up to 0.2 per
cent. The new rates will be effective April, 1. The Supreme Court will resume
hearing on March, 11 Nokia’s appeal against a ruling over transferring
ownership of its local mobile phones plant which is the subject of a tax
dispute to Microsoft Corp.
In the last days of the current Government, another scam has surfaced.
The defence ministry has ordered a probe into Hindustan Aeronautics Limited’s
contracts from Britain’s Rolls-Royce Holdings worth at least $ 1.2 billion. The
Central Bureau of Investigation will look into allegations that over $80
million was paid in kickbacks in a deal signed in 2011. India has asked Boeing
Co. to find a solution for problems with state-owned Air India’s 787
Dreamliners. The aircraft has experienced a series of malfunctions since its
debut in 2011.
RBI DEFAULTERS’ LIST STATUS
Subject’s name is not enlisted as a defaulter
in the publicly available RBI Defaulters’ list.
EPF (Employee Provident Fund) DEFAULTERS’ LIST STATUS
Subject’s name is not enlisted as a defaulter in
the publicly available EPF (Employee Provident Fund) Defaulters’ list as of
31-03-2012.
INFORMATION PARTED BY
|
Name : |
Mr. Rupesh Namdev |
|
Designation : |
Director |
|
Contact No.: |
91-8451849669 |
|
Date : |
11.03.2014 |
LOCATIONS
|
Registered Office : |
316-317, The Commodity Exchange Building, Plot No.2, 3 and 4,
Sector-19, Vashi, Navi Mumbai – 400705, Maharashtra, India |
|
Tel. No.: |
91-22-41270000 |
|
Mobile No.: |
91-8451849669 (Mr. Rupesh Namdev) |
|
Fax No.: |
91-22-41272233 |
|
E-Mail : |
|
|
Website : |
|
|
Area : |
600 sq. ft. |
|
Location : |
Rented |
|
|
|
|
Factory : |
A-2, F-1, Plot No.245, 2nd Phase, G.I.D.C, Vapi, District
Valsad – 396195 Gujarat, India |
|
Tel. No.: |
91-260-6540149 |
|
Area : |
5600 sq. ft. |
|
Location : |
Rented |
|
|
|
|
Branch Office 1: |
60, 4th Floor, Dawa Bazar, Indore – 452001, Madhya Pradesh,
India |
|
Area : |
800 sq. ft. |
|
Location : |
Rented |
|
|
|
|
Branch Office 2: |
27-A, Mayur Complex, Hiran Magri, Sector – 4, Udaipur – 313001,
Rajasthan, India |
|
Area : |
600 sq. ft. |
|
Location : |
Rented |
|
|
|
|
Branch Office 3: |
104, 1st Floor, Prakash Industrial Estate, Shahibabad,
Gajiybad, Uttar Pradesh, India |
|
Area : |
1000 sq. ft. |
|
Location : |
Rented |
DIRECTORS
(AS ON 31.03.2013)
|
Name : |
Mr. Rupesh Namdev |
|
Designation : |
Director |
|
Address : |
301, Shiv Kunj, Plot No. 91 and 92, Sector 28, Vashi, Navi Mumbai – 400705, Maharashtra, India |
|
Date of Birth/Age : |
10.12.1974 |
|
Qualification : |
BE. MBA |
|
Experience : |
15 Years |
|
Date of Appointment : |
21.06.2012 |
|
DIN No.: |
05218101 |
|
|
|
|
Name : |
Dr. Markus Damor |
|
Designation : |
Director |
|
Address : |
Officer Colony, Teh Thandla, District Jhabua – 457661, Madhya Pradesh,
India |
|
Date of Birth/Age : |
10.06.1970 |
|
Qualification : |
MD |
|
Experience : |
8 Years |
|
Date of Appointment : |
21.06.2012 |
|
DIN No.: |
05245116 |
|
|
|
|
Name : |
Mr. Arjunan Kunhiraman Chandrathil |
|
Designation : |
Director |
|
Address : |
House No.10/289, Chhaplisheri, Nani Daman – 396210, Daman and Diu,
India |
|
Date of Birth/Age : |
05.05.1974 |
|
Qualification : |
BA |
|
Experience : |
7 Years |
|
Date of Appointment : |
21.06.2012 |
|
DIN No.: |
05295649 |
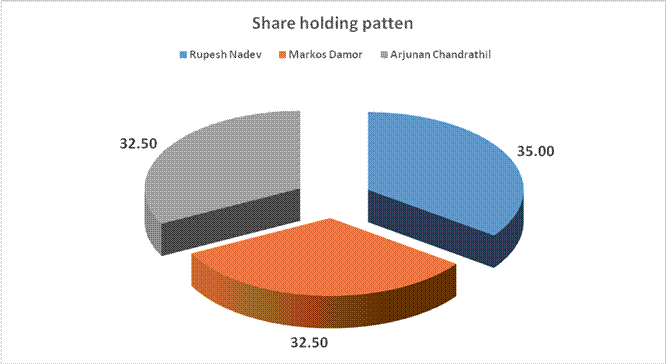
MAJOR SHAREHOLDERS / SHAREHOLDING PATTERN
(AS ON 31.03.2013)
|
Name of Shareholders |
No of Shares |
Percentage |
|
|
|
|
|
Rupesh Nadev |
7000 |
35% |
|
Markos Damor |
6500 |
32.5% |
|
Arjunan Chandrathil |
6500 |
32.5% |
|
|
|
|
|
Total |
20000 |
100.00% |
BUSINESS DETAILS
|
Line of Business : |
Manufacturer and Trader of Adhesive Solvent Cement – Seal. |
|
|
|
|
Terms : |
|
|
Selling : |
Credit (90 days) |
|
|
|
|
Purchasing : |
Credit (60 days) |
GENERAL INFORMATION
|
Suppliers : |
· Brondo Industries · Bridgeon Industries · Rameshwar Printer |
|
|
|
|
Customers : |
Wholesalers and OEM’s · Maruti Tube Center · G C Agency · Lovely General Store and Stationers |
|
|
|
|
No. of Employees : |
32 (Approximately) (Office – 4, Factory – 25, Branch – 3) |
|
|
|
|
Bankers : |
· Punjab National Bank APMC, Vashi, Navi Mumbai – 400703, Maharashtra, India |
|
|
|
|
Facilities : |
-- |
|
|
|
|
Banking
Relations : |
-- |
|
|
|
|
Auditors : |
|
|
Name : |
Negori Shashinand and Associates Chartered Accountants |
|
Address : |
Office No.18, Building No.01, New Sonal Industrial estate, Building
No.1, Opposite Movie Time Theatre, Malad Link, Malad West, Mumbai – 400064, Maharashtra,
India |
|
Mobile No.: |
91-9833490608 |
|
Tel. No.: |
91-22-28880116 |
|
Email : |
|
|
|
|
|
Associates/Subsidiaries : |
· Brondo Industries Gala No.207, Sakti Industrial estate, Riganwada, Daman - 396210, India
Activity: PVC and Adheshive and Solvent Cement · Bridgeon Industries Gala No.208, Sakti Industrial Estate, Riganwada, Daman – 396210, India Activity: Adheshive and Solvent Cement |
CAPITAL STRUCTURE
(AS ON 31.12.2013)
Authorised Capital:
|
No. of Shares |
Type |
Value |
Amount |
|
|
|
|
|
|
50000 |
Equity Shares |
Rs.10/- each |
Rs.0.500 Million |
|
|
|
|
|
Issued, Subscribed & Paid-up Capital:
|
No. of Shares |
Type |
Value |
Amount |
|
|
|
|
|
|
20000 |
Equity Shares |
Rs.10/- each |
Rs.0.200
Million |
|
|
|
|
|
RECONCILIATION OF THE NUMBER OF SHARES OUTSTANDING
|
Particulars |
Equity Shares |
|
|
|
Number |
Rs. In Millions |
|
Shares outstanding at the Beginning of the
year |
-- |
-- |
|
Shares issue during the year |
20000 |
0.200 |
|
Shares bought back during the year |
-- |
-- |
|
Shares outstanding at the end of the year |
20000 |
0.200 |
SHARES HELD BY EACH SHAREHOLDER HOLDING MORE THAN 5 PERCENT SHARES
|
Particulars |
31.12.2013 |
|
|
|
No. of Shares
Held |
% of Holding |
|
|
|
|
|
Rupesh Namdev |
7000 |
35.00 |
|
Markus Damor |
6500 |
32.50 |
|
Arjunan Chandrathil |
6500 |
32.50 |
|
|
|
|
|
Total |
20000 |
100.00 |
FINANCIAL DATA
[All figures are
in Rupees Millions]
ABRIDGED BALANCE
SHEET
|
SOURCES OF FUNDS |
|
31.12.2013 |
31.03.2013 |
|
I.
EQUITY
AND LIABILITIES |
|
|
|
|
(1)Shareholders'
Funds |
|
|
|
|
(a) Share Capital |
|
0.200 |
0.200 |
|
(b) Reserves & Surplus |
|
0.932 |
0.241 |
|
(c) Money
received against share warrants |
|
0.000 |
0.000 |
|
|
|
|
|
|
(2) Share Application money pending
allotment |
|
0.000 |
0.000 |
|
Total
Shareholders’ Funds (1)+(2) |
|
1.132 |
0.441 |
|
|
|
|
|
|
(3) Non-Current
Liabilities |
|
|
|
|
(a) long-term borrowings |
|
3.555 |
3.455 |
|
(b) Deferred tax liabilities (Net) |
|
0.001 |
0.001 |
|
(c) Other long term
liabilities |
|
0.000 |
0.000 |
|
(d) long-term
provisions |
|
0.000 |
0.000 |
|
Total Non-current
Liabilities (3) |
|
3.556 |
3.456 |
|
|
|
|
|
|
(4) Current Liabilities |
|
|
|
|
(a) Short term
borrowings |
|
0.000 |
0.000 |
|
(b) Trade
payables |
|
6.058 |
7.127 |
|
(c) Other
current liabilities |
|
0.296 |
0.229 |
|
(d) Short-term
provisions |
|
0.123 |
0.172 |
|
Total Current
Liabilities (4) |
|
6.477 |
7.528 |
|
|
|
|
|
|
TOTAL |
|
11.165 |
11.425 |
|
|
|
|
|
|
II.
ASSETS |
|
|
|
|
(1) Non-current assets |
|
|
|
|
(a) Fixed
Assets |
|
|
|
|
(i)
Tangible assets |
|
0.543 |
0.137 |
|
(ii)
Intangible Assets |
|
0.000 |
0.000 |
|
(iii)
Capital work-in-progress |
|
0.000 |
0.000 |
|
(iv)
Intangible assets under development |
|
0.000 |
0.000 |
|
(b) Non-current Investments |
|
0.000 |
0.000 |
|
(c) Deferred tax assets (net) |
|
0.000 |
0.000 |
|
(d) Long-term Loan and Advances |
|
0.000 |
0.000 |
|
(e) Other
Non-current assets |
|
0.000 |
0.000 |
|
Total Non-Current
Assets |
|
0.543 |
0.137 |
|
|
|
|
|
|
(2) Current assets |
|
|
|
|
(a)
Current investments |
|
0.000 |
0.000 |
|
(b)
Inventories |
|
4.399 |
7.756 |
|
(c) Trade
receivables |
|
5.199 |
1.446 |
|
(d) Cash
and cash equivalents |
|
0.195 |
1.282 |
|
(e)
Short-term loans and advances |
|
0.000 |
0.000 |
|
(f) Other
current assets |
|
0.829 |
0.804 |
|
Total
Current Assets |
|
10.622 |
11.288 |
|
|
|
|
|
|
TOTAL |
|
11.165 |
11.425 |
PROFIT & LOSS
ACCOUNT
|
|
PARTICULARS |
|
31.12.2013 |
31.03.2013 |
|
|
|
SALES |
|
|
|
|
|
|
|
Revenue from Operations |
|
11.922 |
6.838 |
|
|
|
Other Income |
|
0.001 |
0.004 |
|
|
|
TOTAL (A) |
|
11.923 |
6.842 |
|
|
|
|
|
|
|
|
Less |
EXPENSES |
|
|
|
|
|
|
|
Cost of Materials Consumed |
|
7.286 |
11.961 |
|
|
|
Purchases of stock in trade |
|
0.150 |
0.042 |
|
|
|
Changes in Inventories |
|
0.000 |
(7.755) |
|
|
|
Employee Benefits Expenses |
|
1.796 |
0.996 |
|
|
|
Other Expenses |
|
1.918 |
1.222 |
|
|
|
TOTAL (B) |
|
11.150 |
6.466 |
|
|
|
|
|
|
|
|
Less |
PROFIT
BEFORE INTEREST, TAX, DEPRECIATION AND AMORTISATION (A-B) (C) |
|
0.773 |
0.376 |
|
|
|
|
|
|
|
|
|
Less |
FINANCIAL
EXPENSES (D) |
|
0.004 |
0.007 |
|
|
|
|
|
|
|
|
|
|
PROFIT
BEFORE TAX, DEPRECIATION AND AMORTISATION (C-D) (E) |
|
0.769 |
0.369 |
|
|
|
|
|
|
|
|
|
Less/ Add |
DEPRECIATION/
AMORTISATION (F) |
|
0.078 |
0.004 |
|
|
|
|
|
|
|
|
|
|
PROFIT BEFORE
TAX (E-F) (G) |
|
0.691 |
0.365 |
|
|
|
|
|
|
|
|
|
Less |
TAX (H) |
|
0.000 |
0.124 |
|
|
|
|
|
|
|
|
|
|
PROFIT AFTER TAX
(G-H) (I) |
|
0.691 |
0.241 |
|
|
|
|
|
|
|
|
|
|
Earnings Per
Share (Rs.) |
|
345.50 |
120.50 |
|
KEY RATIOS
|
PARTICULARS |
|
|
31.12.2013 |
31.03.2013 |
|
PAT / Total Income |
(%) |
|
5.80 |
3.52 |
|
|
|
|
|
|
|
Net Profit Margin (PBT/Sales) |
(%) |
|
5.80 |
5.34 |
|
|
|
|
|
|
|
Return on Total Assets (PBT/Total Assets} |
(%) |
|
6.19 |
3.19 |
|
|
|
|
|
|
|
Return on Investment (ROI) (PBT/Networth) |
|
|
0.61 |
0.83 |
|
|
|
|
|
|
|
Debt Equity Ratio (Total Debt/Networth) |
|
|
3.14 |
7.83 |
|
|
|
|
|
|
|
Current Ratio (Current Asset/Current Liability) |
|
|
1.64 |
1.50 |
FINANCIAL ANALYSIS
[All figures are
in Rupees Millions]
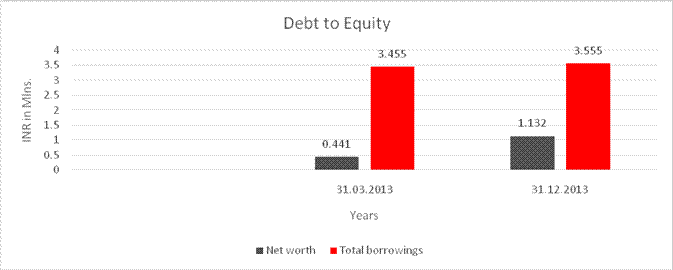
DEBT EQUITY RATIO
|
Particular |
|
31.03.2013 |
31.12.2013 |
|
|
|
(INR in Mlns.) |
(INR in Mlns.) |
|
Share Capital |
|
0.200 |
0.200 |
|
Reserves & Surplus |
|
0.241 |
0.932 |
|
Net worth |
|
0.441 |
1.132 |
|
|
|
|
|
|
long-term borrowings |
|
3.455 |
3.555 |
|
Short term borrowings |
|
0.000 |
0.000 |
|
Total borrowings |
|
3.455 |
3.555 |
|
Debt/Equity ratio |
|
7.834 |
3.140 |
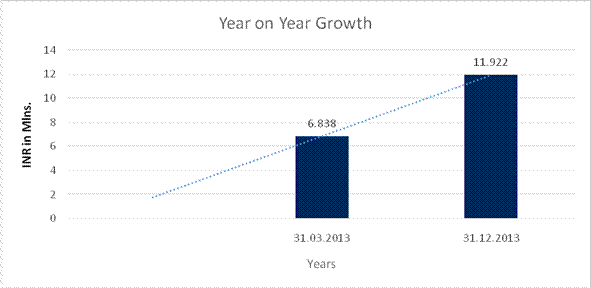
YEAR-ON-YEAR GROWTH
|
Year on Year Growth |
|
31.03.2013 |
31.12.2013 |
|
|
|
(INR in Mlns) |
(INR in Mlns) |
|
Revenue from Operations |
|
6.838 |
11.922 |
|
|
|
74.349 |
NET PROFIT MARGIN
|
Net Profit Margin |
|
31.03.2013 |
31.12.2013 |
|
|
|
(INR in Mlns) |
(INR in Mlns) |
|
Revenue from Operations |
|
6.838 |
11.922 |
|
Profit |
|
0.241 |
0.691 |
|
|
|
3.52% |
5.80% |
LOCAL AGENCY FURTHER INFORMATION
|
Sr. No. |
Check List by Info Agents |
Available in Report (Yes / No) |
|
1] |
Year of Establishment |
Yes |
|
2] |
Locality of the firm |
Yes |
|
3] |
Constitutions of the firm |
Yes |
|
4] |
Premises details |
Yes |
|
5] |
Type of Business |
Yes |
|
6] |
Line of Business |
Yes |
|
7] |
Promoter's background |
Yes |
|
8] |
No. of employees |
Yes |
|
9] |
Name of person contacted |
Yes |
|
10] |
Designation of contact person |
Yes |
|
11] |
Turnover of firm for last three years |
Yes |
|
12] |
Profitability for last three years |
Yes |
|
13] |
Reasons for variation <> 20% |
----- |
|
14] |
Estimation for coming financial year |
Yes |
|
15] |
Capital in the business |
Yes |
|
16] |
Details of sister concerns |
Yes |
|
17] |
Major suppliers |
Yes |
|
18] |
Major customers |
Yes |
|
19] |
Payments terms |
Yes |
|
20] |
Export / Import details (if applicable) |
No |
|
21] |
Market information |
----- |
|
22] |
Litigations that the firm / promoter
involved in |
----- |
|
23] |
Banking Details |
Yes |
|
24] |
Banking facility details |
No |
|
25] |
Conduct of the banking account |
----- |
|
26] |
Buyer visit details |
----- |
|
27] |
Financials, if provided |
Yes |
|
28] |
Incorporation details, if applicable |
Yes |
|
29] |
Last accounts filed at ROC |
Yes |
|
30] |
Major Shareholders, if available |
Yes |
|
31] |
Date of Birth of
Proprietor/Partner/Director, if available |
Yes |
|
32] |
PAN of Proprietor/Partner/Director, if
available |
No |
|
33] |
Voter ID No of Proprietor/Partner/Director,
if available |
No |
|
34] |
External Agency Rating, if available |
No |
------------------------------------------------------------------------------------------------------------------------------
UNSECURED LOANS
|
Particulars |
31.12.2013 (Rs. In Millions) |
31.03.2013 (Rs. In Millions) |
|
Long Term
Borrowings |
|
|
|
Loans and Advances from Related parties |
3.555 |
3.455 |
|
|
|
|
|
Total |
3.555 |
3.455 |
------------------------------------------------------------------------------------------------------------------------------
ASSESSMENT OF WORKING CAPITAL REQUIREMENT
OPERATING STATEMENT
(RS. IN MILLIONS)
|
Particulars |
2013.2014 |
2014.2015 |
2015.2016 |
|
(Provisional) |
(Projections) |
||
|
GROSS SALES |
|
|
|
|
a) Domestic Sales |
16.000 |
50.000 |
62.500 |
|
b) Export Sales |
0.000 |
0.000 |
0.000 |
|
c) Operating Income |
0.005 |
0.025 |
0.025 |
|
Total |
16.005 |
50.025 |
62.525 |
|
|
|
|
|
|
Less: Excise Duty |
0.000 |
0.000 |
0.000 |
|
|
|
|
|
|
NET
SALES |
16.005 |
50.025 |
62.525 |
|
|
|
|
|
|
% age rise (+) or fall (-) in Net Sales |
133.92% |
212.56% |
24.99% |
|
|
|
|
|
|
COST OF SALES |
|
|
|
|
Raw Materials (Including stores and other items
used in manufacturing process) |
|
|
|
|
Imported |
0.000 |
0.000 |
0.000 |
|
Indigenous |
10.000 |
40.000 |
37.500 |
|
|
|
|
|
|
Other Consumables |
|
|
|
|
Imported |
0.000 |
0.000 |
0.000 |
|
Indigenous |
0.000 |
0.000 |
0.000 |
|
|
|
|
|
|
Purchases of finished goods |
0.000 |
0.000 |
0.000 |
|
Electricity Expenses |
0.300 |
1.200 |
1.125 |
|
Labour (Factory, Wages and salaries) |
2.401 |
7.504 |
9.379 |
|
Other Direct Expenses |
0.800 |
3.752 |
4.689 |
|
Depreciation |
0.087 |
0.350 |
0.350 |
|
Sub-total |
13.588 |
52.806 |
53.043 |
|
|
|
|
|
|
Add: Opening Stocks in Process |
6.730 |
4.802 |
15.008 |
|
|
|
|
|
|
Sub-total |
20.318 |
57.607 |
68.051 |
|
Less: Closing Stock in Process |
4.802 |
15.008 |
18.758 |
|
|
|
|
|
|
Cost of Production |
15.516 |
42.600 |
49.293 |
|
|
|
|
|
|
Add: Opening Stock of Finished Goods |
1.026 |
4.001 |
10.005 |
|
|
|
|
|
|
Deduct: Closing Stock of Finished Goods |
4.001 |
10.005 |
12.505 |
|
|
|
|
|
|
Sub-total [Total cost of sales] |
12.541 |
36.596 |
46.793 |
|
GROSS
PROFIT |
3.464 |
13.429 |
15.732 |
|
%
to Sales |
21.64% |
26.84% |
25.16% |
|
|
|
|
|
|
Selling, General & Administrative Expenses (including bonus
payments) |
2.401 |
7.504 |
9.379 |
|
Sub Total |
14.942 |
44.100 |
56.172 |
|
|
|
|
|
|
Operating Profit before interest |
1.063 |
5.925 |
6.353 |
|
|
|
|
|
|
Interest Exps.- Interest |
0.100 |
1.950 |
1.950 |
|
|
|
|
|
|
Operating profit after interest |
0.963 |
3.975 |
4.403 |
|
|
|
|
|
|
(i) Add other non-operating
income |
|
|
|
|
(a) Misc. income |
0.000 |
0.000 |
0.000 |
|
Sub-total
(income) |
0.000 |
0.000 |
0.000 |
|
|
|
|
|
|
(ii) Deduct
other non-operating expense |
|
|
|
|
(a) Directors Remuneration |
0.000 |
0.000 |
0.000 |
|
(b) Interest on Partners' capital |
0.000 |
0.000 |
0.000 |
|
(c) Preliminary Expenses W/off |
0.004 |
0.004 |
0.004 |
|
Sub-total
(expenses) |
0.004 |
0.004 |
0.004 |
|
|
|
|
|
|
(iii) Net of
other non-operating incomes/ expenses (net) |
(0.004) |
(0.004) |
(0.004) |
|
|
|
|
|
|
Profit before tax/loss |
0.959 |
3.971 |
4.399 |
|
|
|
|
|
|
Provision for tax |
0.288 |
1.191 |
1.320 |
|
|
|
|
|
|
Net profit / (loss) |
0.671 |
2.780 |
3.079 |
|
|
|
|
|
|
(i) Equity dividend paid/ Drawings |
-- |
-- |
-- |
|
(ii) Dividend Rate |
-- |
-- |
-- |
|
|
|
|
|
|
Retained Profit |
0.671 |
2.780 |
3.079 |
|
|
|
|
|
|
Retained profit / Net Profit (%age) |
100% |
100% |
100% |
------------------------------------------------------------------------------------------------------------------------------
ANALYSIS OF BALANCE SHEET
(RS. IN MILLIONS)
|
Particulars |
2013.2014 |
2014.2015 |
2015.2016 |
|
|
(Provisional) |
(Projections) |
|
|
CURRENT LIABILITIES |
|
|
|
|
Short
term borrowings from bank (incl. Bills purchased, discounted & excess
borrowings placed on repayment basis) |
|
|
|
|
(i) From applicant bank |
8.000 |
15.000 |
15.000 |
|
(ii)
From other banks |
0.000 |
0.000 |
0.000 |
|
(iii)
of which EP & BD |
0.000 |
0.000 |
0.000 |
|
Sub Total (A) |
8.000 |
15.000 |
15.000 |
|
|
|
|
|
|
Short
term borrowings from others |
0.000 |
0.000 |
0.000 |
|
|
|
|
|
|
Sundry
Creditors - Trade |
3.288 |
9.863 |
9.247 |
|
|
|
|
|
|
Advance
payments from customers/deposits from dealers |
0.000 |
0.000 |
0.000 |
|
|
|
|
|
|
Provision
for Taxation |
0.288 |
1.191 |
1.320 |
|
|
|
|
|
|
Dividend
Payable |
0.000 |
0.000 |
0.000 |
|
|
|
|
|
|
Other
statutory liabilities (due within one year) |
0.200 |
1.000 |
2.000 |
|
|
|
|
|
|
Deposits/Instalments
of term loan/ DPGs/ Debentures etc. (due within one year) |
0.000 |
0.000 |
0.000 |
|
|
|
|
|
|
Other
current liabilities & Provisions (due
within one year) |
1.000 |
4.000 |
5.000 |
|
|
|
|
|
|
Sub Total (B) |
4.775 |
17.054 |
18.566 |
|
|
|
|
|
|
Total Current Liabilities |
12.775 |
32.054 |
33.566 |
|
|
|
|
|
|
TERM LIABILITIES |
|
|
|
|
Debentures
(not maturing within one year) |
0.000 |
0.000 |
0.000 |
|
|
|
|
|
|
Preference
Shares (redeemable after one year) |
0.000 |
0.000 |
0.000 |
|
|
|
|
|
|
Term
loans (excluding instalments payable within one year) |
0.000 |
0.000 |
0.000 |
|
|
|
|
|
|
Differed
Payment Credits (excl. instalments due within one year) |
0.000 |
0.000 |
0.000 |
|
|
|
|
|
|
Term
deposits (repayable after one year) |
0.000 |
0.000 |
0.000 |
|
Long
term Advances (repayable after one year) |
0.000 |
0.000 |
0.000 |
|
|
|
|
|
|
Other
term liabilities – Unsecured Loans (Quasi Capital) |
3.500 |
10.000 |
15.000 |
|
|
|
|
|
|
TOTAL TERM LIABILITIES |
3.500 |
10.000 |
15.000 |
|
|
|
|
|
|
TOTAL OUTSIDE LIABILITIES |
16.275 |
42.054 |
48.566 |
|
|
|
|
|
|
NET WORTH |
|
|
|
|
|
|
|
|
|
Capital |
0.200 |
0.500 |
0.500 |
|
|
|
|
|
|
General
Reserve |
0.000 |
0.000 |
0.000 |
|
|
|
|
|
|
Capital
Addition |
0.000 |
0.000 |
0.000 |
|
|
|
|
|
|
Other
reserves (excluding provisions) |
0.000 |
0.000 |
0.000 |
|
|
|
|
|
|
Surplus
(+) or deficit (-) in Profit & Loss Account |
0.912 |
3.692 |
6.772 |
|
|
|
|
|
|
NET WORTH |
1.112 |
4.192 |
7.272 |
|
|
|
|
|
|
TOTAL
LIABILITIES |
17.388 |
46.247 |
55.838 |
|
|
|
|
|
|
CURRENT ASSETS |
|
|
|
|
|
|
|
|
|
Cash
& Bank balances |
2.255 |
0.767 |
0.455 |
|
|
|
|
|
|
Fixed
Deposits |
0.000 |
0.000 |
0.000 |
|
|
|
|
|
|
Receivables(Domestic) |
3.945 |
12.329 |
15.411 |
|
|
|
|
|
|
Inventories |
|
|
|
|
(i)
Raw materials (including stores and other items in process of manufacture) |
|
|
|
|
-Imported
|
0.000 |
0.000 |
0.000 |
|
-Indigenous
|
0.411 |
1.644 |
1.541 |
|
|
|
|
|
|
(ii)
Stock-in-process |
4.802 |
15.008 |
18.758 |
|
|
|
|
|
|
(iii)
Finished Goods |
4.001 |
10.005 |
12.505 |
|
|
|
|
|
|
(iv)
Other consumable stores |
|
|
|
|
(a)
Imported |
0.000 |
0.000 |
0.000 |
|
(b)
Indigenous |
0.000 |
0.000 |
0.000 |
|
|
|
|
|
|
Advance
to suppliers of Raw materials & stores/spares |
0.000 |
0.000 |
0.000 |
|
|
|
|
|
|
Advance
payment of taxes |
0.100 |
0.300 |
0.300 |
|
|
|
|
|
|
Other
current assets |
1.315 |
4.112 |
5.139 |
|
|
|
|
|
|
Total Current Asset |
16.830 |
44.164 |
54.109 |
|
|
|
|
|
|
FIXED ASSETS |
|
|
|
|
|
|
|
|
|
Gross
Block (land & building machinery vehicles work-in-progress) |
0.621 |
2.500 |
2.500 |
|
|
|
|
|
|
Depreciation
to date |
0.091 |
0.441 |
0.791 |
|
|
|
|
|
|
NET BLOCK |
0.530 |
2.059 |
1.709 |
|
|
|
|
|
|
Investments/book
debts /advances deposits which are not current assets |
0.000 |
0.000 |
0.000 |
|
|
|
|
|
|
i.(a)Investments
in subsidiary companies/ affiliates |
0.000 |
0.000 |
0.000 |
|
(b)Others |
0.000 |
0.000 |
0.000 |
|
|
|
|
|
|
ii.
Advances to suppliers of capital goods & contractors |
0.000 |
0.000 |
0.000 |
|
|
|
|
|
|
iii.
Deferred receivables (maturity exceeding one year) |
0.000 |
0.000 |
0.000 |
|
|
|
|
|
|
iv.
Others |
0.000 |
0.000 |
0.000 |
|
|
|
|
|
|
Non
consumables stores & spare |
0.000 |
0.000 |
0.000 |
|
|
|
|
|
|
Other
non-current assets (incl. Dues from director) |
0.000 |
0.000 |
0.000 |
|
|
|
|
|
|
TOTAL OTHER NON-CURRENT ASSETS |
0.000 |
0.000 |
0.000 |
|
|
|
|
|
|
Intangible
assets (patents, goodwill, prelim, expenses, bad/ doubtful debts not provided
for etc.) |
0.028 |
0.024 |
0.020 |
|
|
|
|
|
|
TOTAL
ASSETS |
17.388 |
46.247 |
55.838 |
|
|
|
|
|
|
TANGIBLE NET WORTH |
1.084 |
4.168 |
7.252 |
|
|
|
|
|
|
NET WORKING CAPITAL |
4.054 |
12.109 |
20.543 |
|
|
|
|
|
|
CURRENT
RATIO |
1.32 |
1.38 |
1.61 |
|
|
|
|
|
|
TOTAL OUTSIDE LIABILITIES / TANGIBLE NET
WORTH |
5.01 |
10.09 |
6.70 |
|
|
|
|
|
|
TOTAL TERM LIABILITIES/ TANGIBLE NET WORTH
DIFFERENCE |
2.77 |
2.26 |
1.51 |
------------------------------------------------------------------------------------------------------------------------------
COMPARATIVE STATEMENT OF CURRENT ASSETS
& CURRENT LIABILITIES
(RS. IN MILLIONS)
|
Particulars |
2013.2014 |
2014.2015 |
2015.2016 |
|
|
(Provisional) |
(Projections) |
|
|
A
CURRENT ASSETS |
|||
|
|
|
|
|
|
Raw Materials (including stores and other
items used in the process of manufacture ) |
|
|
|
|
(b) Imported |
0.000 |
0.000 |
0.000 |
|
Months' Consumption |
-- |
-- |
-- |
|
(b) Indigenous |
0.411 |
1.644 |
1.541 |
|
Months' Consumption |
0.49 |
0.49 |
0.49 |
|
|
|
|
|
|
Other Consumable Spares, excluding those included In 1 above |
|
|
|
|
(a) Imported |
0.000 |
0.000 |
0.000 |
|
Months' Consumption |
-- |
-- |
-- |
|
(b) Indigenous |
0.000 |
0.000 |
0.000 |
|
Months' Consumption |
-- |
-- |
-- |
|
|
|
|
|
|
Stock in Process |
4.802 |
15.008 |
18.758 |
|
Months' Cost of Production |
3.71 |
4.23 |
4.57 |
|
|
|
|
|
|
Finished Goods |
4.001 |
10.005 |
12.505 |
|
Months' Cost of Sales |
3.83 |
3.28 |
3.21 |
|
|
|
|
|
|
Receivables other than Export and Deferred
Receivables (including Bills Purchased and Discounted by Bankers) |
3.945 |
12.329 |
15.411 |
|
Months' Domestic Sales excluding Deferred
Sales |
2.96 |
2.96 |
2.96 |
|
|
|
|
|
|
Export Receivables (including Bills
Purchased& Discounted by Bankers)
|
0.000 |
0.000 |
0.000 |
|
Months' Export Sales |
-- |
-- |
-- |
|
|
|
|
|
|
Advances to Suppliers of Raw Materials
and Stores/Spares Consumables |
0.000 |
0.000 |
0.000 |
|
|
|
|
|
|
Other Current Assets including Cash and
Bank Balances and deferred receivables due within one year (specify major
items) |
3.671 |
5.179 |
5.894 |
|
|
|
|
|
|
TOTAL CURRENT
ASSETS |
16.830 |
44.164 |
54.109 |
|
|
|
|
|
|
B CURRENT
LIABILITIES |
|
|
|
|
(other than Bank Borrowing for Working
Capital) |
|
|
|
|
|
|
|
|
|
Creditors for Purchase of Raw Materials,
Stores & Consumable Spares |
3.288 |
9.863 |
9.247 |
|
Months' Purchases |
2.92 |
2.26 |
2.11 |
|
|
|
|
|
|
Advances from Customers |
0.000 |
0.000 |
0.000 |
|
|
|
|
|
|
Other Statutory Liabilities |
0.200 |
1.000 |
2.000 |
|
|
|
|
|
|
Other Current Liabilities |
1.288 |
6.191 |
7.320 |
|
(Specify major items) |
|
|
|
|
|
|
|
|
|
TOTAL CURRENT
LIABILITIES (To agree with
Sub-Total B In Form III ) |
4.775 |
17.054 |
18.566 |
|
|
3.52 |
2.59 |
2.91 |
------------------------------------------------------------------------------------------------------------------------------
COMPUTATION OF MAXIMUM PERMISSIBLE BANK
FINANCE FOR WORKING CAPITAL
(RS. IN MILLIONS)
|
Particulars |
2013.2014 |
2014.2015 |
2015.2016 |
|
|
(Provisional) |
(Projections) |
|
|
FIRST METHOD OF
LENDING |
|
|
|
|
Total Current Assets |
16.830 |
44.164 |
54.109 |
|
|
|
|
|
|
Other Current Liabilities (other than bank
borrowings) |
4.775 |
17.054 |
18.566 |
|
|
|
|
|
|
Working Capital Gap (WCP) |
12.054 |
27.109 |
35.543 |
|
|
|
|
|
|
Minimum stipulated net working Capital -
25% of total current assets other than Export Receivables |
4.207 |
11.041 |
13.527 |
|
|
|
|
|
|
Actual/projected net working capital |
4.054 |
12.109 |
20.543 |
|
|
|
|
|
|
Item 3 minus item 4 |
7.847 |
16.068 |
22.015 |
|
|
|
|
|
|
Item 3 minus item 5 |
8.000 |
15.000 |
15.000 |
|
|
|
|
|
|
Maximum permissible bank finance (item 6 or
7 whichever is less) |
7.847 |
15.000 |
15.000 |
|
|
|
|
|
|
Excess borrowings, if any representing
short fall in NWC |
0.153 |
0.000 |
0.000 |
------------------------------------------------------------------------------------------------------------------------------
FUND FLOW STATEMENT
(RS. IN MILLIONS)
|
PARTICULARS |
2013.2014 |
2014.2015 |
2015.2016 |
|
|
(Provisional) |
(Projections) |
|
|
Sources |
|
|
|
|
[a] Net profit (after tax) |
0.671 |
2.780 |
3.079 |
|
[b] Depreciation |
|
|
|
|
Debited in P and L A/c |
0.087 |
0.350 |
0.350 |
|
[c] Increase in Capital |
0.000 |
0.300 |
0.000 |
|
[d] Increased in Term Liab. (including
Public deposits) |
0.045 |
6.500 |
5.000 |
|
[e] Decrease in |
|
|
|
|
[i] Fixed Assets |
0.000 |
0.000 |
0.000 |
|
[ii]
Other non-current Assets |
0.000 |
0.000 |
0.000 |
|
[f] Others (Unsecured Loans) |
|
|
|
|
-Preliminary Expenses W/off |
0.004 |
0.004 |
0.004 |
|
-Share Application Money |
(0.001) |
0.000 |
0.000 |
|
-premium on Equity Capital |
0.000 |
0.000 |
0.000 |
|
[g] Total |
0.806 |
9.934 |
8.433 |
|
|
|
|
|
|
Application |
|
|
|
|
[a] Net Loss |
0.000 |
0.000 |
0.000 |
|
[b] Decrease in Term Liab. (Incl. Public
deposits) |
0.000 |
0.000 |
0.000 |
|
[c] Increase in |
|
|
|
|
[i] Fixed Assets |
0.481 |
1.879 |
0.000 |
|
[ii] Other non-current Assets |
0.000 |
0.000 |
0.000 |
|
[d] Withdrawals |
0.000 |
0.000 |
0.000 |
|
[e] Others (Unsecured loans) |
0.000 |
0.000 |
0.000 |
|
[f] Total |
0.481 |
1.879 |
0.000 |
|
|
|
|
|
|
Long Term Surplus (+)/ Deficit (-) (1 minus 2) |
0.325 |
8.055 |
8.433 |
|
|
|
|
|
|
Increase/ Decrease in current assets |
5.574 |
27.334 |
9.945 |
|
|
|
|
|
|
Increase/ Decrease in current Liabilities
other than bank borrowings |
(2.752) |
12.279 |
1.512 |
|
|
|
|
|
|
Increase/ Decrease in working capital Gap |
8.325 |
15.055 |
8.433 |
|
|
|
|
|
|
Net Surplus (+) / deficit (-) (Difference
of 3 & 6) |
(8.000) |
(7.000) |
0.000 |
|
|
|
|
|
|
Increase/ Decrease in Bank Borrowings |
8.000 |
7.000 |
0.000 |
|
|
|
|
|
|
* Break up of (4) |
|
|
|
|
[i]
Increase/ Decrease in Raw material |
0.411 |
1.233 |
(0.103) |
|
[ii]
Increase/ Decrease in Stock in process |
(1.929) |
10.206 |
3.750 |
|
[iii]
Increase/ Decrease in finished goods |
2.975 |
6.004 |
2.500 |
|
[iv]
Increase/ Decrease in Receivables |
|
|
|
|
[a] Domestic |
2.499 |
8.384 |
3.082 |
|
[b] Export |
0.000 |
0.000 |
0.000 |
|
[iii]
Increase/ Decrease in stores & spares |
0.000 |
0.000 |
0.000 |
|
[iii]
Increase/ Decrease in other Current Assets |
1.617 |
1.508 |
0.716 |
|
|
|
|
|
|
Total |
5.574 |
27.334 |
9.945 |
---------------------------------------------------------------------------------------------------------------------------
FINANCIAL HIGHLIGHTS AND RATIOS
(RS. IN MILLIONS)
|
Particulars |
2013.2014 |
2014.2015 |
2015.2016 |
|
|
(Provisional) |
(Projections) |
|
|
|
|
|
|
|
Paid up Capital |
0.200 |
0.500 |
0.500 |
|
Reserves and surplus (Excluding revolution
reserves) |
0.912 |
3.692 |
6.772 |
|
Intangible Assets |
0.028 |
0.024 |
0.020 |
|
Tangible Net worth |
1.084 |
4.168 |
7.252 |
|
Gross Fixed Assets -
Depreciation to date |
0.621 0.091 |
2.500 0.441 |
2.500 0.791 |
|
-
Net Fixed Assets |
0.530 |
2.059 |
1.709 |
|
|
|
|
|
|
Capital Expenditure during the year |
0.481 |
1.879 |
0.000 |
|
Long term Debts from banks/ Financial institution
|
-- |
-- |
-- |
|
Total term Liabilities |
3.500 |
10.000 |
15.000 |
|
Total Outside Liabilities |
16.275 |
42.054 |
48.566 |
|
Current Assets |
16.830 |
44.164 |
54.109 |
|
Current Liabilities |
12.775 |
32.054 |
33.566 |
|
Net Working Capital |
4.054 |
12.109 |
20.543 |
|
Net Sales |
16.005 |
50.025 |
62.525 |
|
Gross Profit |
1.150 |
6.275 |
6.703 |
|
Operating Profit |
0.963 |
3.975 |
4.403 |
|
Net Profit After Tax |
0.671 |
2.780 |
3.079 |
|
Cash Accruals (16 Depr. + Other Non Cash
Items) |
0.758 |
3.130 |
3.429 |
|
Retained profit |
0.671 |
2.780 |
3.079 |
|
|
|
|
|
|
RATIOS : |
|
|
|
|
Current ratio |
1.32 |
1.38 |
1.61 |
|
|
|
|
|
|
Debt/Equity Ratio |
3.23 |
2.40 |
2.07 |
|
|
|
|
|
|
Funded debt / Net Worth Ratio |
-- |
-- |
-- |
|
|
|
|
|
|
TOL/ TNW |
15.01 |
10.09 |
6.70 |
|
|
|
|
|
|
Bank Borrowings / TOL |
0.49 |
0.36 |
0.31 |
|
|
|
|
|
|
Operating Profit/ Net Sales (%) |
6.02% |
7.95% |
7.04% |
|
|
|
|
|
|
Net profit/ Net Sales (%) |
4.19% |
5.56% |
4.93% |
|
|
|
|
|
|
Equity Dividend (%) |
0.00% |
0.00% |
0.00% |
|
|
|
|
|
|
Retained Profit/ Net Profit (%) |
100.00% |
100.00% |
100.00% |
------------------------------------------------------------------------------------------------------------------------------
NETWORTH STATEMENT
MR.
MARKUS DAMOR
(RS. IN MILLIONS)
|
Particulars |
31.12.2013 Current Value |
|
ASSETS |
|
|
|
|
|
Cash and Bank Balance |
0.198 |
|
|
|
|
Investments |
|
|
Capital in Bridge on Industries |
0.787 |
|
Shares of Bennett Industries Private Limited
|
0.065 |
|
|
|
|
Fixed Assets |
|
|
Flat |
6.000 |
|
Motor Car |
1.500 |
|
Gold and Jewellary |
0.450 |
|
|
|
|
NET WORTH |
8.999 |
NETWORTH STATEMENT
MR.
RUPESH NAMDEV
(RS. IN MILLIONS)
|
Particulars |
31.12.2013 Current Value |
|
ASSETS |
|
|
|
|
|
Cash and Bank Balance |
0.195 |
|
|
|
|
Investments |
|
|
Capital in Brondo Industries |
2.216 |
|
Shares of Bennett Industries Private Limited
|
0.070 |
|
Less Loan from Bennett Industries Private
Limited |
(0.362) |
|
|
|
|
Fixed Assets |
|
|
Flat |
7.500 |
|
Gala |
4.200 |
|
Motor Car |
2.200 |
|
Gold and Jewellery |
0.550 |
|
Less Housing Loan |
(4.000) |
|
Less Car Loan |
(0.425) |
|
|
|
|
NET WORTH |
12.144 |
NETWORTH STATEMENT
MR.
ARJUNAN CHANDRATHIL
(RS. IN MILLIONS)
|
Particulars |
31.12.2013 Current Value |
|
ASSETS |
|
|
|
|
|
Cash and Bank Balance |
0.050 |
|
|
|
|
Investments |
|
|
Capital in Brondo Industries |
2.338 |
|
Shares of Bennett Industries Private Limited
|
0.065 |
|
Less Loan from Bennett Industries Private
Limited |
(0.050) |
|
|
|
|
Fixed Assets |
|
|
Motor Car |
0.300 |
|
Gold and Jewellery |
0.100 |
|
|
|
|
NET WORTH |
2.803 |
------------------------------------------------------------------------------------------------------------------------------
INDEX OF CHARGES: NO CHARGES EXIST FOR COMPANY
------------------------------------------------------------------------------------------------------------------------------
NOTE:
The Registered office of the company has been
shifted from Plot No.31, Flat No.3, Gokul Dham, Sector 28, Vashi, Navi Mumbai –
400705, Maharashtra, India, to the present address.
------------------------------------------------------------------------------------------------------------------------------
FIXED ASSETS:
· Furniture and Fixture
· Weighing Scale
· Machinery
CMT REPORT (Corruption, Money Laundering & Terrorism]
The Public Notice information has been collected from various sources
including but not limited to: The Courts,
1] INFORMATION ON
DESIGNATED PARTY
No exist designating subject or any of its beneficial owners,
controlling shareholders or senior officers as terrorist or terrorist
organization or whom notice had been received that all financial transactions involving
their assets have been blocked or convicted, found guilty or against whom a
judgement or order had been entered in a proceedings for violating
money-laundering, anti-corruption or bribery or international economic or
anti-terrorism sanction laws or whose assets were seized, blocked, frozen or
ordered forfeited for violation of money laundering or international
anti-terrorism laws.
2] Court Declaration :
No exist to suggest that subject is or was
the subject of any formal or informal allegations, prosecutions or other
official proceeding for making any prohibited payments or other improper
payments to government officials for engaging in prohibited transactions or
with designated parties.
3] Asset Declaration :
No records exist to suggest that the property or assets of the subject
are derived from criminal conduct or a prohibited transaction.
4] Record on Financial
Crime :
Charges or conviction
registered against subject: None
5] Records on Violation of
Anti-Corruption Laws :
Charges or
investigation registered against subject: None
6] Records on Int’l
Anti-Money Laundering Laws/Standards :
Charges or
investigation registered against subject: None
7] Criminal Records
No
available information exist that suggest that subject or any of its principals
have been formally charged or convicted by a competent governmental authority
for any financial crime or under any formal investigation by a competent
government authority for any violation of anti-corruption laws or international
anti-money laundering laws or standard.
8] Affiliation with
Government :
No record
exists to suggest that any director or indirect owners, controlling
shareholders, director, officer or employee of the company is a government
official or a family member or close business associate of a Government
official.
9] Compensation Package :
Our market
survey revealed that the amount of compensation sought by the subject is fair
and reasonable and comparable to compensation paid to others for similar
services.
10] Press Report :
No press reports / filings exists on
the subject.
CORPORATE GOVERNANCE
MIRA INFORM as part of its Due Diligence do provide comments on
Corporate Governance to identify management and governance. These factors often
have been predictive and in some cases have created vulnerabilities to credit
deterioration.
Our Governance Assessment focuses principally on the interactions
between a company’s management, its Board of Directors, Shareholders and other
financial stakeholders.
CONTRAVENTION
Subject is not known to have contravened any existing local laws,
regulations or policies that prohibit, restrict or otherwise affect the terms
and conditions that could be included in the agreement with the subject.
FOREIGN EXCHANGE RATES
|
Currency |
Unit
|
Indian Rupees |
|
US Dollar |
1 |
Rs.59.95 |
|
|
1 |
Rs.99.36 |
|
Euro |
1 |
Rs.82.15 |
INFORMATION DETAILS
|
Information
Gathered by : |
SVA |
|
|
|
|
Analysis Done by
: |
KAR |
|
|
|
|
Report Prepared
by : |
NIT |
SCORE & RATING EXPLANATIONS
|
SCORE FACTORS |
RANGE |
POINTS |
|
HISTORY |
1~10 |
3 |
|
PAID-UP CAPITAL |
1~10 |
3 |
|
OPERATING SCALE |
1~10 |
3 |
|
FINANCIAL CONDITION |
|
|
|
--BUSINESS SCALE |
1~10 |
3 |
|
--PROFITABILIRY |
1~10 |
3 |
|
--LIQUIDITY |
1~10 |
3 |
|
--LEVERAGE |
1~10 |
3 |
|
--RESERVES |
1~10 |
3 |
|
--CREDIT LINES |
1~10 |
3 |
|
--MARGINS |
-5~5 |
-- |
|
DEMERIT POINTS |
|
|
|
--BANK CHARGES |
YES/NO |
YES |
|
--LITIGATION |
YES/NO |
NO |
|
--OTHER ADVERSE INFORMATION |
YES/NO |
NO |
|
MERIT POINTS |
|
|
|
--SOLE DISTRIBUTORSHIP |
YES/NO |
NO |
|
--EXPORT ACTIVITIES |
YES/NO |
NO |
|
--AFFILIATION |
YES/NO |
YES |
|
--LISTED |
YES/NO |
NO |
|
--OTHER MERIT FACTORS |
YES/NO |
YES |
|
DEFAULTER |
|
|
|
--RBI |
YES/NO |
NO |
|
--EPF |
YES/NO |
NO |
|
TOTAL |
|
27 |
This score serves as a reference to assess
SC’s credit risk and to set the amount of credit to be extended. It is
calculated from a composite of weighted scores obtained from each of the major
sections of this report. The assessed factors and their relative weights (as
indicated through %) are as follows:
Financial
condition (40%) Ownership
background (20%) Payment
record (10%)
Credit history
(10%) Market trend (10%) Operational size
(10%)
RATING EXPLANATIONS
|
RATING |
STATUS |
PROPOSED CREDIT LINE |
|
|
>86 |
Aaa |
Possesses an extremely sound financial base with the strongest
capability for timely payment of interest and principal sums |
Unlimited |
|
71-85 |
Aa |
Possesses adequate working capital. No caution needed for credit transaction.
It has above average (strong) capability for payment of interest and
principal sums |
Large |
|
56-70 |
A |
Financial & operational base are regarded healthy. General
unfavourable factors will not cause fatal effect. Satisfactory capability for
payment of interest and principal sums |
Fairly Large |
|
41-55 |
Ba |
Overall operation is considered normal. Capable to meet normal
commitments. |
Satisfactory |
|
26-40 |
B |
Capability to overcome financial difficulties seems comparatively below
average. |
Small |
|
11-25 |
Ca |
Adverse factors are apparent. Repayment of interest and principal sums
in default or expected to be in default upon maturity |
Limited with
full security |
|
<10 |
C |
Absolute credit risk exists. Caution needed to be exercised |
Credit not
recommended |
|
-- |
NB |
New Business |
-- |
This report is issued at your request without any
risk and responsibility on the part of MIRA INFORM PRIVATE LIMITED (MIPL) or
its officials.