MIRA INFORM REPORT
|
Report Date : |
11.04.2014 |
IDENTIFICATION DETAILS
|
Name : |
ORELLANA UNO SL |
|
|
|
|
Registered Office : |
C/ Orellana, 1 4º Derecha. - Madrid - 28004 - Madrid |
|
|
|
|
Country : |
Spain |
|
|
|
|
Financials (as on) : |
31.12.2012 |
|
|
|
|
Date of Incorporation : |
21.12.1994 |
|
|
|
|
Legal Form : |
Private Company |
|
|
|
|
Line of Business : |
Subject is engaged in design, elaboration and retail sale of
clothes, mainly for women. |
|
|
|
|
No. of Employees |
85 |
RATING & COMMENTS
|
MIRA’s Rating : |
Ca |
|
RATING |
STATUS |
PROPOSED CREDIT LINE |
|
|
11-25 |
Ca |
Adverse factors are apparent. Repayment of interest and principal sums
in default or expected to be in default upon maturity |
Limited with
full security |
|
Status : |
Moderate |
|
Payment Behaviour : |
Irregular |
|
Litigation : |
Clear |
NOTES :
Any query related to this report can be made
on e-mail : infodept@mirainform.com
while quoting report number, name and date.
ECGC Country Risk Classification List – december 01, 2013
|
Country Name |
Previous Rating (30.09.2013) |
Current Rating (01.12.2013) |
|
Spain |
A2 |
A2 |
|
Risk Category |
ECGC
Classification |
|
Insignificant |
A1 |
|
Low |
A2 |
|
Moderate |
B1 |
|
High |
B2 |
|
Very High |
C1 |
|
Restricted |
C2 |
|
Off-credit |
D |
SPAIN ECONOMIC OVERVIEW
Spain experienced a prolonged recession in the wake of the global financial crisis. GDP contracted by 3.7% in 2009, ending a 16-year growth trend, and continued contracting through most of 2013. Economic growth resumed in late 2013, albeit only modestly, as credit contraction in the private sector, fiscal austerity, and high unemployment continued to weigh on domestic consumption and investment. Exports, however, have been resilient throughout the economic downturn, partially offsetting declines in domestic consumption and helped to bring Spain's current account into surplus in 2013 for the first time since 1986. The unemployment rate rose from a low of about 8% in 2007 to more than 26% in 2013, straining Spain's public finances as spending on social benefits increased while tax revenues fell. Spain’s budget deficit peaked at 11.4% of GDP in 2009. Spain gradually reduced the deficit to just under 7% of GDP in 2013, slightly above the 6.5% target negotiated between Spain and the EU. Public debt has increased substantially – from 60.1% of GDP in 2010 to 93.4% in 2013. Rising labor productivity, moderating labor costs, and lower inflation have helped to improve foreign investor interest in the economy and to reduce government borrowing costs. The government's ongoing efforts to implement reforms - labor, pension, health, tax, and education - are aimed at supporting investor sentiment. The government also has shored up struggling banks exposed to Spain's depressed domestic construction and real estate sectors by successfully completing an EU-funded restructuring and recapitalization program in December 2013
|
Source
: CIA |
Company
name and address
|
Name: |
ORELLANA UNO SL |
|
NIF / Fiscal code: |
B81055410 |
|
Trade Name |
BDBA |
|
Status: |
ACTIVE |
|
Incorporation Date: |
21/12/1994 |
|
Register Data |
Register Section 8 Sheet 143480 |
|
Last Publication in BORME: |
24/12/2012 [Appointments] |
|
Last Published Account Deposit: |
2012 |
|
Share Capital: |
1.219.444 |
|
|
|
|
Localization: |
C/ ORELLANA, 1 4º DERECHA. - MADRID - 28004 - MADRID |
|
Telephone - Fax - Email - Website: |
Ph.:. 912192173 Email. orellana@bdba.com Website. www.bdba.com |
|
|
|
|
Activity: |
|
|
NACE: |
4751 - Retail sale of textiles in specialised stores |
|
Registered Trademarks: |
|
|
Audited / Opinion: |
Si / |
|
Tenders and Awards: |
0 for a total cost of 0 |
|
Subsidies: |
0 for a total cost of 0 |
|
Quality Certificate: |
No |
|
|
|
Defaults,
Legal Claims and Insolvency Proceedings
|
|
|
|
Number |
Amount (€) |
Most Recent Entry |
|
Insolvency Proceedings, Bankruptcy and Suspension of Payments |
|
Unpublished |
--- |
--- |
|
Defaults on debt with Financial Institutions and Large Companies |
|
1 |
4.629,77 |
--- |
|
Judicial Claims (Notices, Executive Proceedings, Attachments, Auctions, Bad Debt) |
|
None |
0 |
--- |
|
Proceedings heard by the Civil Court |
|
Unpublished |
0 |
--- |
|
Proceedings heard by the Labour Court |
|
Unpublished |
0 |
--- |
Partners
|
|
RAUL PEREZ HERREROS |
50 % |
|
|
SONIA RODRIGUEZ RUIZ |
50 % |
|
|
Shares: |
0 |
|
|
Other Links: |
1 |
|
|
No. of Active Corporate Bodies: |
JOINT MANAGER 2 |
|
|
Ratios |
2012 |
2011 |
Change |
|
|
|
|
|
Guarantees: |
|
|
Properties Registered: |
Company NO, Administrator NO |
|
Financing / Guarantee Sources : |
Sources YES, Guarantees YES |
|
|
|
|
|
|
INVESTIGATION
SUMMARY
|
|
|
The mercantile entity ORELLANA UNO SL with VAT number B81055410 was founded in Madrid by an undefined period of time in December, 1994 and it is engaged in design, elaboration and retail sale of clothes. It recently showed some instability. We advise to control its commercial evolution. |
|
Identification
|
|
|
Social Denomination: |
ORELLANA UNO SL |
|
Trade Name: |
BDBA |
|
NIF / Fiscal code: |
B81055410 |
|
Corporate Status: |
ACTIVE |
|
Start of activity: |
1995 |
|
Registered Office: |
C/ ORELLANA, 1 4º DERECHA. |
|
Locality: |
MADRID |
|
Province: |
MADRID |
|
Postal Code: |
28004 |
|
Telephone: |
912192173 |
|
Fax: |
913082406 |
|
Website: |
www.bdba.com |
|
Email: |
orellana@bdba.com |
Activity
|
|
|
NACE: |
4751 |
|
CNAE Obtaining Source: |
4751 |
|
Additional Information: |
The trade name of the subject is BDBA and it is engaged in design, elaboration and retail sale of clothes, mainly for women. |
|
Additional Address: |
Its registered office is located in calle Orellana nº 1, 4D, 28004 inMadrid. |
|
Franchise: |
No |
|
Import / export: |
DOES NOT IMPORT / DOES NOT EXPORT |
|
Future Perspective: |
Face recession |
|
Industry situation: |
Maturity |
Number
of Employees
|
|
|
Year |
No. of employees |
Established |
Incidentals |
|
|
|
2014 |
85 |
|
|
|
Chronological
Summary
|
|||
|
|
Year |
Act |
|
|
|
1995 |
Accounts deposit (ejer. 1994) Appointments/ Re-elections (1) Company Formation (1) |
|
|
|
1996 |
Increase of Capital (1) |
|
|
|
1997 |
Accounts deposit (ejer. 1995) |
|
|
|
1998 |
Accounts deposit (ejer. 1996, 1997) Adaptation to Law (1) Appointments/ Re-elections (2) Cessations/ Resignations/ Reversals (1) |
|
|
|
1999 |
Accounts deposit (ejer. 1998) |
|
|
|
2000 |
Accounts deposit (ejer. 1999) |
|
|
|
2002 |
Accounts deposit (ejer. 2000) Appointments/ Re-elections (1) Cessations/ Resignations/ Reversals (1) Statutory Modifications (1) |
|
|
|
2003 |
Accounts deposit (ejer. 2001) Change of Social address (1) Increase of Capital (1) Statutory Modifications (1) |
|
|
|
2004 |
Accounts deposit (ejer. 2002, 2003) Increase of Capital (1) |
|
|
|
2005 |
Accounts deposit (ejer. 2004) Increase of Capital (1) Statutory Modifications (1) |
|
|
|
2006 |
Accounts deposit (ejer. 2005) |
|
|
|
2007 |
Accounts deposit (ejer. 2006) |
|
|
|
2008 |
Accounts deposit (ejer. 2007) |
|
|
|
2009 |
Accounts deposit (ejer. 2008) |
|
|
|
2010 |
Accounts deposit (ejer. 2009) |
|
|
|
2012 |
Accounts deposit (ejer. 2010, 2011) Appointments/ Re-elections (1) Errata (1) Increase of Capital (2) Other Concepts/ Events (2) |
|
|
|
2013 |
Accounts deposit (ejer. 2012) |
|
Breakdown
of Owners' Equity
|
|
|
Registered Capital: |
1.219.444 |
|
Paid up capital: |
1.219.444 |
Updated
Evolution of the Subscribed and Paid-in Capital
|
|||||
|
|
|||||
|
Publishing Date |
Registration Type |
Capital Subscribed |
Paid up capital |
Underwritten result |
Disbursed Result |
|
23/01/1995 |
Company Formation |
3.005 |
3.005 |
3.005 |
3.005 |
|
17/05/1996 |
Increase of Capital |
30.051 |
30.051 |
33.056 |
33.056 |
|
26/03/2003 |
Increase of Capital |
168.959 |
168.959 |
202.015 |
202.015 |
|
10/12/2004 |
Increase of Capital |
195.525 |
195.525 |
397.540 |
397.540 |
|
27/07/2005 |
Increase of Capital |
199.999 |
199.999 |
597.539 |
597.539 |
|
29/03/2012 |
Increase of Capital |
472.205 |
472.205 |
1.069.744 |
1.069.744 |
|
30/10/2012 |
Increase of Capital |
149.700 |
149.700 |
1.219.444 |
1.219.444 |

Active
Social Bodies
|
|
Post published |
Social Body's Name |
Appointment Date |
Other Positions in this Company |
|
JOINT MANAGER |
PEREZ HERREROS RAUL |
17/10/2002 |
2 |
|
|
RODRIGUEZ RUIZ SONIA |
17/10/2002 |
3 |
|
JOINT ATTORNEY |
RODRIGUEZ RUIZ SONIA |
17/03/1998 |
3 |
|
|
PEREZ HERREROS RAUL |
17/03/1998 |
2 |
|
ACCOUNTS' AUDITOR / HOLDER |
SALAS Y MARAVER SOCIEDAD ESPAÑOLA DE AUDITORIA SL |
13/12/2012 |
1 |
Historical
Social Bodies
|
|
Social Body's Name |
Post published |
End Date |
Other Positions in this Company |
|
CORDERO BARRAGAN FRANCISCO JAVIER |
JOINT MANAGER |
11/03/1998 |
1 |
|
GOMEZ MELENDEZ ANTONIO |
SINGLE ADMINISTRATOR |
17/10/2002 |
1 |
|
RODRIGUEZ RUIZ SONIA |
JOINT MANAGER |
11/03/1998 |
3 |
Executive
board
|
|
Post |
NIF |
Name |
|
ADMINISTRATOR |
|
RAUL PEREZ HERREROS |
|
ADMINISTRATOR |
|
SONIA RODRIGUEZ RUIZ |
Defaults,
Legal Claims and Insolvency Proceedings
|
Section enabling assessment of the degree of compliance of the company queried with its payment obligations. It provides information on the existence and nature of all stages of Insolvency and Legal Proceedings published with reference to the Company in the country's various Official Bulletins and national newspapers, as well Defaults Registered in the main national credit bureaus (ASNEF Industrial and RAI ).
> Summary
Chronological summary
|
|
|
Number of Publications |
Amount (_) |
Start date |
End date |
|
Insolvency Proceedings, Bankruptcy and Suspension of Payments |
|
Unpublished |
--- |
--- |
--- |
|
Request/Declaration |
|
0 |
--- |
date |
|
|
Proceedings |
|
--- |
--- |
|
--- |
|
Resolution |
|
--- |
--- |
|
--- |
|
Defaults on debt with Financial Institutions and Large Companies |
Bank and Commercial Delinquency |
1 |
0 |
15/12/2013 |
08/04/2014 |
|
Status: Friendly |
|
--- |
|
|
|
|
Status: Pre-Litigation |
|
--- |
|
|
|
|
Status: Litigation |
|
--- |
|
|
|
|
Status: Non-performing |
|
--- |
|
|
|
|
Status: insolvency proceedings, bankruptcy and suspension of payments |
|
--- |
|
|
|
|
Other status |
|
1 |
|
|
|
|
Legal and Administrative Proceedings |
|
Unpublished |
--- |
|
|
|
Notices of defaults and enforcement |
|
--- |
--- |
|
--- |
|
Seizures |
|
--- |
--- |
|
--- |
|
Auctions |
|
--- |
--- |
|
--- |
|
Declarations of insolvency and bad debt |
|
--- |
--- |
|
--- |
|
Proceedings heard by the Civil Court |
|
Unpublished |
--- |
|
|
|
Proceedings heard by the Labour Court |
|
Unpublished |
--- |
|
|
> Details
IMPAGOS EN ENTIDADES FINANCIERAS
Y GRANDES EMPRESAS
Section comprising a list of the instances of default recorded in the ASNEF Industrial file under the name of .
List of current instances of default for each of the transactions in progress
|
Type of creditor |
Product |
Value of transactions (_) |
Status |
No. of defaults |
Default balance (_) |
Date of first default |
Date of last default |
|
SOCIEDADES DE SEGUROS CREDITICIOS |
Seguros, alquiler |
100000.00 |
Otros |
1 |
4629.77 |
15/12/13 |
15/12/13 |
|
|
|
4.629,77 |
|
|
|
||
Legal Notice:
This data has been obtained from consultation of the ASNEF Industrial register. It may only be used for the purposes of awarding credit, monitoring credit and managing loans. This data may not be reused or included in any database, and may not be ceded .
> Basis for rating
|
Positive Factors |
Adverse Factors |
|
No judicial claims have been detected in the Official Gazettes, regarding any Company's outstanding debts with the Tax Bureau or Social Security administrations, as submitted by Courts of the various court jurisdictions. {POSITIVO}Adequate level of financial autonomy. The financial autonomy of the entity represents the 33.60 %. In principle, an increase in this ratio would indicate an improvement in the corporate's balace sheets.{/POSITIVO} The current debt represents a 39.93of the financial structure. In principle, a decrease in this ratio would indicate an improvement in the short-term financial situation. It has financial profitability.. ORELLANA UNO SL obtains financial return as a consequence of an investment in its own resources which, a priori, might improve its financial and economic situation. Positive Working CapitalThe Company's Working Capital quality is significant, i.e. much of the Company financing comes from its equity. A structure is considered optimal if its liquidity level is slightly above its debt volume as a result of low idleness levels of its financial resources involved. |
It has been found to have irregular payment performance and has not paid all of its debts timely. No Company's subsidiaries or branches are known. Private consumption continues to have, in spite of some signs of improvement, very low rates , thus showing great weakness. Audit qualifications . The company has submitted the audit with a qualified opinion, indicating that the financial statements may not reflect the true picture because of the existence of circumstances that may be significant. Among the companies with similar characteristics, ORELLANA UNO SL is located in one of the autonomous communities that have shown lesser business development in Spain. In principle, this feature hinders the consolidation of companies. |
Probability
of default
|
> Probabilidad Estimada de Impago para los próximos 12 meses: 5.005 %
|
Sector in which comparison is carried out : 475 Retail sale of other household equipment in specialised stores |
|
|
Relative Position:
|
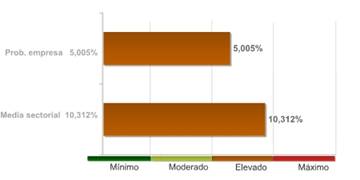
The company's comparative analysis with the rest of the companies that comprise the sector, shows the company holds a better position with regard to the probability of non-compliance.
The probability of the company's non-compliance with its payment obligations within deadlines estimated by our qualifications models is 5.00%.
In the event they fail to comply with the payment, the seriousness of the loss will depend on factors such as the promptness of the commencement of the charging management, the existence of executive documents which match the credit or the existence of guarantees and free debt assets under the name of the debtor. Therefore, the probability of non-compliance should not be solely interpreted as the total loss of the owed amount.
LEGAL
CLAIMS
|
|
|
|
|
|
|
|
No se han publicado |
|
|
|
No se han publicado |
|
|
|
|
|
|
|
No se han publicado |
|
|
|
No se han publicado |
|
|
|
No se han publicado |
|
|
|
No se han publicado |
|
|
|
|
|
|
|
No se han publicado |
|
|
|
No se han publicado |
|
|
|
|
|
|
|
No se han publicado |
|
Clients |
|
|
Name |
NIF |
Telephone |
|
|
|
EL CORTE INGLES SA |
A28017895 |
901122122 |
|
Link
List
|
|
IS RELATED WITH: |
1 Entities |
|
SHAREHOLDERS: |
2 Entities |
> Shareholders
|
Relationship |
Entity |
Province |
Shareholding stake |
|
SHAREHOLDERS |
RAUL PEREZ HERREROS |
|
50 |
|
|
SONIA RODRIGUEZ RUIZ |
|
50 |
> Other
relationships
|
Relationship |
Entity |
Province |
Shareholding stake |
|
IS RELATED WITH |
ALTAIR SEVEN SL |
MADRID |
|
Turnover
|
|
|
Total Sales 2012 |
7.242.679,49 |
Financial
Accounts and Balance Sheets
|
Financial Years Presented
|
Ejercicio |
Tipo de Cuentas Anuales |
Fecha Presentacion |
|
2012 |
Normales |
May 2013 |
|
2011 |
Normales |
July 2012 |
|
2010 |
Normales |
January 2012 |
|
2009 |
Normales |
October 2010 |
|
2008 |
Normales |
September 2009 |
|
2007 |
Normales |
September 2008 |
|
2006 |
Normales |
August 2007 |
|
2005 |
Normales |
September 2006 |
|
2004 |
Normales |
August 2005 |
|
2003 |
Normales |
August 2004 |
|
2002 |
Normales |
July 2004 |
|
2001 |
Normales |
February 2003 |
|
2000 |
Normales |
October 2002 |
|
1999 |
Normales |
September 2000 |
|
1998 |
Normales |
October 1999 |
|
1997 |
Normales |
October 1998 |
|
1996 |
Normales |
February 1998 |
|
1995 |
Normales |
February 1997 |
|
1994 |
Normales |
October 1995 |
The data in the report regarding the last Company Accounts submitted by the company is taken from the TRADE REGISTER serving the region in which the company's address is located 31/12/2012
> Balance en formato Normal de acuerdo al Nuevo Plan General Contable 2007
Information corresponding to the fiscal year 2012 2011 2010 2009 2008 is taken from information submitted to the TRADE REGISTER. Data corresponding to fiscal years before 2012 2011 2010 2009 2008 has been compiled based on the equivalence criteria stipulated in Act JUS/206/2009. Where the provisions of the Act did not establish relevant equivalence criteria, axesor created such criteria using its own methodology. To view details on the methodology.
|
|
ORIGINAL |
ORIGINAL |
ORIGINAL |
ORIGINAL |
ORIGINAL |
|
|
Assets |
2012 |
2011 |
2010 |
2009 |
2008 |
|
|
A) NON-CURRENT ASSETS: 11000 |
2.032.609,00 |
820.919,00 |
327.277,00 |
222.351,00 |
270.968,00 |
|
|
I. Intangible fixed assets : 11100 |
560.565,00 |
242.468,00 |
8.319,00 |
11.064,00 |
13.980,00 |
|
|
1. Development: 11110 |
0,00 |
0,00 |
0,00 |
0,00 |
0,00 |
|
|
2. Concessions: 11120 |
0,00 |
0,00 |
0,00 |
0,00 |
0,00 |
|
|
3. Patents, licencing, trade marks and similar: 11130 |
7.994,00 |
0,00 |
0,00 |
0,00 |
0,00 |
|
|
4. Goodwill: 11140 |
0,00 |
0,00 |
0,00 |
0,00 |
0,00 |
|
|
5. IT applications: 11150 |
166.237,00 |
0,00 |
0,00 |
0,00 |
0,00 |
|
|
6. Investigation: 11160 |
0,00 |
0,00 |
0,00 |
0,00 |
0,00 |
|
|
7. Other intangible fixed assets: 11170 |
386.333,00 |
0,00 |
0,00 |
0,00 |
0,00 |
|
|
II. Tangible fixed assets : 11200 |
1.053.022,00 |
447.553,00 |
266.276,00 |
163.943,00 |
209.644,00 |
|
|
1. Land and buildings: 11210 |
70.451,00 |
0,00 |
0,00 |
0,00 |
0,00 |
|
|
2. Technical installations and other tangible fixed assets: 11220 |
982.571,00 |
0,00 |
0,00 |
0,00 |
0,00 |
|
|
3. Tangible asset in progress and advances: 11230 |
0,00 |
0,00 |
0,00 |
0,00 |
0,00 |
|
|
III. Real estate investment: 11300 |
0,00 |
0,00 |
0,00 |
0,00 |
0,00 |
|
|
1. Land: 11310 |
0,00 |
0,00 |
0,00 |
0,00 |
0,00 |
|
|
2. Buildings: 11320 |
0,00 |
0,00 |
0,00 |
0,00 |
0,00 |
|
|
IV. Long-term investments in Group companies and associates : 11400 |
0,00 |
0,00 |
0,00 |
0,00 |
0,00 |
|
|
1. Equity instruments: 11410 |
0,00 |
0,00 |
0,00 |
0,00 |
0,00 |
|
|
2. Credits to businesses: 11420 |
0,00 |
0,00 |
0,00 |
0,00 |
0,00 |
|
|
3. Debt securities: 11430 |
0,00 |
0,00 |
0,00 |
0,00 |
0,00 |
|
|
4. Derivatives : 11440 |
0,00 |
0,00 |
0,00 |
0,00 |
0,00 |
|
|
5. Other financial assets : 11450 |
0,00 |
0,00 |
0,00 |
0,00 |
0,00 |
|
|
6. Other investments: 11460 |
0,00 |
0,00 |
0,00 |
0,00 |
0,00 |
|
|
V. Long-term financial investments: 11500 |
419.023,00 |
130.899,00 |
52.681,00 |
47.344,00 |
47.344,00 |
|
|
1. Equity instruments: 11510 |
0,00 |
0,00 |
0,00 |
0,00 |
0,00 |
|
|
2. Credits to third parties : 11520 |
0,00 |
0,00 |
0,00 |
0,00 |
0,00 |
|
|
3. Debt securities: 11530 |
0,00 |
0,00 |
0,00 |
0,00 |
0,00 |
|
|
4. Derivatives : 11540 |
0,00 |
0,00 |
0,00 |
0,00 |
0,00 |
|
|
5. Other financial assets : 11550 |
419.023,00 |
0,00 |
0,00 |
0,00 |
0,00 |
|
|
6. Other investments: 11560 |
0,00 |
0,00 |
0,00 |
0,00 |
0,00 |
|
|
VI. Assets for deferred tax : 11600 |
0,00 |
0,00 |
0,00 |
0,00 |
0,00 |
|
|
VII. Non-current trade debts : 11700 |
0,00 |
0,00 |
0,00 |
0,00 |
0,00 |
|
|
B) CURRENT ASSETS: 12000 |
3.880.030,00 |
3.000.575,00 |
2.758.796,00 |
2.386.169,00 |
2.071.027,00 |
|
|
I. Non-current assets held for sale : 12100 |
0,00 |
0,00 |
0,00 |
0,00 |
0,00 |
|
|
II. Stocks: 12200 |
2.984.153,00 |
2.704.488,00 |
2.273.175,00 |
1.757.799,00 |
1.659.893,00 |
|
|
1. Commercial: 12210 |
2.480.373,00 |
0,00 |
0,00 |
0,00 |
0,00 |
|
|
2. Primary material and other supplies: 12220 |
55.414,00 |
0,00 |
0,00 |
0,00 |
0,00 |
|
|
3. Work in progress: 12230 |
0,00 |
0,00 |
0,00 |
0,00 |
0,00 |
|
|
a) Of long-term production cycle : 12231 |
0,00 |
0,00 |
0,00 |
0,00 |
0,00 |
|
|
b) Of short-term production cycle : 12232 |
0,00 |
0,00 |
0,00 |
0,00 |
0,00 |
|
|
4. Finished goods: 12240 |
0,00 |
0,00 |
0,00 |
0,00 |
0,00 |
|
|
a) Of long-term production cycle : 12241 |
0,00 |
0,00 |
0,00 |
0,00 |
0,00 |
|
|
b) Of short-term production cycle : 12242 |
0,00 |
0,00 |
0,00 |
0,00 |
0,00 |
|
|
5. By-products, residues and recycled materials: 12250 |
0,00 |
0,00 |
0,00 |
0,00 |
0,00 |
|
|
6. Advances to suppliers: 12260 |
448.365,00 |
0,00 |
0,00 |
0,00 |
0,00 |
|
|
III. Trade debtors and others receivable accounts: 12300 |
251.218,00 |
159.710,00 |
206.251,00 |
475.703,00 |
147.902,00 |
|
|
1. Trade debtors / accounts receivable: 12310 |
248.138,00 |
159.710,00 |
206.208,00 |
475.660,00 |
147.902,00 |
|
|
a) Long-term receivables from sales and services supplied : 12311 |
0,00 |
0,00 |
0,00 |
0,00 |
0,00 |
|
|
b) Customers for sales and provisions of services : 12312 |
248.138,00 |
159.710,00 |
206.208,00 |
475.660,00 |
147.902,00 |
|
|
2. Customers, Group companies and associates : 12320 |
0,00 |
0,00 |
0,00 |
0,00 |
0,00 |
|
|
3. Other accounts receivable: 12330 |
2.800,00 |
0,00 |
43,00 |
43,00 |
0,00 |
|
|
4. Personnel: 12340 |
280,00 |
0,00 |
0,00 |
0,00 |
0,00 |
|
|
5. Assets for deferred tax: 12350 |
0,00 |
0,00 |
0,00 |
0,00 |
0,00 |
|
|
6. Other debtors, including tax and social security: 12360 |
0,00 |
0,00 |
0,00 |
0,00 |
0,00 |
|
|
7. Called up share capital: 12370 |
0,00 |
0,00 |
0,00 |
0,00 |
0,00 |
|
|
IV. Short-term investments in Group companies and associates: 12400 |
0,00 |
49.488,00 |
52.335,00 |
53.010,00 |
57.661,00 |
|
|
1. Equity instruments: 12410 |
0,00 |
0,00 |
0,00 |
0,00 |
0,00 |
|
|
2. Credits to businesses: 12420 |
0,00 |
0,00 |
0,00 |
0,00 |
0,00 |
|
|
3. Debt securities: 12430 |
0,00 |
0,00 |
0,00 |
0,00 |
0,00 |
|
|
4. Derivatives : 12440 |
0,00 |
0,00 |
0,00 |
0,00 |
0,00 |
|
|
5. Other financial assets : 12450 |
0,00 |
0,00 |
0,00 |
0,00 |
0,00 |
|
|
6. Other investments: 12460 |
0,00 |
0,00 |
0,00 |
0,00 |
0,00 |
|
|
V. Short-term financial investments : 12500 |
0,00 |
0,00 |
0,00 |
0,00 |
0,00 |
|
|
1. Equity instruments: 12510 |
0,00 |
0,00 |
0,00 |
0,00 |
0,00 |
|
|
2. Credits to businesses: 12520 |
0,00 |
0,00 |
0,00 |
0,00 |
0,00 |
|
|
3. Debt securities: 12530 |
0,00 |
0,00 |
0,00 |
0,00 |
0,00 |
|
|
4. Derivatives : 12540 |
0,00 |
0,00 |
0,00 |
0,00 |
0,00 |
|
|
5. Other financial assets : 12550 |
0,00 |
0,00 |
0,00 |
0,00 |
0,00 |
|
|
6. Other investments: 12560 |
0,00 |
0,00 |
0,00 |
0,00 |
0,00 |
|
|
VI. Short-term accruals: 12600 |
214.415,00 |
0,00 |
38.412,00 |
0,00 |
59.277,00 |
|
|
VII. Cash and other equivalent liquid assets : 12700 |
430.244,00 |
86.889,00 |
188.623,00 |
99.657,00 |
146.295,00 |
|
|
1. Treasury: 12710 |
430.244,00 |
0,00 |
0,00 |
0,00 |
0,00 |
|
|
2. Other equivalent liquid assets: 12720 |
0,00 |
0,00 |
0,00 |
0,00 |
0,00 |
|
|
TOTAL ASSETS (A + B) : 10000 |
5.912.639,00 |
3.821.494,00 |
3.086.073,00 |
2.608.520,00 |
2.341.996,00 |
|
|
|
ORIGINAL |
ORIGINAL |
ORIGINAL |
ORIGINAL |
ORIGINAL |
|
|
Liabilities and Net Worth |
2012 |
2011 |
2010 |
2009 |
2008 |
|
|
A) NET WORTH: 20000 |
1.986.571,00 |
1.325.568,00 |
1.060.053,00 |
1.011.520,00 |
950.737,00 |
|
|
A-1) Shareholders' equity: 21000 |
1.986.571,00 |
1.325.568,00 |
1.060.053,00 |
1.011.520,00 |
950.737,00 |
|
|
I. Capital: 21100 |
1.219.444,00 |
597.539,00 |
597.539,00 |
597.539,00 |
597.539,00 |
|
|
1. Registered capital : 21110 |
1.219.444,00 |
597.539,00 |
597.539,00 |
597.539,00 |
597.539,00 |
|
|
2. (Uncalled capital): 21120 |
0,00 |
0,00 |
0,00 |
0,00 |
0,00 |
|
|
II. Share premium: 21200 |
0,00 |
0,00 |
0,00 |
0,00 |
0,00 |
|
|
III. Reserves: 21300 |
197.001,00 |
140.938,00 |
139.895,00 |
125.646,00 |
114.322,00 |
|
|
1. Legal y estatutarias: 21310 |
68.635,00 |
0,00 |
0,00 |
0,00 |
0,00 |
|
|
2. Other reserves: 21320 |
128.367,00 |
0,00 |
0,00 |
0,00 |
0,00 |
|
|
IV. (Common stock equity): 21400 |
0,00 |
0,00 |
0,00 |
0,00 |
0,00 |
|
|
V. Results from previous periods: 21500 |
539.324,00 |
309.659,00 |
274.086,00 |
227.552,00 |
207.330,00 |
|
|
1. Brought forward: 21510 |
539.324,00 |
0,00 |
0,00 |
0,00 |
0,00 |
|
|
2. (Negative results from previous periods): 21520 |
0,00 |
0,00 |
0,00 |
0,00 |
0,00 |
|
|
VI. Other shareholders' contributions: 21600 |
0,00 |
0,00 |
0,00 |
0,00 |
0,00 |
|
|
VII. Result of the period: 21700 |
30.802,00 |
277.431,00 |
48.534,00 |
60.782,00 |
31.547,00 |
|
|
VIII. (Interim dividend): 21800 |
0,00 |
0,00 |
0,00 |
0,00 |
0,00 |
|
|
IX. Other net worth instruments: 21900 |
0,00 |
0,00 |
0,00 |
0,00 |
0,00 |
|
|
A-2) Adjustments due to changes in value: 22000 |
0,00 |
0,00 |
0,00 |
0,00 |
0,00 |
|
|
I. Financial assets held for sale: 22100 |
0,00 |
0,00 |
0,00 |
0,00 |
0,00 |
|
|
II. Hedge operations: 22200 |
0,00 |
0,00 |
0,00 |
0,00 |
0,00 |
|
|
III. Linked non-current assets and liabilities held for sale : 22300 |
0,00 |
0,00 |
0,00 |
0,00 |
0,00 |
|
|
IV. Exchange rate difference: 22400 |
0,00 |
0,00 |
0,00 |
0,00 |
0,00 |
|
|
V. Other: 22500 |
0,00 |
0,00 |
0,00 |
0,00 |
0,00 |
|
|
A-3) Received subsidies, donations and legacies: 23000 |
0,00 |
0,00 |
0,00 |
0,00 |
0,00 |
|
|
B) NON-CURRENT LIABILITIES: 31000 |
1.564.871,00 |
172.627,00 |
100.000,00 |
0,00 |
0,00 |
|
|
I. Long-term provisions: 31100 |
0,00 |
0,00 |
0,00 |
0,00 |
0,00 |
|
|
1. Long-term employee benefits liability: 31110 |
0,00 |
0,00 |
0,00 |
0,00 |
0,00 |
|
|
2. Environmental actions: 31120 |
0,00 |
0,00 |
0,00 |
0,00 |
0,00 |
|
|
3. Restructuring provisions: 31130 |
0,00 |
0,00 |
0,00 |
0,00 |
0,00 |
|
|
4. Other provisions: 31140 |
0,00 |
0,00 |
0,00 |
0,00 |
0,00 |
|
|
II Long-term creditors: 31200 |
1.564.871,00 |
172.627,00 |
100.000,00 |
0,00 |
0,00 |
|
|
1. Liabilities and other securities: 31210 |
0,00 |
0,00 |
0,00 |
0,00 |
0,00 |
|
|
2. Amounts owed to credit institutions: 31220 |
1.558.703,00 |
172.627,00 |
100.000,00 |
0,00 |
0,00 |
|
|
3. Creditors from financial leasing: 31230 |
6.168,00 |
0,00 |
0,00 |
0,00 |
0,00 |
|
|
4. Derivatives : 31240 |
0,00 |
0,00 |
0,00 |
0,00 |
0,00 |
|
|
5. Other financial liabilities : 31250 |
0,00 |
0,00 |
0,00 |
0,00 |
0,00 |
|
|
III. Long-term debts with Group companies and associates: 31300 |
0,00 |
0,00 |
0,00 |
0,00 |
0,00 |
|
|
IV. Liabilities for deferred tax: 31400 |
0,00 |
0,00 |
0,00 |
0,00 |
0,00 |
|
|
V. Long-term accruals: 31500 |
0,00 |
0,00 |
0,00 |
0,00 |
0,00 |
|
|
VI. Non-current trade creditors : 31600 |
0,00 |
0,00 |
0,00 |
0,00 |
0,00 |
|
|
VII. Special long-term debts : 31700 |
0,00 |
0,00 |
0,00 |
0,00 |
0,00 |
|
|
C) CURRENT LIABILITIES : 32000 |
2.361.197,00 |
2.323.300,00 |
1.926.019,00 |
1.597.000,00 |
1.391.258,00 |
|
|
I. Liabilities linked to non-current assets held for sale: 32100 |
0,00 |
0,00 |
0,00 |
0,00 |
0,00 |
|
|
II. Short-term provisions: 32200 |
0,00 |
17.950,00 |
0,00 |
0,00 |
0,00 |
|
|
III. Short-term creditors : 32300 |
1.602.769,00 |
1.774.007,00 |
1.156.787,00 |
690.711,00 |
350.196,00 |
|
|
1. Liabilities and other securities: 32310 |
0,00 |
0,00 |
0,00 |
0,00 |
0,00 |
|
|
2. Amounts owed to credit institutions: 32320 |
1.291.353,00 |
1.504.252,00 |
958.055,00 |
485.979,00 |
127.770,00 |
|
|
3. Creditors from financial leasing: 32330 |
4.857,00 |
0,00 |
0,00 |
0,00 |
0,00 |
|
|
4. Derivatives : 32340 |
0,00 |
0,00 |
0,00 |
0,00 |
0,00 |
|
|
5. Other financial liabilities : 32350 |
306.559,00 |
0,00 |
0,00 |
0,00 |
0,00 |
|
|
IV. Short-term debts with Group companies and associates: 32400 |
0,00 |
389.605,00 |
399.128,00 |
508.565,00 |
508.565,00 |
|
|
V. Trade creditors and other accounts payable: 32500 |
758.428,00 |
141.737,00 |
370.104,00 |
397.725,00 |
532.498,00 |
|
|
1. Suppliers: 32510 |
116.036,00 |
-660.328,00 |
3.270,00 |
56.539,00 |
47.893,00 |
|
|
a) Long-term debts : 32511 |
0,00 |
0,00 |
0,00 |
0,00 |
0,00 |
|
|
b) Short-term debts : 32512 |
116.036,00 |
-660.328,00 |
3.270,00 |
56.539,00 |
47.893,00 |
|
|
2. Suppliers, Group companies and associates: 32520 |
0,00 |
0,00 |
0,00 |
0,00 |
0,00 |
|
|
3. Other creditors: 32530 |
453.181,00 |
0,00 |
0,00 |
0,00 |
0,00 |
|
|
4. Personnel (remuneration due): 32540 |
7.058,00 |
0,00 |
0,00 |
0,00 |
0,00 |
|
|
5. Liabilities for current tax: 32550 |
401,00 |
0,00 |
0,00 |
0,00 |
0,00 |
|
|
6. Otras deudas con las Administraciones Públicas. : 32560 |
95.445,00 |
0,00 |
0,00 |
0,00 |
0,00 |
|
|
7. Advances from clients: 32570 |
86.307,00 |
0,00 |
0,00 |
0,00 |
0,00 |
|
|
VI. Short-term accruals: 32600 |
0,00 |
0,00 |
0,00 |
0,00 |
0,00 |
|
|
VII. Special short-term debts : 32700 |
0,00 |
0,00 |
0,00 |
0,00 |
0,00 |
|
|
TOTAL NET WORTH AND LIABILITIES (A + B + C) : 30000 |
5.912.639,00 |
3.821.494,00 |
3.086.073,00 |
2.608.520,00 |
2.341.996,00 |
|
|
|
ORIGINAL |
ORIGINAL |
ORIGINAL |
ORIGINAL |
ORIGINAL |
|
|
Profit and Loss |
2012 |
2011 |
2010 |
2009 |
2008 |
|
|
1. Net turnover: 40100 |
7.242.679,00 |
6.061.052,00 |
4.968.853,00 |
4.449.088,00 |
4.100.035,00 |
|
|
a) Sales: 40110 |
7.242.679,00 |
0,00 |
0,00 |
0,00 |
0,00 |
|
|
b) Rendering of services: 40120 |
0,00 |
0,00 |
0,00 |
0,00 |
0,00 |
|
|
2. Changes in stocks of finished goods and work in progress: 40200 |
0,00 |
0,00 |
0,00 |
50.355,00 |
0,00 |
|
|
3. Works carried out by the company for its assets: 40300 |
0,00 |
0,00 |
0,00 |
0,00 |
0,00 |
|
|
4. Supplies : 40400 |
-2.892.274,00 |
-2.754.819,00 |
-2.883.037,00 |
-2.688.089,00 |
-2.404.822,00 |
|
|
a) Stock consumption: 40410 |
-2.844.482,00 |
0,00 |
0,00 |
0,00 |
0,00 |
|
|
b) Consumption of raw materials and miscellaneous consumable ones: 40420 |
-47.792,00 |
0,00 |
0,00 |
0,00 |
0,00 |
|
|
c) Works carried out by other companies: 40430 |
0,00 |
0,00 |
0,00 |
0,00 |
0,00 |
|
|
d) Impairment of stock, primary material and other supplies: 40440 |
0,00 |
0,00 |
0,00 |
0,00 |
0,00 |
|
|
5. Other operating income: 40500 |
15.536,00 |
19.316,00 |
1.004,00 |
5.060,00 |
27.565,00 |
|
|
a) Auxiliary income and other from current management: 40510 |
15.536,00 |
0,00 |
0,00 |
0,00 |
0,00 |
|
|
b) Operation subsidies included in the Period's result: 40520 |
0,00 |
0,00 |
0,00 |
0,00 |
0,00 |
|
|
6. Personnel costs: 40600 |
-1.780.873,00 |
-1.247.916,00 |
-983.169,00 |
-742.850,00 |
-702.891,00 |
|
|
a) Wages, salaries et al.: 40610 |
-1.331.365,00 |
0,00 |
0,00 |
0,00 |
0,00 |
|
|
b) Social security costs: 40620 |
-449.508,00 |
0,00 |
0,00 |
0,00 |
0,00 |
|
|
c) Provisions : 40630 |
0,00 |
0,00 |
0,00 |
0,00 |
0,00 |
|
|
7. Other operating costs: 40700 |
-2.228.072,00 |
-1.574.804,00 |
-970.481,00 |
-931.610,00 |
-913.397,00 |
|
|
a) External services: 40710 |
-2.196.996,00 |
0,00 |
0,00 |
0,00 |
0,00 |
|
|
b) Taxes: 40720 |
-56.404,00 |
0,00 |
0,00 |
0,00 |
0,00 |
|
|
c) Losses, impairments and variation in provisions from trade operations : 40730 |
25.514,00 |
0,00 |
0,00 |
0,00 |
0,00 |
|
|
d) Other current management expenditure : 40740 |
-185,00 |
0,00 |
0,00 |
0,00 |
0,00 |
|
|
8. Amortisation of fixed assets: 40800 |
-176.192,00 |
-89.346,00 |
-63.789,00 |
-59.309,00 |
-65.995,00 |
|
|
9. Allocation of subsidies of non-financial fixed assets and other: 40900 |
0,00 |
0,00 |
0,00 |
0,00 |
0,00 |
|
|
10. Excess provisions : 41000 |
0,00 |
0,00 |
0,00 |
0,00 |
0,00 |
|
|
11. Impairment and result of transfers of fixed assets: 41100 |
0,00 |
0,00 |
0,00 |
0,00 |
0,00 |
|
|
a) Impairment and losses : 41110 |
0,00 |
0,00 |
0,00 |
0,00 |
0,00 |
|
|
b) Results for transfers and other : 41120 |
0,00 |
0,00 |
0,00 |
0,00 |
0,00 |
|
|
12. Negative difference in combined businesses: 41200 |
0,00 |
0,00 |
0,00 |
0,00 |
0,00 |
|
|
13. Other results : 41300 |
55.528,00 |
11.534,00 |
7.509,00 |
0,00 |
0,00 |
|
|
A.1) OPERATING INCOME (1 + 2 + 3 + 4 + 5 + 6 + 7 + 8 + 9 + 10 + 11 + 12 + 13) : 49100 |
236.333,00 |
425.017,00 |
76.890,00 |
82.645,00 |
40.495,00 |
|
|
14. Financial income : 41400 |
1.050,00 |
1.624,00 |
2.353,00 |
3.634,00 |
5.032,00 |
|
|
a) Of shares in equity instruments : 41410 |
0,00 |
0,00 |
0,00 |
0,00 |
0,00 |
|
|
a 1) In Group companies and associates: 41411 |
0,00 |
0,00 |
0,00 |
0,00 |
0,00 |
|
|
a 2) In third parties: 41412 |
0,00 |
0,00 |
0,00 |
0,00 |
0,00 |
|
|
b) From negotiable securities and other financial instruments : 41420 |
1.050,00 |
0,00 |
0,00 |
0,00 |
0,00 |
|
|
b 1) From Group companies and associates : 41421 |
0,00 |
0,00 |
0,00 |
0,00 |
0,00 |
|
|
b 2) From third parties : 41422 |
1.050,00 |
0,00 |
0,00 |
0,00 |
0,00 |
|
|
c) Allocation of financial subsidies, donations and legacies : 41430 |
0,00 |
0,00 |
0,00 |
0,00 |
0,00 |
|
|
15. Financial expenditure: 41500 |
-176.253,00 |
-38.280,00 |
-15.195,00 |
-4.708,00 |
-6.187,00 |
|
|
a) Amounts owed to Group companies and associates : 41510 |
0,00 |
0,00 |
0,00 |
0,00 |
0,00 |
|
|
b) For debts with third parties : 41520 |
-176.253,00 |
0,00 |
0,00 |
0,00 |
0,00 |
|
|
c) Stock renewal : 41530 |
0,00 |
0,00 |
0,00 |
0,00 |
0,00 |
|
|
16. Changes in fair value of financial instruments : 41600 |
0,00 |
-437,00 |
0,00 |
-33,00 |
0,00 |
|
|
a) Trading book and other : 41610 |
0,00 |
0,00 |
0,00 |
0,00 |
0,00 |
|
|
b) Allocation of financial assets held for sale to the result for the period: 41620 |
0,00 |
0,00 |
0,00 |
0,00 |
0,00 |
|
|
17. Exchange rate differences : 41700 |
-15.836,00 |
-6.218,00 |
-2.037,00 |
-3.219,00 |
0,00 |
|
|
18. Impairment and result for transfers of financial instruments: 41800 |
0,00 |
0,00 |
0,00 |
0,00 |
0,00 |
|
|
a) Impairment and losses : 41810 |
0,00 |
0,00 |
0,00 |
0,00 |
0,00 |
|
|
b) Results for transfers and other : 41820 |
0,00 |
0,00 |
0,00 |
0,00 |
0,00 |
|
|
19. Other financial income and expenditure: 42100 |
0,00 |
0,00 |
0,00 |
0,00 |
0,00 |
|
|
a) Incorporation of financial expenditure to assets: 42110 |
0,00 |
0,00 |
0,00 |
0,00 |
0,00 |
|
|
b) Financial income from arrangement with creditors: 42120 |
0,00 |
0,00 |
0,00 |
0,00 |
0,00 |
|
|
c) Other income and expenditure: 42130 |
0,00 |
0,00 |
0,00 |
0,00 |
0,00 |
|
|
A.2) FINANCIAL REVENUE (14+15+16+17+18+19) : 49200 |
-191.038,00 |
-43.312,00 |
-14.880,00 |
-4.325,00 |
-1.155,00 |
|
|
A.3) NET RESULT BEFORE TAXES (A.1+A.2) : 49300 |
45.294,00 |
381.705,00 |
62.011,00 |
78.320,00 |
39.340,00 |
|
|
20. Income taxes: 41900 |
-14.492,00 |
-104.273,00 |
-13.477,00 |
-17.537,00 |
-7.792,00 |
|
|
A.4) PROFIT AFTER TAXES (A.3+20) : 49400 |
30.802,00 |
0,00 |
0,00 |
0,00 |
0,00 |
|
|
21. Result of the year coming from interrupted operations : 42000 |
0,00 |
0,00 |
0,00 |
0,00 |
0,00 |
|
|
A.5) RESULT OF THE PERIOD (A.4+21) : 49500 |
30.802,00 |
277.431,00 |
48.534,00 |
60.782,00 |
31.547,00 |
|
> Normal Balance Sheet under the rules of the 1990 General Accounting Plan (repealed since 1st January of 2008)
Information corresponding to the fiscal year 2012 2011 2010 2009 2008 has been compiled based on the equivalence criteria stipulated in Act JUS/206/2009. Where the provisions of the Act did not establish relevant equivalence criteria, Axesor created such criteria using its own methodology. To view details on the methodology 2012 2011 2010 2009 2008 is taken from information submitted to the TRADE REGISTER.
|
|
EQUIVALENCIA |
EQUIVALENCIA |
EQUIVALENCIA |
EQUIVALENCIA |
EQUIVALENCIA |
|
|
ASSETS |
2012 |
2011 |
2010 |
2009 |
2008 |
|
|
A) SHAREHOLDERS (PARTNERS) BY UNCALLED SUSCRIBED CAPITAL: |
0,00 |
0,00 |
0,00 |
0,00 |
0,00 |
|
|
B) FIXED ASSETS: |
2.032.609,00 |
820.919,00 |
327.277,00 |
222.351,00 |
270.968,00 |
|
|
I. Formation expenses: |
0,00 |
0,00 |
0,00 |
0,00 |
0,00 |
|
|
II. Intangible fixed assets: |
560.565,00 |
242.468,00 |
8.319,00 |
11.064,00 |
13.980,00 |
|
|
III. Tangible fixed assets: |
1.053.022,00 |
447.553,00 |
266.276,00 |
163.943,00 |
209.644,00 |
|
|
IV. Financial investments: |
419.023,00 |
130.899,00 |
52.681,00 |
47.344,00 |
47.344,00 |
|
|
V. Own shares: |
0,00 |
0,00 |
0,00 |
0,00 |
0,00 |
|
|
VI. Long-term trade receivables: |
0,00 |
0,00 |
0,00 |
0,00 |
0,00 |
|
|
C) Deferred expenses: |
0,00 |
0,00 |
0,00 |
0,00 |
0,00 |
|
|
D) CURRENT ASSETS: |
3.880.030,00 |
3.000.575,00 |
2.758.796,00 |
2.386.169,00 |
2.071.027,00 |
|
|
I. Called-up share capital (not paid): |
0,00 |
0,00 |
0,00 |
0,00 |
0,00 |
|
|
II. Stocks: |
2.984.153,00 |
2.704.488,00 |
2.273.175,00 |
1.757.799,00 |
1.659.893,00 |
|
|
III. Debtors: |
251.218,00 |
159.710,00 |
206.251,00 |
475.703,00 |
147.902,00 |
|
|
IV. Short-term investments: |
0,00 |
49.488,00 |
52.335,00 |
53.010,00 |
57.661,00 |
|
|
V. Short-term treasury shares: |
0,00 |
0,00 |
0,00 |
0,00 |
0,00 |
|
|
VI. Cash at bank and in hand: |
430.244,00 |
86.889,00 |
188.623,00 |
99.657,00 |
146.295,00 |
|
|
VII. Prepayments and accrued income: |
214.415,00 |
0,00 |
38.412,00 |
0,00 |
59.277,00 |
|
|
GENERAL TOTAL (A + B + C + D): |
5.912.639,00 |
3.821.494,00 |
3.086.073,00 |
2.608.520,00 |
2.341.996,00 |
|
MERCANTILE REGISTRY.
|
|
EQUIVALENCIA |
EQUIVALENCIA |
EQUIVALENCIA |
EQUIVALENCIA |
EQUIVALENCIA |
|
|
LIABILITIES |
2012 |
2011 |
2010 |
2009 |
2008 |
|
|
A) EQUITY: |
1.986.571,00 |
1.325.568,00 |
1.060.053,00 |
1.011.520,00 |
950.737,00 |
|
|
I. Subscribed capital: |
1.219.444,00 |
597.539,00 |
597.539,00 |
597.539,00 |
597.539,00 |
|
|
II. Share premium: |
0,00 |
0,00 |
0,00 |
0,00 |
0,00 |
|
|
III. Revaluation reserves: |
0,00 |
0,00 |
0,00 |
0,00 |
0,00 |
|
|
IV. Reserves: |
197.001,00 |
140.938,00 |
139.895,00 |
125.646,00 |
114.322,00 |
|
|
a) Differences for capital adjustment to euros: |
0,00 |
0,00 |
0,00 |
0,00 |
0,00 |
|
|
b) Remaining Reserves: |
197.001,00 |
140.938,00 |
139.895,00 |
125.646,00 |
114.322,00 |
|
|
V. Profit or loss brought forward: |
539.324,00 |
309.659,00 |
274.086,00 |
227.552,00 |
207.330,00 |
|
|
VI. Profit or loss for the financial year: |
30.802,00 |
277.431,00 |
48.534,00 |
60.782,00 |
31.547,00 |
|
|
VII. Interim dividend paid: |
0,00 |
0,00 |
0,00 |
0,00 |
0,00 |
|
|
VIII. Own shares for capital reduction: |
0,00 |
0,00 |
0,00 |
0,00 |
0,00 |
|
|
B) Deferred income: |
0,00 |
0,00 |
0,00 |
0,00 |
0,00 |
|
|
C) PROVISIONS FOR LIABILITIES AND CHARGES: |
0,00 |
0,00 |
0,00 |
0,00 |
0,00 |
|
|
D) LONG TERM LIABILITIES: |
1.564.871,00 |
172.627,00 |
100.000,00 |
0,00 |
0,00 |
|
|
E) SHORT TERM CREDITORS: |
2.361.197,00 |
2.305.350,00 |
1.926.019,00 |
1.597.000,00 |
1.391.258,00 |
|
|
F) SHORT-TERM PROVISIONS FOR LIABILITIES AND CHARGES: |
0,00 |
17.950,00 |
0,00 |
0,00 |
0,00 |
|
|
GENERAL TOTAL (A + B + C + D + E + F): |
5.912.639,00 |
3.821.494,00 |
3.086.073,00 |
2.608.520,00 |
2.341.996,00 |
|
MERCANTILE REGISTRY.
|
|
EQUIVALENCIA |
EQUIVALENCIA |
EQUIVALENCIA |
EQUIVALENCIA |
EQUIVALENCIA |
|
|
DEBIT |
2012 |
2011 |
2010 |
2009 |
2008 |
|
|
A) CHARGES (A.1 to A.15): |
7.283.992,00 |
5.816.094,00 |
4.931.186,00 |
4.397.000,00 |
4.101.085,00 |
|
|
A.1. Operating consumption: |
2.892.274,00 |
2.754.819,00 |
2.883.037,00 |
2.637.734,00 |
2.404.822,00 |
|
|
A.2. Staff Costs: |
1.780.873,00 |
1.247.916,00 |
983.169,00 |
742.850,00 |
702.891,00 |
|
|
a) Wages, salaries et al.: |
1.331.365,00 |
838.659,00 |
660.736,00 |
499.231,00 |
472.376,00 |
|
|
b) Social security costs: |
449.508,00 |
409.258,00 |
322.433,00 |
243.620,00 |
230.515,00 |
|
|
A.3. Depreciation expense: |
176.192,00 |
89.346,00 |
63.789,00 |
59.309,00 |
65.995,00 |
|
|
A.4. Variation of trade provisions and losses of unrecovered receivables: |
0,00 |
0,00 |
0,00 |
0,00 |
0,00 |
|
|
A.5. Other operating charges: |
2.228.072,00 |
1.574.804,00 |
970.481,00 |
931.610,00 |
913.397,00 |
|
|
A.I. OPERATING BENEFITS (B.1-A.1-A.2-A.3-A.4-A.5): |
180.805,00 |
413.483,00 |
69.381,00 |
82.645,00 |
40.495,00 |
|
|
A.6. Financial and similar charges: |
176.253,00 |
38.280,00 |
15.195,00 |
4.708,00 |
6.187,00 |
|
|
a) Due to liabilities with companies of the group: |
0,00 |
37.918,00 |
15.052,00 |
4.663,00 |
6.129,00 |
|
|
b) Due to liabilities with associated companies: |
0,00 |
0,00 |
0,00 |
0,00 |
0,00 |
|
|
c) Due to other debts: |
176.253,00 |
362,00 |
144,00 |
44,00 |
58,00 |
|
|
d) Losses from financial investments: |
0,00 |
0,00 |
0,00 |
0,00 |
0,00 |
|
|
A.7. Financial investment provision change: |
0,00 |
437,00 |
0,00 |
33,00 |
0,00 |
|
|
A.8. Exchange losses: |
15.836,00 |
6.218,00 |
2.037,00 |
3.219,00 |
0,00 |
|
|
A.II. POSITIVE FINANCIAL RESULTS (B.2+B.3-A.6-A.7-A.8): |
0,00 |
0,00 |
0,00 |
0,00 |
0,00 |
|
|
A.III. PROFIT FROM ORDINARY ACTIVITIES (A.I+A.II-B.I-B.II): |
0,00 |
370.171,00 |
54.501,00 |
78.320,00 |
39.340,00 |
|
|
A.9. Changes in provisions for intangible, tangible and securities portfolio: |
0,00 |
0,00 |
0,00 |
0,00 |
0,00 |
|
|
A.10. Losses from tangible and intangible fixed assets and portfolio: |
0,00 |
0,00 |
0,00 |
0,00 |
0,00 |
|
|
A.11. Losses from transactions with own shares and debentures: |
0,00 |
0,00 |
0,00 |
0,00 |
0,00 |
|
|
A.12. Extraordinary expenses: |
0,00 |
0,00 |
0,00 |
0,00 |
0,00 |
|
|
A.13. Prior year expenses and losses: |
0,00 |
0,00 |
0,00 |
0,00 |
0,00 |
|
|
A.IV. EXTRAORDINARY PROFIT (B.4+B.5+B.6+B.7+B.8-A.9-A.10-A.11-A.12-A.13): |
55.528,00 |
11.534,00 |
7.509,00 |
0,00 |
0,00 |
|
|
A.V. PROFIT BEFORE TAXES (A.III+A.IV-B.III-B.IV): |
45.294,00 |
381.705,00 |
62.011,00 |
78.320,00 |
39.340,00 |
|
|
A.14. Corporation Tax: |
14.492,00 |
104.273,00 |
13.477,00 |
17.537,00 |
7.792,00 |
|
|
A.15. Miscellaneous taxes: |
0,00 |
0,00 |
0,00 |
0,00 |
0,00 |
|
|
A.VI. FINANCIAL YEAR RESULT (PROFIT) (A.V-A.14-A.15): |
30.802,00 |
277.431,00 |
48.534,00 |
60.782,00 |
31.547,00 |
|
MERCANTILE REGISTRY.
|
|
EQUIVALENCIA |
EQUIVALENCIA |
EQUIVALENCIA |
EQUIVALENCIA |
EQUIVALENCIA |
|
|
CREDIT |
2012 |
2011 |
2010 |
2009 |
2008 |
|
|
B) INCOME ( B.1 to B.8): |
7.314.794,00 |
6.093.526,00 |
4.979.720,00 |
4.457.782,00 |
4.132.632,00 |
|
|
B.1. Operating income: |
7.258.216,00 |
6.080.368,00 |
4.969.858,00 |
4.454.148,00 |
4.127.600,00 |
|
|
a) Net total sales: |
7.242.679,00 |
6.061.052,00 |
4.968.853,00 |
4.449.088,00 |
4.100.035,00 |
|
|
b) Miscellaneous operating income: |
15.536,00 |
19.316,00 |
1.004,00 |
5.060,00 |
27.565,00 |
|
|
B.I. PÉRDIDAS DE EXPLOTACIÓN (A.1+A.2+A.3+A.4+A.5-B.1 ): |
0,00 |
0,00 |
0,00 |
0,00 |
0,00 |
|
|
B.2. Financial income: |
1.050,00 |
1.624,00 |
2.353,00 |
3.634,00 |
5.032,00 |
|
|
a) Companies of the group: |
0,00 |
0,00 |
0,00 |
0,00 |
0,00 |
|
|
b) In associated companies: |
0,00 |
0,00 |
0,00 |
0,00 |
0,00 |
|
|
c) Miscellaneous: |
1.050,00 |
1.624,00 |
2.353,00 |
3.634,00 |
5.032,00 |
|
|
d) Profit on financial investment: |
0,00 |
0,00 |
0,00 |
0,00 |
0,00 |
|
|
B.3. Exchange gains: |
0,00 |
0,00 |
0,00 |
0,00 |
0,00 |
|
|
B.II. NEGATIVE FINANCIAL RESULTS (A.6+A.7+A.8-B.2-B.3): |
191.038,00 |
43.312,00 |
14.880,00 |
4.325,00 |
1.155,00 |
|
|
B.III. LOSSES ON ORDINARY ACTIVITIES ( B.I + B.II - A.I - A.II ): |
10.233,00 |
0,00 |
0,00 |
0,00 |
0,00 |
|
|
B.4. Profit on disposal of both tangible and intangible fixed assets and securities portfolio: |
0,00 |
0,00 |
0,00 |
0,00 |
0,00 |
|
|
B.5. Profit on transactions with own shares and debentures: |
0,00 |
0,00 |
0,00 |
0,00 |
0,00 |
|
|
B.6. Capital grants transferred to profit and loss: |
0,00 |
0,00 |
0,00 |
0,00 |
0,00 |
|
|
B.7. Extraordinary income: |
55.528,00 |
11.534,00 |
7.509,00 |
0,00 |
0,00 |
|
|
B.8. Income and profit of former financial years: |
0,00 |
0,00 |
0,00 |
0,00 |
0,00 |
|
|
B.IV. NEGATIVE EXTRAORDINARY RESULTS (A.9+A.10+A.11+A.12+A.13-B.4-B.5-B.6-B.7-B.8): |
0,00 |
0,00 |
0,00 |
0,00 |
0,00 |
|
|
B.V. LOSSES BEFORE TAXES (B.III+B.IV-A.III-A.IV): |
0,00 |
0,00 |
0,00 |
0,00 |
0,00 |
|
|
B.VI. FINANCIAL YEAR RESULTS (LOSSES) (B.V+A.14+A.15): |
0,00 |
0,00 |
0,00 |
0,00 |
0,00 |
|
MERCANTILE REGISTRY.
|
|
|
|
|
|
Model: Normal
> Source of information: Data contained in this section is taken from the information declared in the Annual Accounts submitted to the Trade Register.
|
|
2012 |
2011 |
2010 |
2009 |
2008 |
|
|
1. Fiscal year result before taxes.: 61100 |
45.294,00 |
381.705,00 |
62.011,00 |
78.320,00 |
39.340,00 |
|
|
2. Results adjustments.: 61200 |
332.062,00 |
143.953,00 |
76.632,00 |
60.383,00 |
67.150,00 |
|
|
a) Fixed Assets Amortization (+).: 61201 |
176.192,00 |
89.346,00 |
63.789,00 |
59.309,00 |
65.995,00 |
|
|
b) Obsolescence Allowances (+/-). : 61202 |
-25.514,00 |
0,00 |
0,00 |
0,00 |
0,00 |
|
|
c) Variation in Provision (+/-). : 61203 |
-17.950,00 |
17.950,00 |
0,00 |
0,00 |
0,00 |
|
|
g) Financial income (-).: 61207 |
-1.050,00 |
-1.624,00 |
-2.353,00 |
-3.634,00 |
-5.032,00 |
|
|
h) Financial Expenses (+). : 61208 |
176.253,00 |
38.280,00 |
15.195,00 |
4.708,00 |
6.187,00 |
|
|
i) Exchange differences (+/-). : 61209 |
15.836,00 |
0,00 |
0,00 |
0,00 |
0,00 |
|
|
k) Other income and expense (-/+). : 61211 |
8.296,00 |
0,00 |
0,00 |
0,00 |
0,00 |
|
|
3. Changes in current capital equity.: 61300 |
136.648,00 |
-676.154,00 |
-324.758,00 |
-514.089,00 |
-381.792,00 |
|
|
a) Stock (+/-).: 61301 |
-279.664,00 |
-431.314,00 |
-515.376,00 |
-97.905,00 |
-376.415,00 |
|
|
d) Debtors and other accounts receivable (+/-). : 61302 |
-65.993,00 |
46.540,00 |
269.452,00 |
-327.801,00 |
-62.645,00 |
|
|
c) Other current assets (+/-). : 61303 |
-214.415,00 |
41.260,00 |
-37.737,00 |
63.928,00 |
-77.755,00 |
|
|
d) Creditors and other accounts payable (+/-). : 61304 |
696.721,00 |
-332.640,00 |
-41.098,00 |
-152.310,00 |
135.022,00 |
|
|
4. Other cash flows for operating activities.: 61400 |
-285.560,00 |
-36.656,00 |
-12.842,00 |
-1.074,00 |
-1.155,00 |
|
|
a) Interest payments (-). : 61401 |
-176.253,00 |
-38.280,00 |
-15.195,00 |
-4.708,00 |
-6.187,00 |
|
|
c) Interest collection (+). : 61403 |
1.050,00 |
1.624,00 |
2.353,00 |
3.634,00 |
5.032,00 |
|
|
d) Income tax payment collection (payments) (+/-).: 61404 |
-110.358,00 |
0,00 |
0,00 |
0,00 |
0,00 |
|
|
5. Operating activity cash flows (1 + 2 + 3 + 4) : 61500 |
228.444,00 |
-187.153,00 |
-198.958,00 |
-376.461,00 |
-276.457,00 |
|
|
6. Payments for investment (-).: 62100 |
-1.387.882,00 |
-493.642,00 |
-107.670,00 |
0,00 |
0,00 |
|
|
b) Intangible fixed assets. : 62102 |
-374.025,00 |
-234.149,00 |
0,00 |
0,00 |
0,00 |
|
|
c) Fixed assets. : 62103 |
-725.733,00 |
-181.277,00 |
-102.333,00 |
0,00 |
0,00 |
|
|
e) Other financial assets. : 62105 |
-288.124,00 |
-78.217,00 |
-5.337,00 |
0,00 |
0,00 |
|
|
7. Divestment payment collection (+). : 62200 |
0,00 |
0,00 |
2.745,00 |
48.617,00 |
67.819,00 |
|
|
b) Intangible fixed assets. : 62202 |
0,00 |
0,00 |
2.745,00 |
2.916,00 |
28.229,00 |
|
|
c) Fixed assets. : 62203 |
0,00 |
0,00 |
0,00 |
45.701,00 |
39.591,00 |
|
|
8. Investment activity cash flows (6 + 7) minus Amortization: 62300 |
-1.387.882,00 |
-582.989,00 |
-168.715,00 |
-10.692,00 |
1.824,00 |
|
|
9. Payment collection and payments for equity instruments. : 63100 |
621.905,00 |
-11.917,00 |
0,00 |
0,00 |
-40.850,00 |
|
|
a) Issuance of equity instruments (+). : 63101 |
621.905,00 |
0,00 |
0,00 |
0,00 |
0,00 |
|
|
b) Amortization of assets instruments (-). : 63102 |
0,00 |
-11.917,00 |
0,00 |
0,00 |
-40.850,00 |
|
|
10. Payment collection and payments for financial liabilities instruments.: 63200 |
880.888,00 |
680.324,00 |
456.640,00 |
340.515,00 |
230.318,00 |
|
|
a) Issuance : 63201 |
5.532.454,00 |
689.847,00 |
572.075,00 |
358.209,00 |
230.318,00 |
|
|
2. Debts incurred with credit institutions (+). : 63203 |
4.517.958,00 |
618.824,00 |
572.075,00 |
358.209,00 |
34.268,00 |
|
|
3. Debts incurred with companies of the group and affiliates (+).: 63204 |
0,00 |
0,00 |
0,00 |
0,00 |
136.396,00 |
|
|
5. Other debts (+). : 63206 |
1.014.496,00 |
71.023,00 |
0,00 |
0,00 |
59.654,00 |
|
|
b) Repayment and amortization of : 63207 |
-4.651.566,00 |
-9.523,00 |
-115.436,00 |
-17.694,00 |
0,00 |
|
|
2. Debts incurred with credit institutions (-).: 63209 |
-3.333.756,00 |
0,00 |
0,00 |
0,00 |
0,00 |
|
|
3. Debts incurred with companies of the group and affiliates (-). : 63210 |
0,00 |
-9.523,00 |
-109.437,00 |
0,00 |
0,00 |
|
|
5. Other debts (-). : 63212 |
-1.317.810,00 |
0,00 |
-5.999,00 |
-17.694,00 |
0,00 |
|
|
11. Payments from dividends and remunerations from other assets instruments. : 63300 |
0,00 |
0,00 |
0,00 |
0,00 |
0,00 |
|
|
12. Cash flows for financing activities (9+10+11).: 63400 |
1.502.794,00 |
668.407,00 |
456.640,00 |
340.515,00 |
189.468,00 |
|
|
D) EFECTO DE LAS VARIACIONES DE LOS TIPOS DE CAMBIO: 64000 |
0,00 |
0,00 |
0,00 |
0,00 |
0,00 |
|
|
E) NET INCREASE/DECREASE OF CASH OR EQUIVALENT ASSETS (+/-5+/-8+/12+/-D) : 65000 |
343.355,00 |
-101.734,00 |
88.966,00 |
-46.638,00 |
-85.165,00 |
|
|
Cash or equivalent assets as of beginning of the fiscal year.: 65100 |
86.889,00 |
188.623,00 |
99.657,00 |
146.295,00 |
231.460,00 |
|
|
Cash or equivalent assets as of end of the fiscal year.: 65200 |
430.244,00 |
86.889,00 |
188.623,00 |
99.657,00 |
146.295,00 |
|
FINANCIAL
DIAGNOSIS
|
> Economic-Financial Comparative Analysis
Data used in the following ratios and indicators is taken from the Annual Accounts submitted by the company to the TRADE REGISTER.
> Comparison within the Sector
|
Cash Flow |
2012 |
2011 |
Variación 2012 - 2011 |
|
|||
|
|
Empresa |
Sector |
Empresa |
Sector |
Empresa |
Sector |
|
|
Cash Flow over Sales: |
0,05 % |
0,01 % |
-0,02 % |
0,14 % |
382,44 % |
-93,61 % |
|
|
EBITDA over Sales: |
4,93 % |
9,28 % |
8,30 % |
5,98 % |
-40,59 % |
55,25 % |
|
|
Cash Flow Yield: |
0,06 % |
0,00 % |
-0,03 % |
0,03 % |
318,13 % |
-86,81 % |
|
|
Profitability |
2012 |
2011 |
Variación 2012 - 2011 |
|
|||
|
|
Empresa |
Sector |
Empresa |
Sector |
Empresa |
Sector |
|
|
Operating economic profitability: |
3,29 % |
5,33 % |
11,36 % |
0,35 % |
-71,02 % |
1.429,05 % |
|
|
Total economic profitability: |
3,75 % |
2,51 % |
10,99 % |
-0,19 % |
-65,91 % |
1.434,37 % |
|
|
Financial profitability: |
1,55 % |
1,37 % |
20,93 % |
-3,85 % |
-92,59 % |
135,54 % |
|
|
Margin: |
2,49 % |
4,88 % |
6,80 % |
0,70 % |
-63,37 % |
592,62 % |
|
|
Mark-up: |
-0,14 % |
1,59 % |
6,09 % |
-6,92 % |
-102,32 % |
123,05 % |
|
|
Solvency |
2012 |
2011 |
Variación 2012 - 2011 |
|
|||
|
|
Empresa |
Sector |
Empresa |
Sector |
Empresa |
Sector |
|
|
Liquidity: |
0,18 |
0,12 |
0,04 |
0,13 |
383,45 |
-10,54 |
|
|
Acid Test: |
0,29 |
0,87 |
0,13 |
0,84 |
124,71 |
2,97 |
|
|
Working Capital / Investment: |
0,26 |
0,03 |
0,18 |
0,11 |
44,94 |
-71,24 |
|
|
Solvency: |
1,64 |
1,19 |
1,30 |
1,50 |
26,25 |
-20,43 |
|
|
Indebtedness |
2012 |
2011 |
Variación 2012 - 2011 |
|
|||
|
|
Empresa |
Sector |
Empresa |
Sector |
Empresa |
Sector |
|
|
Indebtedness level: |
1,98 |
1,63 |
1,87 |
1,32 |
5,72 |
24,08 |
|
|
Borrowing Composition: |
0,66 |
1,04 |
0,07 |
1,24 |
785,06 |
-16,02 |
|
|
Repayment Ability: |
11,43 |
138,26 |
-24,36 |
16,79 |
146,94 |
723,33 |
|
|
Warranty: |
1,51 |
1,62 |
1,54 |
1,76 |
-2,35 |
-7,92 |
|
|
Generated resources / Total creditors: |
0,05 |
0,07 |
0,15 |
0,01 |
-64,38 |
433,17 |
|
|
Efficiency |
2012 |
2011 |
Variación 2012 - 2011 |
|
|||
|
|
Empresa |
Sector |
Empresa |
Sector |
Empresa |
Sector |
|
|
Productivity: |
1,20 |
1,73 |
1,40 |
1,27 |
-14,43 |
36,04 |
|
|
Turnover of Collection Rights : |
28,89 |
4,84 |
38,07 |
3,45 |
-24,11 |
40,57 |
|
|
Turnover of Payment Entitlements: |
6,75 |
3,53 |
30,55 |
2,24 |
-77,90 |
57,70 |
|
|
Stock rotation: |
2,37 |
6,67 |
2,10 |
1,72 |
13,19 |
287,65 |
|
|
Assets turnover: |
1,32 |
1,09 |
1,67 |
0,49 |
-20,88 |
120,76 |
|
|
Borrowing Cost: |
4,49 |
2,96 |
1,54 |
2,81 |
190,61 |
5,21 |
|
> Trend of indicators under the General Accounting Plan of 2007 (2012, 2011, 2010, 2009, 2008)
|
Cash Flow |
2012 |
2011 |
2010 |
2009 |
2008 |
|
|
Cash Flow over Sales: |
0,05 % |
-0,02 % |
0,02 % |
-0,01 % |
-2,01 % |
|
|
EBITDA over Sales: |
4,93 % |
8,30 % |
2,68 % |
3,19 % |
2,60 % |
|
|
Cash Flow Yield: |
0,06 % |
-0,03 % |
0,03 % |
-0,02 % |
-3,51 % |
|
|
Profitability |
2012 |
2011 |
2010 |
2009 |
2008 |
|
|
Operating economic profitability: |
3,29 % |
11,36 % |
2,33 % |
3,30 % |
1,81 % |
|
|
Total economic profitability: |
3,75 % |
10,99 % |
2,50 % |
3,18 % |
1,94 % |
|
|
Financial profitability: |
1,55 % |
20,93 % |
4,58 % |
6,01 % |
3,32 % |
|
|
Margin: |
2,49 % |
6,80 % |
1,40 % |
1,86 % |
0,98 % |
|
|
Mark-up: |
-0,14 % |
6,09 % |
1,10 % |
1,76 % |
-0,03 % |
|
|
Solvency |
2012 |
2011 |
2010 |
2009 |
2008 |
|
|
Liquidity: |
0,18 |
0,04 |
0,10 |
0,06 |
0,11 |
|
|
Acid Test: |
0,29 |
0,13 |
0,23 |
0,39 |
0,25 |
|
|
Working Capital / Investment: |
0,26 |
0,18 |
0,27 |
0,30 |
0,29 |
|
|
Solvency: |
1,64 |
1,30 |
1,43 |
1,49 |
1,49 |
|
|
Indebtedness |
2012 |
2011 |
2010 |
2009 |
2008 |
|
|
Indebtedness level: |
1,98 |
1,87 |
1,91 |
1,58 |
1,46 |
|
|
Borrowing Composition: |
0,66 |
0,07 |
0,05 |
0,00 |
0,00 |
|
|
Repayment Ability: |
11,43 |
-24,36 |
22,77 |
-34,24 |
3,66 |
|
|
Warranty: |
1,51 |
1,54 |
1,52 |
1,63 |
1,68 |
|
|
Generated resources / Total creditors: |
0,05 |
0,15 |
0,06 |
0,08 |
0,07 |
|
|
Efficiency |
2012 |
2011 |
2010 |
2009 |
2008 |
|
|
Productivity: |
1,20 |
1,40 |
1,14 |
1,19 |
1,15 |
|
|
Turnover of Collection Rights : |
28,89 |
38,07 |
24,10 |
9,36 |
27,91 |
|
|
Turnover of Payment Entitlements: |
6,75 |
30,55 |
10,41 |
9,23 |
6,23 |
|
|
Stock rotation: |
2,37 |
2,10 |
2,16 |
2,49 |
2,46 |
|
|
Assets turnover: |
1,32 |
1,67 |
1,67 |
1,78 |
1,85 |
|
|
Borrowing Cost: |
4,49 |
1,54 |
0,75 |
0,29 |
0,44 |
|
COMPARATIVE
SECTORIAL BALANCE
|
Sector-based Comparison under the rules of the New General Accounting Plan.
|
|
Variación - |
|
|
|
Empresa |
Sector |
|
|
Variación - |
|
|
|
Empresa |
Sector |
|
|
Variación - |
|
|
|
Empresa |
Sector |
Public
Tenders and Works Won
|
No Public Tenders assigned to the name of the company.
Research
Summary
|
|
The mercantile entity ORELLANA UNO SL with VAT number B81055410 was founded in Madrid by an undefined period of time in December, 1994 and it is engaged in design, elaboration and retail sale of clothes. It recently showed some instability. We advise to control its commercial evolution. |
Sources
|
|
Registry of Commerce''s Official Gazette. Own and external data bases Company References Investigacion |
FOREIGN EXCHANGE RATES
|
Currency |
Unit
|
Indian Rupees |
|
US Dollar |
1 |
Rs.60.21 |
|
|
1 |
Rs.101.05 |
|
Euro |
1 |
Rs.83.33 |
INFORMATION DETAILS
|
Analysis Done by
: |
SUB |
|
|
|
|
Report Prepared
by : |
NIS |
RATING EXPLANATIONS
|
RATING |
STATUS |
PROPOSED CREDIT LINE |
|
|
|
>86 |
Aaa |
Possesses an extremely sound financial base with the strongest
capability for timely payment of interest and principal sums |
Unlimited |
|
|
71-85 |
Aa |
Possesses adequate working capital. No caution needed for credit
transaction. It has above average (strong) capability for payment of interest
and principal sums |
Large |
|
|
56-70 |
A |
Financial & operational base are regarded healthy. General unfavourable
factors will not cause fatal effect. Satisfactory capability for payment of
interest and principal sums |
Fairly Large |
|
|
41-55 |
Ba |
Overall operation is considered normal. Capable to meet normal
commitments. |
Satisfactory |
|
|
26-40 |
B |
Capability to overcome financial difficulties seems comparatively
below average. |
Small |
|
|
11-25 |
Ca |
Adverse factors
are apparent. Repayment of interest and principal sums in default or expected
to be in default upon maturity |
Limited with full security |
|
|
<10 |
C |
Absolute credit risk exists. Caution needed to be exercised |
Credit not
recommended |
|
|
-- |
NB |
New Business |
-- |
|
This score serves as a reference to assess SC’s
credit risk and to set the amount of credit to be extended. It is calculated
from a composite of weighted scores obtained from each of the major sections of
this report. The assessed factors and their relative weights (as indicated
through %) are as follows:
Financial
condition (40%) Ownership
background (20%) Payment
record (10%)
Credit history
(10%) Market trend (10%) Operational size
(10%)
This report is issued at your request without any
risk and responsibility on the part of MIRA INFORM PRIVATE LIMITED (MIPL) or
its officials.