MIRA INFORM REPORT
|
Report Date : |
15.04.2014 |
IDENTIFICATION DETAILS
|
Name : |
TATA CHEMICALS LIMITED |
|
|
|
|
Registered Office
: |
Bombay House, 24, Homi Modi Street, Fort, Mumbai – 400001, Maharashtra
|
|
|
|
|
Country : |
India |
|
|
|
|
Financials (as
on) : |
31.03.2013 |
|
|
|
|
Date of
Incorporation : |
23.01.1939 |
|
|
|
|
Com. Reg. No.: |
11-002893 |
|
|
|
|
Capital
Investment / Paid-up Capital : |
Rs.2548.200 Millions |
|
|
|
|
CIN No.: [Company Identification
No.] |
L24239MH1939PLC002893 |
|
|
|
|
TAN No.: [Tax Deduction &
Collection Account No.] |
MUMT00053E MRTT00425F |
|
|
|
|
Legal Form : |
A Public Limited Liability Company. The Company’s Shares are Listed on
the Stock Exchanges. |
|
|
|
|
Line of Business
: |
Manufacturer of Inorganic
Chemicals and Fertilizers. |
|
|
|
|
No. of Employees
: |
Information Decline by the management |
RATING & COMMENTS
|
MIRA’s Rating : |
Aa (72) |
|
RATING |
STATUS |
PROPOSED CREDIT LINE |
|
|
71-85 |
Aa |
Possesses adequate working capital. No caution needed for credit
transaction. It has above average (strong) capability for payment of interest
and principal sums |
Large |
|
Maximum Credit Limit : |
USD 212200000 |
|
|
|
|
Status : |
Good |
|
|
|
|
Payment Behaviour : |
Regular |
|
|
|
|
Litigation : |
Exist |
|
|
|
|
Comments : |
Subject is a part of “TATA
GROUP COMPANY”. It is a well-established company having fine track record. The rating reflects
strong financial risk profile supported by dominant position in the global
soda ash industry, diversified revenue streams resulting from a varied
product portfolio and strong liquidity position. Trade relations are
reported as fair. Business is active. Payments are reported to be regular and
as per commitments. The company can be
considered good for normal business dealings at usual trade terms and conditions.
|
NOTES :
Any query related to this report can be made
on e-mail : infodept@mirainform.com
while quoting report number, name and date.
ECGC Country Risk Classification List – March 31, 2014
|
Country Name |
Previous Rating (31.12.2013) |
Current Rating (31.03.2014) |
|
India |
A1 |
A1 |
|
Risk Category |
ECGC
Classification |
|
Insignificant |
A1 |
|
Low |
A2 |
|
Moderate |
B1 |
|
High |
B2 |
|
Very High |
C1 |
|
Restricted |
C2 |
|
Off-credit |
D |
INDIAN ECONOMIC OVERVIEW
US investment bank
Goldman Sachs has upgraded its outlook on Indian markets as it expects
positive impact of the election cycle.
India’s economy may
grow 4.7 % in the current financial year, lower than the official estimate of
4.9 %, Fitch Rating said. The global rating agency expects the economy to pick
up in the next two financial years.
Global ratings
agency Standard & Poor said increasing focus by India Inc on lowering debt
is likely to improve their credit profiles.
Singapore (1.1
million Indian tourists in 2012), Thailand (one million), the United Arab
Emirates ().98 million) and Malaysia ().82 million) emerged as the preferred
holidays hotspots for Indians. The total figure is expected to increase to 1.93
million by 2017, according to the latest Eurmonitor international report.
There is a $29.34 bn
outward foreign direct investment by domestic companies between April and
January of 2013/14 which has seen some signs of recovery according to a Care
Ratings report.
There are 264 number
of new companies being set up every day on average during 2014. Most of them
are registered in Mumbai. India had 1.38 million registered companies at the
end of January, 2014.
Twitter like
messaging service Weibo Corporation has filed to raise $ 500 million via a US
initial public offering. Alibaba, which owns a stake in Weibo is expected to
raise about $ 15 billion New York this year in the highest profile Internet IPO
since Facebook’s in 2012.
Bharti Airtel has
raised Rs.2,453.2 crore (350 million Swiss Francs) by selling six-year bonds at
a coupon rate of three per cent and maturing in 2020. This is the largest ever
bond offering by an Indian company in Swiss Francs. Bharat Petroleum
Corporation raised 175 million Swiss Francs by selling five year bonds at 2.98
% coupon rate in February.
Indian Oil
Corporation plans to invest Rs 7650 crore in setting up a petrochemical complex
at its almost complete Paradip refinery in Odhisha in three to four years. The
company board is set to consider the setting up of a 700000 tonne per annum
polypropylene plant at an estimated cost at Rs.3150 crore.
Global chief
information officers at gathering in Bangalore in April to meet Indian startups
at an event called Tech50 Watchout for Little Eye Labs-Facebook type deals in
the making.
EXTERNAL AGENCY RATING
|
Rating Agency Name |
CARE |
|
Rating |
Long term bank facilities: “AA+” |
|
Rating Explanation |
High degree of safety and low credit risk. |
|
Date |
14.01.2014 |
|
Rating Agency Name |
CARE |
|
Rating |
Short term bank facilities: “A1+” |
|
Rating Explanation |
Very strong degree of safety and lowest
credit risk. |
|
Date |
14.01.2014 |
RBI DEFAULTERS’ LIST STATUS
Subject’s name is not enlisted as a defaulter in
the publicly available RBI Defaulters’ list.
EPF (Employee Provident Fund) DEFAULTERS’ LIST STATUS
Subject’s name is not enlisted as a defaulter
in the publicly available EPF (Employee Provident Fund) Defaulters’ list as of
31-03-2012.
INFORMATION DECLINED
Management Non Co-operative (91-22-22049131)
LOCATIONS
|
Registered/ Corporate
Office : |
Bombay House, 24, Homi Modi Street, Fort, Mumbai – 400001,
Maharashtra, India |
|
Tel. No.: |
91-22-22049131/ 1529 / 4359/ 22867407/ 66658282 |
|
Fax No.: |
91-22-22042947/ 5359 / 66658143 / 44 |
|
E-Mail : |
|
|
Website : |
|
|
|
|
|
Chemicals Division
: |
Mithapur - 361345, Okhamandal, Gujarat, India |
|
Tel. No.: |
91-2892-665 991 / 665 992 |
|
Fax No.: |
91-2892-223 471 |
|
|
|
|
Fertiliser Division
: |
Indira Dham, P.O. Box No.1, Babrala - 202 521, District Budaun, |
|
Tel. No.: |
91-5836-664990 / 664777/ 664888 / 664999 |
|
Fax No.: |
91-5836-664218 |
|
|
|
|
Haldia Works : |
P.O. Durgachak, Haldia, District Purba, East Midnapore - 721602, West
Bengal, India |
|
Tel. No.: |
91-3224-251001 |
|
Fax No.: |
91-3224-252220 / 252223 |
|
|
|
|
Overseas Office : |
Located at:
|
DIRECTORS
As on: 31.03.2013
|
Name : |
Mr. Ratan N. Tata |
|
Designation : |
Chairman |
|
Date of Birth/Age : |
28.12.1937 |
|
Qualification : |
B.Sc.,
(Architecture) from |
|
Date of Appointment : |
11.04.1983 |
|
|
|
|
Name : |
Mr. Cyrus P. Mistry |
|
Designation : |
Chairman |
|
Date of Birth/Age : |
04.07.1968 |
|
Date of Appointment : |
28.12.2012 |
|
Qualification : |
B.E. (Civil) - Imperial College, UK, M.Sc. (Management - London Business School |
|
|
|
|
Name : |
Mr. R. Gopalakrishnan |
|
Designation : |
Vice-Chairman |
|
Date of Birth/Age : |
25.12.1945 |
|
Qualification : |
B.Sc., (Hons), B.Tech (Hons) in Electronic from IIT Khargpur |
|
Date of Appointment : |
30.10.1998 |
|
|
|
|
Name : |
Mr. Nusil N. Wadia |
|
Designation : |
Director |
|
Date of Birth/Age : |
15.02.1944 |
|
Qualification : |
Educated in |
|
Date of Appointment : |
26.06.1981 |
|
|
|
|
Name : |
Mr. Prasad R. Menon |
|
Designation : |
Managing Director |
|
Qualification : |
B.E. (Chem) IIT Kharagpur |
|
Date of Birth/Age : |
23.01.1946 |
|
Date of Appointment : |
30.10.2006 |
|
Expertise in
specific functional areas : |
Wide experience in Chemicals, Agro- Chemicals, Paints and Fertiliser Industry |
|
|
|
|
Name : |
Mr. Nasser Munjee |
|
Designation : |
Director |
|
Date of Birth/ Age : |
18.11.1952 |
|
Qualification : |
Masters in Economics from London School of Economics, UK |
|
Date of Appointment : |
25.09.2006 |
|
Expertise in
specific functional areas : |
Eminent Economist, Banker and Consultant on infrastructure |
|
|
|
|
Name : |
Dr. Yoginder K. Alagh |
|
Designation : |
Director |
|
Date of Birth/ Age : |
14.02.1939 |
|
Qualification : |
Ph. D in Economics |
|
Date of Appointment : |
25.09.2006 |
|
|
|
|
Name : |
Mr. Eknath A. Kshirsagar |
|
Designation : |
Director |
|
Date of Birth/Age : |
11.09.1941 |
|
Date of Appointment : |
26.11.2008 |
|
Qualification : |
Fellow Member of the Institute of Chartered Accountants in England and Wales |
|
|
|
|
Name : |
Dr. Y.S.P. Thorat |
|
Designation : |
Director |
|
Date of Birth/Age : |
11.11.1947 |
|
Qualification : |
Ph. D-Shivaji University, Degree in Political Science, Degree in Law |
|
Date of Appointment : |
08.01.2010 |
|
Expertise in
specific functional areas : |
Wide experience in banking, rural credit co-operatives, micro finance |
|
|
|
|
Name : |
Mr. Vijay Kelkar |
|
Designation : |
Director |
|
Date of Birth/Age : |
15.05.1942 |
|
Date of Appointment : |
30.05.2012 |
|
Qualification : |
Ph. D from University of California |
|
|
|
|
Name : |
Mr. R. Mukundan |
|
Designation : |
Managing Director |
|
|
|
|
Name : |
Mr. P.K. Ghose |
|
Designation : |
Executive Director and Chief Finance Officer |
KEY EXECUTIVES
|
Name : |
Mr. Rajiv Chandan |
|
Designation : |
Company Secretary and General Counsel |
|
|
|
|
CORPORATE |
|
|
|
|
|
|
|
|
INDIA OPERATIONS |
|
|
|
|
|
|
|
|
INTERNATIONAL OPERATIONS |
|
|
|
|
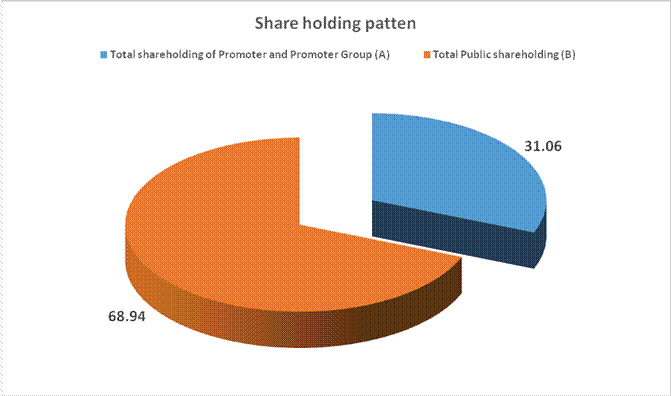
MAJOR SHAREHOLDERS / SHAREHOLDING PATTERN
As on: 31.12.2013
|
Category of Shareholder |
No. of Shares |
Percentage of Holding |
|
(A) Shareholding of
Promoter and Promoter Group |
|
|
|
|
|
|
|
|
78751692 |
30.91 |
|
|
374165 |
0.15 |
|
|
374165 |
0.15 |
|
|
79125857 |
31.06 |
|
|
|
|
|
Total shareholding
of Promoter and Promoter Group (A) |
79125857 |
31.06 |
|
(B) Public
Shareholding |
|
|
|
|
|
|
|
|
11474679 |
4.50 |
|
|
796140 |
0.31 |
|
|
73598 |
0.03 |
|
|
43806751 |
17.20 |
|
|
56651730 |
22.24 |
|
|
385128 |
0.15 |
|
|
384572 |
0.15 |
|
|
556 |
0.00 |
|
|
113188026 |
44.43 |
|
|
|
|
|
|
7372939 |
2.89 |
|
|
|
|
|
|
48438611 |
19.01 |
|
|
5728664 |
2.25 |
|
|
902181 |
0.35 |
|
|
902181 |
0.35 |
|
|
62442395 |
24.51 |
|
Total Public
shareholding (B) |
175630421 |
68.94 |
|
Total (A)+(B) |
254756278 |
100.00 |
|
(C) Shares held by Custodians
and against which Depository Receipts have been issued |
0 |
0.00 |
|
|
0 |
0.00 |
|
|
0 |
0.00 |
|
|
0 |
0.00 |
|
Total (A)+(B)+(C) |
254756278 |
0.00 |
BUSINESS DETAILS
|
Line of Business : |
Manufacturer of Inorganic
Chemicals and Fertilizers. |
PRODUCTION STATUS (As on 31.03.2011)
|
Particulars |
Licensed
Capacity (Tonnes
) |
Installed
Capacity (Tonnes
$) |
|
Soda Ash |
1000000 |
917700 |
|
Sodium Bicarbonate |
75600 |
100000 |
|
Caustic Soda |
36000 |
36000 |
|
Liquid Chlorine |
31950 |
31950 |
|
Hydrochloric Acid |
N.A. |
64800 |
|
Bromine |
2520 |
2400 |
|
Hydrobomic Acid |
50 |
50 |
|
Vacuum Salt |
N.A. |
647500 |
|
Chemicals and other
Industrial Machinery |
5000 |
5000 |
|
Clinker |
N.R. |
825000 |
|
Cement |
440000 |
440000 |
|
Ammonia |
N.R. |
445500 |
|
Urea @@ |
N.R. |
742500 |
|
Sulphuric
acid # |
221500 |
221500 |
|
Phosphoric
acid # |
52700 |
52700 |
|
Sulphonic
Acid # |
N.A. |
12000 |
|
Sodium
Tripolyphosphate (STPP) # |
40000 |
50000 |
|
Diammonium
Phosphate (DAP) # |
670000 |
670000 |
|
Single
Super Phosphate (SSP) # |
165000 |
165000 |
$ As certified by the
Management and accepted by the Auditors.
# Licensed
capacity includes capacity under the Industrial Entrepreneurs Memorandum filed
with the Government and duly acknowledged by them under the scheme of
delicensing notified by the Government.
@@ After debottlenecking
expected per day production is likely to be around 3500 mtpd
N.A. Not
Applicable
N.R. Not Required
N.R. Not Required
|
Particulars |
Production/
Purchase (Tonnes)
|
|
Soda Ash |
696746 |
|
Sodium Bicarbonate |
78278 |
|
Caustic Soda |
10979 |
|
Liquid Chlorine |
2068 |
|
Hydrochloric Acid |
18188 |
|
Bromine |
1177 |
|
Vacuum Salt # |
597077 |
|
Pure Salt |
2886 |
|
Solar Salt |
-- |
|
Gypsum |
143819 |
|
Cement |
418866 |
|
Clinker |
385178 |
|
Ammonia |
636305 |
|
Urea ** |
1117153 |
|
Sodium Tripoly phosphate (STPP) |
10575 |
|
Diammonium Phosphate (DAP) |
208464 |
|
NPK ** |
361419 |
|
Single Super Phosphate ** |
140496 |
|
Sulphuric Acid |
176423 |
|
Phosphoric Acid |
11388 |
|
Others |
-- |
# Sales of Vacuum Salt
includes free issues under sales promotion schemes.
** Production figures include Bulk Production
GENERAL INFORMATION
|
No. of Employees : |
Information Decline by the management |
||||||||||||||||||||||||||||||
|
|
|
||||||||||||||||||||||||||||||
|
Bankers : |
|
||||||||||||||||||||||||||||||
|
|
|
||||||||||||||||||||||||||||||
|
Facilities : |
(Rs.
In Millions)
|
||||||||||||||||||||||||||||||
|
|
|
|
Banking
Relations : |
-- |
|
|
|
|
Auditors : |
|
|
Name : |
Deloitte Haskins and Sells Chartered Accountants |
|
|
|
|
Solicitors : |
|
|
|
|
|
Associate : |
EPM Mining Venture Inc, Canada |
|
|
|
|
Joint Ventures : |
Direct
Indirect
|
|
|
|
|
Subsidiaries : |
Direct
Indirect
|
CAPITAL STRUCTURE
As on: 31.03.2013
Authorised Capital :
|
No. of Shares |
Type |
Value |
Amount |
|
|
|
|
|
|
270000000 |
Equity Shares |
Rs.10/- each |
Rs.2700.000 Millions |
|
|
|
|
|
Issued Capital :
|
No. of Shares |
Type |
Value |
Amount |
|
|
|
|
|
|
254842598 |
Equity Shares |
Rs.10/- each |
Rs.2548.400 Millions |
|
|
|
|
|
Subscribed & Paid-up Capital :
|
No. of Shares |
Type |
Value |
Amount |
|
|
|
|
|
|
254756278 |
Equity Shares |
Rs.10/- each |
Rs.2547.600 Millions |
|
86320 |
Forfeited Shares |
|
Rs.0.600
Million |
|
|
|
|
|
|
|
Total |
|
Rs.2548.200 Millions |
Notes:
(a) Reconciliation of the number of shares and amount outstanding at the beginning and at the end of the reporting period:
|
Issued share
capital: |
Number of shares |
Rs. In Millions |
|
Ordinary shares: |
|
|
|
At the beginning of the year |
254842598 |
2548.400 |
|
Outstanding at the end of the year |
254842598 |
2548.400 |
|
Subscribed and paid up: Ordinary shares: |
|
|
|
At the beginning of the year |
254756278 |
2547.600 |
|
Outstanding at the end of the year |
254756278 |
2547.600 |
(b) The equity shares of the Company have voting rights and are subject to the preferential rights as prescribed under law or those of the preference shareholders, if any. The equity shares are also subject to restrictions as prescribed under the Companies Act, 1956.
(c) Details of shares held by each shareholder more than 5 % of shares:
|
Ordinary shares
with voting rights |
Number of shares |
% |
|
(i) Tata Sons Limited |
49306423 |
19.35 |
|
(ii) Tata Investment Corporation Limited |
15753501 |
6.18 |
|
(iii) Life Insurance Corporation of India |
15676405 |
6.15 |
(d) Aggregate number and class of shares allotted as fully paid up pursuant to contract(s) without payment being received in cash, bonus shares and pursuant to schemes of amalgamation #
|
|
Number of shares |
|
Ordinary shares with voting rights |
|
|
(i) Scheme of amalgamation |
|
|
Hind Lever Chemicals Limited |
34464000 |
|
Tata Fertilisers Limited |
4249864 |
|
(ii) Contract without payment being received in cash |
37000 |
|
(iii) Bonus Shares by way of capitalisation of Securities premium account |
92970000 |
|
General reserve |
12432144 |
# No such shares have been issued during the previous five years.
FINANCIAL DATA
[all figures are
in Rupees Millions]
ABRIDGED BALANCE
SHEET
|
SOURCES OF FUNDS |
31.03.2013 |
31.03.2012 |
31.03.2011 |
|
EQUITY AND LIABILITIES |
|
|
|
|
(1)Shareholders' Funds |
|
|
|
|
(a) Share Capital |
2548.200 |
2548.200 |
2548.200 |
|
(b) Reserves & Surplus |
50525.000 |
46806.900 |
44858.600 |
|
(c) Money received against share warrants |
0.000 |
0.000 |
0.000 |
|
|
|
|
|
|
(2) Share Application money pending allotment |
0.000 |
0.000 |
0.000 |
|
Total Shareholders’
Funds (1) + (2) |
53073.200 |
49355.100 |
47406.800 |
|
|
|
|
|
|
(3) Non-Current
Liabilities |
|
|
|
|
(a) long-term borrowings |
10729.200 |
22025.700 |
25864.500 |
|
(b) Deferred tax liabilities (Net) |
1247.500 |
886.700 |
1597.100 |
|
(c) Other long term liabilities |
849.100 |
823.500 |
217.700 |
|
(d) long-term provisions |
1113.200 |
928.600 |
951.100 |
|
Total Non-current
Liabilities (3) |
13939.000 |
24664.500 |
28630.400 |
|
|
|
|
|
|
(4) Current
Liabilities |
|
|
|
|
(a) Short term borrowings |
13841.400 |
2568.600 |
1227.400 |
|
(b) Trade payables |
12170.700 |
17197.300 |
9880.400 |
|
(c) Other current liabilities |
14923.900 |
10900.800 |
4746.600 |
|
(d) Short-term provisions |
3037.300 |
3242.300 |
3063.800 |
|
Total Current
Liabilities (4) |
43973.300 |
33909.000 |
18918.200 |
|
|
|
|
|
|
TOTAL |
110985.500 |
107928.600 |
94955.400 |
|
|
|
|
|
|
ASSETS |
|
|
|
|
(1) Non-current
assets |
|
|
|
|
(a) Fixed Assets |
|
|
|
|
(i) Tangible assets |
19116.700 |
18100.300 |
15875.800 |
|
(ii) Intangible Assets |
0.000 |
0.000 |
0.000 |
|
(iii) Capital work-in-progress |
1373.000 |
2653.800 |
2995.300 |
|
(iv) Intangible assets under development |
0.000 |
0.000 |
0.000 |
|
(b) Non-current Investments |
39620.800 |
46136.200 |
49014.400 |
|
(c) Deferred tax assets (net) |
0.000 |
0.000 |
0.000 |
|
(d) Long-term Loan and Advances |
2671.500 |
1943.100 |
1892.300 |
|
(e) Other Non-current assets |
27.800 |
63.100 |
167.700 |
|
Total Non-Current
Assets |
62809.800 |
68896.500 |
69945.500 |
|
|
|
|
|
|
(2) Current assets |
|
|
|
|
(a) Current investments |
2.500 |
2.500 |
2.500 |
|
(b) Inventories |
9274.700 |
12532.200 |
6963.000 |
|
(c) Trade receivables |
24848.800 |
14904.500 |
7244.800 |
|
(d) Cash and cash equivalents |
10919.800 |
8918.500 |
7987.600 |
|
(e) Short-term loans and advances |
2931.700 |
2293.100 |
2185.900 |
|
(f) Other current assets |
198.200 |
381.300 |
626.100 |
|
Total Current
Assets |
48175.700 |
39032.100 |
25009.900 |
|
|
|
|
|
|
TOTAL |
110985.500 |
107928.600 |
94955.400 |
PROFIT & LOSS
ACCOUNT
|
|
PARTICULARS |
31.03.2013 |
31.03.2012 |
31.03.2011 |
|
|
|
SALES |
|
|
|
|
|
|
|
Income |
85298.700 |
79962.500 |
63328.600 |
|
|
|
Other Income |
3656.000 |
3085.700 |
1080.300 |
|
|
|
TOTAL (A) |
88954.700 |
83048.200 |
64408.900 |
|
|
|
|
|
|
|
|
Less |
EXPENSES |
|
|
|
|
|
|
|
Cost of Materials Consumed |
29887.900 |
28649.100 |
21988.700 |
|
|
|
Purchases of Stock-in-Trade |
14043.900 |
21676.600 |
13089.200 |
|
|
|
Changes in Inventories of Work-In-Progress Finished Goods and Stock-in-trade |
2737.800 |
(4093.600) |
(100.700) |
|
|
|
Employee Benefits Expense |
2735.600 |
2397.500 |
2073.800 |
|
|
|
Other Expenses |
25429.800 |
21095.400 |
17445.000 |
|
|
|
Expenditure Transferred to Capital Account |
0.000 |
0.000 |
(102.200) |
|
|
|
Compensation on Voluntary Retirement |
0.900 |
23.800 |
267.500 |
|
|
|
Loss on Sale/Provision for Diminution in the Value of Long-term Investments |
17.200 |
123.800 |
0.000 |
|
|
|
Impairment of Assets |
0.000 |
340.000 |
100.800 |
|
|
|
Exchange Loss (net) on Foreign Currency Long-term Borrowings including Revaluation thereof |
1672.500 |
843.400 |
0.300 |
|
|
|
TOTAL (B) |
76525.600 |
71056.000 |
54762.400 |
|
|
|
|
|
|
|
|
Less |
PROFIT
BEFORE INTEREST TAX DEPRECIATION AND AMORTISATION (A-B) (C) |
12429.100 |
11992.200 |
9646.500 |
|
|
|
|
|
|
|
|
|
Less |
FINANCIAL
EXPENSES (D) |
2032.500 |
2101.900 |
2014.900 |
|
|
|
|
|
|
|
|
|
|
PROFIT
BEFORE TAX DEPRECIATION AND AMORTISATION (C-D) (E) |
10396.600 |
9890.300 |
7631.600 |
|
|
|
|
|
|
|
|
|
Less/ Add |
DEPRECIATION/
AMORTISATION (F) |
2142.900 |
2246.800 |
2044.600 |
|
|
|
|
|
|
|
|
|
|
PROFIT BEFORE
TAX (E-F) (G) |
8253.700 |
7643.500 |
5587.000 |
|
|
|
|
|
|
|
|
|
Less |
TAX (H) |
1820.500 |
1777.500 |
1502.100 |
|
|
|
|
|
|
|
|
|
|
PROFIT AFTER TAX
(G-H) (I) |
6433.200 |
5866.000 |
4084.900 |
|
|
|
|
|
|
|
|
|
Add |
PREVIOUS
YEARS’ BALANCE BROUGHT FORWARD |
21789.900 |
19434.200 |
18693.300 |
|
|
|
|
|
|
|
|
|
Add |
Other
Adjustments |
0.000 |
4.000 |
0.000 |
|
|
|
|
|
|
|
|
|
Less |
APPROPRIATIONS |
|
|
|
|
|
|
|
Proposed Dividend |
2547.600 |
2547.600 |
2547.600 |
|
|
|
Tax on Dividend |
397.000 |
380.100 |
387.900 |
|
|
|
General Reserve |
643.300 |
586.600 |
408.500 |
|
|
BALANCE CARRIED
TO THE B/S |
24635.200 |
21789.900 |
19434.200 |
|
|
|
|
|
|
|
|
|
|
EARNINGS IN
FOREIGN CURRENCY |
|
|
|
|
|
|
|
Export of goods on F.O.B. basis |
285.700 |
560.300 |
417.300 |
|
|
|
Miscellaneous Income |
180.600 |
17.700 |
0.000 |
|
|
|
Interest |
0.000 |
0.000 |
4.700 |
|
|
|
Dividend |
0.000 |
1002.800 |
109.800 |
|
|
TOTAL EARNINGS |
466.300 |
1580.800 |
531.800 |
|
|
|
|
|
|
|
|
|
|
IMPORTS |
|
|
|
|
|
|
|
Raw materials, fuel and traded products |
28555.500 |
38014.900 |
25296.100 |
|
|
|
Stores, components and spare parts |
137.600 |
141.600 |
93.100 |
|
|
|
Capital goods |
273.100 |
874.600 |
401.100 |
|
|
TOTAL IMPORTS |
28966.200 |
39031.100 |
25790.3000 |
|
|
|
|
|
|
|
|
|
|
Earnings Per
Share (Rs.) |
25.25 |
23.03 |
16.32 |
|
KEY RATIOS
|
PARTICULARS |
|
31.03.2013 |
31.03.2012 |
31.03.2011 |
|
PAT / Total Income |
(%) |
7.23 |
7.06
|
6.34 |
|
|
|
|
|
|
|
Net Profit Margin (PBT/Sales) |
(%) |
9.68 |
9.56
|
8.82 |
|
|
|
|
|
|
|
Return on Total Assets (PBT/Total Assets} |
(%) |
11.79 |
12.92
|
13.01 |
|
|
|
|
|
|
|
Return on Investment (ROI) (PBT/Networth) |
|
0.16 |
0.15
|
0.12 |
|
|
|
|
|
|
|
Debt Equity Ratio (Total Debt/Networth) |
|
0.46 |
0.49
|
0.57 |
|
|
|
|
|
|
|
Current Ratio (Current Asset/Current Liability) |
|
1.10 |
1.15
|
1.32 |
FINANCIAL ANALYSIS
[all figures are
in Rupees Millions]
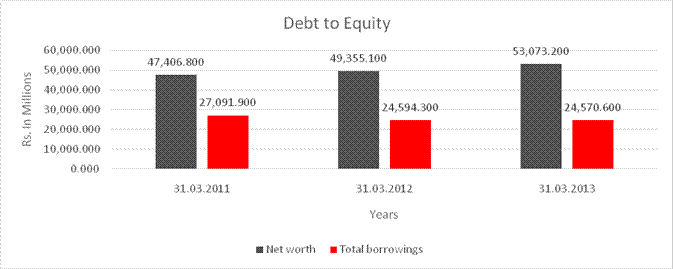
DEBT EQUITY RATIO
|
Particular |
31.03.2011 |
31.03.2012 |
31.03.2013 |
|
|
(Rs.
In Millions) |
(Rs.
In Millions) |
(Rs.
In Millions) |
|
Share Capital |
2,548.200 |
2,548.200 |
2,548.200 |
|
Reserves & Surplus |
44,858.600 |
46,806.900 |
50,525.000 |
|
Net
worth |
47,406.800 |
49,355.100 |
53,073.200 |
|
|
|
|
|
|
long-term borrowings |
25,864.500 |
22,025.700 |
10,729.200 |
|
Short term borrowings |
1,227.400 |
2,568.600 |
13,841.400 |
|
Total
borrowings |
27,091.900 |
24,594.300 |
24,570.600 |
|
Debt/Equity
ratio |
0.571 |
0.498 |
0.463 |
YEAR-ON-YEAR GROWTH
|
Year
on Year Growth |
31.03.2011 |
31.03.2012 |
31.03.2013 |
|
|
(Rs.
In Millions) |
(Rs.
In Millions) |
(Rs.
In Millions) |
|
Sales |
63,328.600 |
79,962.500 |
85,298.700 |
|
|
|
26.266 |
6.673 |
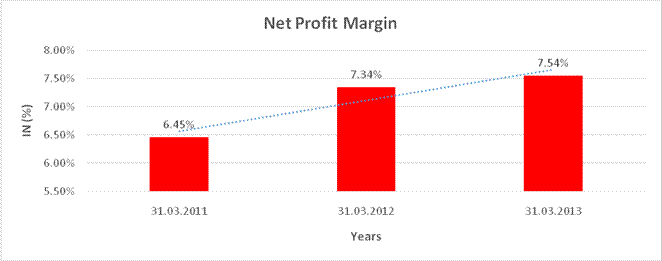
NET PROFIT MARGIN
|
Net
Profit Margin |
31.03.2011 |
31.03.2012 |
31.03.2013 |
|
|
(Rs.
In Millions) |
(Rs.
In Millions) |
(Rs.
In Millions) |
|
Sales |
63,328.600 |
79,962.500 |
85,298.700 |
|
Profit |
4,084.900 |
5,866.000 |
6,433.200 |
|
|
6.45% |
7.34% |
7.54% |
LOCAL AGENCY FURTHER INFORMATION
|
Sr. No. |
Check List by Info
Agents |
Available in Report
(Yes / No) |
|
1] |
Year of Establishment |
Yes |
|
2] |
Locality of the firm |
Yes |
|
3] |
Constitutions of the firm |
Yes |
|
4] |
Premises details |
No |
|
5] |
Type of Business |
Yes |
|
6] |
Line of Business |
Yes |
|
7] |
Promoter's background |
Yes |
|
8] |
No. of employees |
No |
|
9] |
Name of person contacted |
No |
|
10] |
Designation of contact person |
No |
|
11] |
Turnover of firm for last three years |
Yes |
|
12] |
Profitability for last three years |
Yes |
|
13] |
Reasons for variation <> 20% |
-- |
|
14] |
Estimation for coming financial year |
No |
|
15] |
Capital in the business |
Yes |
|
16] |
Details of sister concerns |
Yes |
|
17] |
Major suppliers |
No |
|
18] |
Major customers |
No |
|
19] |
Payments terms |
No |
|
20] |
Export / Import details (if applicable) |
No |
|
21] |
Market information |
-- |
|
22] |
Litigations that the firm / promoter involved in |
Yes |
|
23] |
Banking Details |
Yes |
|
24] |
Banking facility details |
Yes |
|
25] |
Conduct of the banking account |
-- |
|
26] |
Buyer visit details |
-- |
|
27] |
Financials if provided |
Yes |
|
28] |
Incorporation details if applicable |
Yes |
|
29] |
Last accounts filed at ROC |
Yes |
|
30] |
Major Shareholders if available |
Yes |
|
31] |
Date of Birth of Proprietor/Partner/Director if available |
Yes |
|
32] |
PAN of Proprietor/Partner/Director if available |
No |
|
33] |
Voter ID No of Proprietor/Partner/Director if available |
No |
|
34] |
External Agency Rating if available |
Yes |
CASE DETAILS
HIGH
COURT OF BOMBAY
|
Bench:- Bombay |
|||||||
|
Presentation Date:- 25/09/2013 |
|||||||
|
Lodging No:- |
ITXAL/1588/2013 |
Filing Date:- |
25/09/2013 |
Reg. No.:- |
ITXA/418/2014 |
Reg. Date:- |
01/03/2014 |
|
Petitioner:- |
THE COMMISSIONER OF INCOME TAX-2 |
Respondent:- |
TATA CHEMICALS LIMITED |
||||
|
Petn. Adv.: |
SURESH KUMAR () |
|
|
||||
|
District:- |
MUMBAI |
||||||
|
Bench:- |
SINGLE |
||||||
|
Status:- |
Pre-Admission |
Category:- |
TAX APPEALS |
||||
|
Last Date:- |
23/01/2014 |
Stage:- |
FOR REJECTION [ORIGINAL SIDE MATTERS] |
||||
|
Last Coram:- |
REGISTRAR (OS) PROTHONOTARY AND SR. MASTER |
|
|
||||
|
Act:- |
Income Tax Act, 1961 |
Under Section:- |
260A |
||||
UNSECURED LOAN
(Rs. In Millions)
|
Particular |
As on 31.03.2013 |
As on 31.03.2012 |
|
Long-Term Borrowings |
|
|
|
Debentures |
2500.000 |
2500.000 |
|
Unsecured from
banks |
|
|
|
External commercial borrowing |
8229.200 |
17125.700 |
|
Short-Term
Borrowings |
|
|
|
From banks: Buyer’s credit |
11961.000 |
2479.300 |
|
|
|
|
|
Total |
22690.200 |
22105.000 |
Notes:
(a) 10% Unsecured Redeemable Non-convertible Debentures of a face value Rs.1.000 Million each redeemable at par on 2nd July, 2019.
(b) The external commercial borrowing is due for repayments on 4th June, 2014 of net Rs. 5157.100 Millions (USD 95 million) and on 21st October, 2016 of net Rs. 3072.100 Millions (USD 60 million).
INDEX OF CHARGES
|
S.NO. |
CHARGE ID |
DATE OF CHARGE CREATION/MODIFICATION |
CHARGE AMOUNT SECURED |
CHARGE HOLDER |
ADDRESS |
SERVICE REQUEST NUMBER (SRN) |
|
1 |
10145875 |
16/03/2009 * |
2,400,000,000.00 |
IDBI TRUSTEESHIP SERVICES LIMITED |
ASIAN BLDG., GROUND FLOOR, 17, R.KAMANI MARG, BA LLARD ESTATE, MUMBAI- 400 001., MAHARASHTRA - 400001, INDIA |
A59259523 |
|
2 |
10007993 |
25/05/2006 |
400,000,000.00 |
STANDARD CHARTERED BANK |
90, MAHATMA GANDHI ROAD, FORT, MUMBAI, MAHARASHTRA - 400001, INDIA |
A01569474 |
|
3 |
10006692 |
25/05/2006 |
500,000,000.00 |
ICICI BANK LIMITED |
FREE PRESS HOUSE, 215, NARIMAN POINT, MUMBAI, MAHARASHTRA - 400021, INDIA |
A01568773 |
|
4 |
10006693 |
25/05/2006 |
500,000,000.00 |
BANK OF AMERICA |
EXPRESS TOWERS, NARIMAN POINT, MUMBAI, MAHARASHTRA - 400021, INDIA |
A01569151 |
|
5 |
10008799 |
25/05/2006 |
500,000,000.00 |
THE HONGKONG AND SHANGHAI BANKING CORPORATION LIMITED |
52/60,
MAHATMA GANDHI ROAD, MUMBAI, MAHARASHTRA - |
A01569813 |
|
6 |
10006975 |
25/05/2006 |
600,000,000.00 |
HDFC BANK LIMITED |
HDFC BANK HOUSESENAPATI BAPAT MARG, LOWER PAREL W, MUMBAI, MAHARASHTRA - 400013, INDIA |
A01583483 |
|
7 |
10007999 |
25/05/2006 |
750,000,000.00 |
CITI BANK N.A |
293
D N ROAD, FORT, MUMBAI, MAHARASHTRA - 400001, |
A01570696 |
|
8 |
10016030 |
25/05/2006 |
1,250,000,000.00 |
BANK OF BARODA |
CORPORATE FINANCE BRANCH, MUMBAI, MAHARASHTRA - 400001, INDIA |
A01571082 |
|
9 |
10006694 |
25/05/2006 |
3,150,000,000.00 |
STATE BANK OF INDIA |
VOLTAS HOUSE, 23, J.N. HEREDIA MARG, BALLARD ESTATE, MUMBAI, MAHARASHTRA - 400001, INDIA |
A01570167 |
|
10 |
90232274 |
17/03/2004 |
76,664,296.00 |
THE PRADESHIYA INDUSTRIAL AND INVESTMENT COMPANY LIMITED |
GOMTI NAGAR, LUCKNOW, UTTAR PRADESH, INDIA |
- |
|
11 |
90232273 |
16/03/2004 |
10,000,000.00 |
CENTRAL BANK OF INDIA |
66
FLOOR ;M.G. ROAD, PAREL, MUMBAI, UTTAR PRADESH |
- |
|
12 |
90232246 |
24/03/2003 * |
129,689,525.00 |
THE
PRADESHIYA INDUSTRIA AND INVESTMENT CORPORATION |
"PICUP
BHAWAN"' , GOMTI NAGAR,, LUCKNOW, UTTAR PR |
- |
|
13 |
90232186 |
18/04/2001 |
1,000,000,000.00 |
BANK OF BARODA |
BOMBAY SAMACHAR MARG, MUMBAI, MAHARASHTRA, INDIA |
- |
|
14 |
90232185 |
22/03/2001 * |
150,621,200.79 |
THE
PRADESHIYA INDUSTRIAL AND INVESTMENT CORPORATION |
"PICUP
BHAWAN", , GOMTI NAGAR,, LACKNOW, UTTAR PR |
- |
|
15 |
90232183 |
26/02/2002 * |
295,320,000.00 |
UTI BANK LIMITED |
CENTRAL
OFFICE, MAKER CHAMNBER, BOMBAY, MADHYA PR |
- |
|
16 |
80056746 |
27/03/2000 |
137,514,399.27 |
THE
PARDESHIYA INDUSTRIAL AND INVESTMENT CORP. OF U. |
'PICUP
BHAWAN', GOMTI NAGAR, LUCKNOW, UTTAR PRADES |
- |
|
17 |
90232136 |
18/08/1999 |
500,000,000.00 |
STTAE BANK OF INDIA |
CAG
BRRANCHKILLICK HOUSE, CHARANJIT RAO MARG, MUM |
- |
|
18 |
80056747 |
24/03/1999 |
37,743,962.70 |
THE
PRADESHIYA INDUSTRIAL AND INVESTMENT CORP. OF U. |
'PICUP
BHAWAN', GOMTI NAGAR, LUCKNOW, UTTAR PRADES |
- |
|
19 |
90232107 |
21/12/1998 * |
69,766,127.07 |
THE
PRADESHIYA INDUSTIRAL AND INVESTMENT CORPORATION |
"PICUP BHAWAN"', GOMTI NAGAR, LUCKNOW, UTTAR PRADESH - 226010, INDIA |
- |
|
20 |
90232105 |
02/11/1998 * |
2,000,000,000.00 |
STTAE BANK OF INDIA |
COMMERCIAL
BRANCH, G;N. VAIDYA MARG, MUMBAI, MAHA |
- |
|
21 |
90232091 |
12/08/1998 * |
500,000,000.00 |
THE
INDUSTRIAL CREDIT AND INVESTMENT CORPORATION OF |
163;BACKBAY
RECLAMATION, MUMBAI, MAHARASHTRA, INDI |
- |
|
22 |
90232075 |
20/03/1998 |
144,194,033.00 |
THE
PREDISHYA INDUSTRIAL AND INVESTMENT COMPANY OF U.P. |
PICK
UP BHAWAN, GOMTI NAGAR, LUCKNOW, UTTAR PRADE |
- |
|
23 |
90232071 |
12/03/1998 * |
4,140,000,000.00 |
THE
INDUSTRIAL CREDIT AND INVESTMENT CORPORATIN OF |
163; BACKBAY RECLAMATION, MUMBAI, MAHARASHTRA, INDIA |
- |
|
24 |
90232062 |
27/12/1997 |
16,900,000.00 |
BSNK OF BARODA |
BOMBAY
MAIN HOUSE, PATEL STREET ; BARODA HOUSE, M |
- |
|
25 |
90232041 |
26/07/2001 * |
1,400,000,000.00 |
THE
INDUSTRIAL CREDIT AND INVESTMENT CORPORATION OF |
163; BACKBAY RECLAMATION, MUMBAI, MAHARASHTRA, INDIA |
- |
|
26 |
90232027 |
08/07/1997 |
2,868,000.00 |
THE
INDUSTRIAL CREDIT AND INVESTMENT CORPORATION OF |
163;BACKBAY RECLAMATION, MUMBAI, MAHARASHTRA, INDIA |
- |
|
27 |
80056745 |
05/03/1997 |
134,250,715.31 |
THE PRADESHIYA INDUSTRIAL AND CORP. OF U.P. LIMITED |
'PICUP
BHAWAN', GOMTI NAGAR, LUCKNOW, UTTAR PRADES |
- |
|
28 |
90231984 |
18/07/1996 |
60,000,000.00 |
CENTRAL BANK OF INDIA |
66
FLOOR ;M.G. ROAD, PAREL, MUMBAI, UTTAR PRADESH |
- |
|
29 |
90231946 |
03/07/1997 * |
977,500,000.00 |
STATE BANK OF INDIA |
CORPORATE
ACC.;GROUP BRANCH, KLICK HOUSE, MUMBAI, |
- |
|
30 |
90231943 |
08/09/1995 |
300,000,000.00 |
CITIBANK N.A. |
SAKHAR
BHAWAN, NARIMAN POINT, BOMBAY, MAHARASHTRA |
- |
|
31 |
90231942 |
28/08/1995 |
300,000,000.00 |
BANK OF AMERICA |
EXPRESS
TOWER, NARIMAN POINT, BOMBAY, MAHARASHTRA |
- |
|
32 |
90231895 |
08/08/1994 |
2,640,000.00 |
CITIBANK N.A |
SAHKAR BHAWAN, NARIMAN POINT, MUMBAI, MAHARASHTRA, INDIA |
- |
|
33 |
90231892 |
11/07/1994 |
300,000,000.00 |
INDUSTRIAL DEVELOPMET BANK OF INDIA |
IDBI TOWER, CUFFE PARADE, MUMBAI, MAHARASHTRA, INDIA |
- |
|
34 |
90231858 |
29/12/1993 |
300,000,000.00 |
STATE BANK OF INDIA |
COMMERCIAL BRANCH, JUSTICE V.N. VAIDYA MARG, MUMBAI, MAHARASHTRA, INDIA |
- |
|
35 |
90231847 |
02/11/1993 |
300,000,000.00 |
STTAE BANK OF INDIA |
COMMERCIAL
BRANCH, G;N. VAIDYA MARG, MUMBAI, MAHA |
- |
|
36 |
90231826 |
17/05/1993 * |
30,000,000.00 |
THE
INDUSTRIAL CREDIT AND INVESTMENT CORPORATION OF |
163; BACKBAY RECLAMATION, MUMBAI, MAHARASHTRA, INDIA |
- |
|
37 |
90231816 |
01/02/1993 |
290,000,000.00 |
INDUSTRIAL DEVELOPMENT BANK OF INDIA |
163;
BACKBAY RECLAMATION, 16; SANSAD MARG; P.B. N |
- |
|
38 |
90231805 |
21/10/1992 |
200,000,000.00 |
THE
INDUSTRIAL CREDIT & INVESTMENT CORPORATION OF |
163; BACKBAY RECLAMATION, MUMBAI, MAHARASHTRA, INDIA |
- |
|
39 |
90231790 |
21/10/1992 * |
271,000,000.00 |
INDUSTRIAL DEVELOPMENT BANK OF INDIA |
IDBI
TOWER, CUFFE PARADE, MUMBAI, MAHARASHTRA, IN |
- |
|
40 |
90231787 |
17/05/1998 * |
290,000,000.00 |
LIFE INSURANCE CORPORATION OF INDIA |
CHURCHE GATE, 25-27; ASAF ALI ROAD, MUMBAI, MAHARASHTRA, INDIA |
- |
|
41 |
90231781 |
17/05/1993 * |
230,000,000.00 |
INDUSTRIAL DEVELOPMENT BANK OF INDIA |
IDBI TOWER, CUFFE PARADE, MUMBAI, MAHARASHTRA, INDIA |
- |
|
42 |
90231764 |
30/12/1991 |
290,000,000.00 |
INDUSTRIAL DEVELOPMENT BANK OF INDIA |
163;
BACKBAY RECLAMATION, 16; SANSAD MARG; P.B. N |
- |
|
43 |
90231745 |
21/10/1992 * |
50,000,000.00 |
THE PRADESHIYA INDUSTRIAL AND INVESTMENT CO. LTD. |
GOMTI NAGAR, LUCKNOW, UTTAR PRADESH, INDIA |
- |
|
44 |
90231735 |
12/03/1998 * |
15,000,000.00 |
THE
INDUSTRIAL CREDIT AND INVESTMENT CORPORATIN OF |
163; BACKBAY RECLAMATION, MUMBAI, MAHARASHTRA, INDIA |
- |
|
45 |
90231728 |
21/10/1992 * |
1,230,000,000.00 |
THE PRADESHIYA INDUSTRIAL AND INVESTMENT COMPANY LIMITED |
GOMTI NAGAR, LUCKNOW, UTTAR PRADESH, INDIA |
- |
|
46 |
90231629 |
22/06/1990 * |
628,900,000.00 |
BANK OF BARODA |
INDUSTRIAL
FINANCE BRANCH, BARODA HOUSE,CPSTRE |
- |
|
47 |
90231547 |
08/11/1985 |
465,812.00 |
THE
INDUSTRIAL CREDIT AND INVESTMENT CORPORATION OF |
163; BACKBAY RECLAMATION, MUMBAI, MAHARASHTRA, INDIA |
- |
|
48 |
90231459 |
06/05/1981 |
10,331.00 |
THE
INDUSTRIAL CREDIT AND INVESTMENT CORPORATION OF |
163;BACKBAY RECLAMATION, MUMBAI, MAHARASHTRA, INDIA |
- |
|
49 |
90231455 |
29/01/1981 |
15,000,000.00 |
BANK OF BARODA |
BOMBAY SAMACHAR MARG, MUMBAI, MAHARASHTRA, INDIA |
- |
|
50 |
90231435 |
19/10/1979 |
5,900,000.00 |
THE
INDUSTRIAL CREDIT AND INVESTMENT CORPORATION OF |
163;
BACKBAY RECLAMATION, NARIMAN POINT, BOMBAY, |
- |
Note: * Date of
charge modification
PERFORMANCE REVIEW
The net revenue from operations of the Company increased from Rs. 79962.500 Millions to Rs. 85298.700 Millions registering a growth of 6.7% over the previous year. Profit before tax was Rs. 8253.700 Millions whereas the Profit after tax was at Rs. 6433.200 Millions an increase of 8.0% and 9.7% respectively over the previous year.
The consolidated net revenue from operations increased from Rs. 138150.300 Millions to Rs. 148588.300 Millions an increase of 7.6% over the previous year. On consolidated basis the Profit before tax was Rs. 9130.300 Millions whereas the Prof t after tax before Minority Interest and share of Loss in Associates was at Rs. 6105.100 Millions a decrease of 34% and 41.3% respectively over the previous year. Profit attributable to the Group after deducting the minority interest and share of loss in Associate was at Rs. 4004.000 Millions a decrease of 52.2% over the previous year.
Tata Chemicals Limited’s (TCL or the Company) operation is organised under four segments i.e. (1) Inorganic Chemicals comprising Soda Ash Salt Sodium Bicarbonate Marine Chemicals Caustic Soda and Cement (2) Fertilisers comprising Fertilisers and other traded fertilisers (3) Other Agri-inputs including Rallis India Limited’s operations and (4) Others - comprising Water Purifi er Nutritional Solutions and Pulses. Performance review of these businesses are as under:
INORGANIC CHEMICALS
SEGMENT
INDIA OPERATIONS:
During the year the Company’s Industrial Chemicals operation achieved sales of Rs. 17790.000 Millions compared to sales of Rs. 14980.000 Millions in the previous year.
The domestic Soda Ash market witnessed a mixed year with strong growth greatly buoyed by increase in imports. The first half of the year witnessed a surge of imports and robust support from detergent and glass industries. However the second half of the year saw sluggish growth with downstream sectors reeling under market overcapacity. Pricing pressure continued to prevail in the market with macro-economic pressures due to slower growth and tightening market dynamics.
The sodium bicarbonate market demand exhibited strong growth of around 16% after a fl at market demand in the previous year. Even though domestic sales remained strong the market absorbed very high bicarbonate imports.
In order to open up new markets and explore further growth avenues the Company has engaged in trading operations in the Inorganic Chemicals space. The existing competencies of product quality customer-connect and wide distribution network will be leveraged for new and related product establishment.
Soda Ash
The Indian soda ash demand grew substantially by 12% over the previous year with record-level of imports. In spite of trade measures coming into force this year around 690000 tons primarily from Kenya Bulgaria China and Turkey entered the market. Whereas the first half of the year witnessed strong demand support the second half was affected by market overcapacity. The Company’s production of soda ash at Mithapur during the year was 693396 tons as against the previous year’s figure of 690181 tons. The Company also achieved its highest ever sales in the Indian market of 691372 tons of soda ash during the year. The Company continues to support customer specific requirements and service market growth through material sourced from its subsidiaries and growing domestic sales volume reflect this.
Apart from operational streamlining and maintenance improvement practices as part of its continuous improvement initiative using Lean Six Sigma framework the Company looked at newer ways of partnering with customers around the themes of sustainability and growth. Focus was laid on creation of sustainable supply chain solutions by adopting bulk movement of finished goods. Initiatives around site attractiveness and employee engagement are showing positive results evidenced by reduced attrition at the site.
Sodium Bicarbonate
During the year the Company achieved the highest ever production of 86724 tons of sodium bicarbonate as compared to the previous year’s production of 80285 tons. While this year saw record level of imports at around 20000 tons the Company maintained its market share of almost 50% with sales of 84148 tons as compared to 81381 tons in the previous year. During the year the Company not only established the branded bicarbonate offerings in the domestic market but also forayed into exports of these products. This is in line with the Company’s strategy to offer value added branded variants as the domestic market matures and grows over a period of time and is consistent with its global portfolio for this product. The overall Indian sodium bicarbonate market grew by around 16% during the year as compared to flat growth in the previous year.
Cement
The Gujarat cement market grew by 7% to 19.4 million tons during FY 2012-13. During the year the Company achieved production and sales of Ordinary Portland Cement (OPC) at 440750 tons and 435108 tons respectively. In addition it also produced 81699 tons and sold 82150 tons of masonry cement during the year. Exploratory work is also being evaluated for niche cement variants and down-stream products.
Consumer Products -
Salt and related products
During FY 2012-13 the consumer products demonstrated strong performance by leveraging its distribution system and brand equity. During the year sales turnover of the consumer products grew by 25% to Rs. 11940.000 Millions from Rs. 9580.000 Millions in the previous year.
Iodised salt production in Mithapur was 800121 tons up 28.6% from 621933 tons in the previous year. Overall branded salt sales grew by 7.7% from 868525 tons in FY 2011-12 to 935579 tons in FY 2012-13. Sales of Tata Salt grew by 11.4% in volume from 654468 tons in FY 2011-12 to 728829 tons in FY 2012-13. Tata Salt continues to be the largest distributed brand with a reach of 14.3 lacs retail outlets across India.
Sales of I-Shakti during the year was 187686 tons. I-Shakti salt continues to meet the iodisation movement complimenting Tata Salt. The Company’s market share of its salt portfolio has increased to 66.8% in the National Branded Salt segment up from 64.3% in FY 2011-12. Sales of Tata Salt Lite grew by 30.5% in volume from 8338 tons in FY 2011-12 to 10883 tons in FY 2012-13. Sales of I-Shakti cooking soda showed an encouraging growth of 48.6% with sales of 1908 tons during the year as compared to 1284 tons in the previous year.
The business continues to work towards new product introduction through salt variants and development of other categories.
OVERSEAS OPERATIONS
Tata Chemicals North
America Inc.
Tata Chemicals North America Inc. (TCNA) achieved gross sales of USD 479 million (Rs. 26046.400 Millions) and EBITDA of USD 115 million (Rs. 6252.300 Millions) for the year. These were lower by 0.4% and 6.5% respectively as against the previous year.
Soda Ash sales volume during the year were 2343055 tons as against the previous year volume of 2376161 tons as a result of improved operating equipment efficiencies. Global soda ash sales prices declined during the year primarily due to lower realised sales prices into the Asian and Latin American markets due to increased competition reduced demand in Europe and lower capacity utilisation in China.
Tata Chemicals Europe
Tata Chemicals Europe achieved sales turnover of GBP 186 million (Rs.16017.300 Millions) similar to the previous year. EBITDA decreased by 10% to GBP 35 million (Rs. 3008.800 Millions) reflecting lower soda ash sales and production volumes (which resulted in lower production efficiencies) primarily as a result of weaker soda ash market conditions and demand.
Soda Ash
Soda ash production was 734581 tons a decrease of 8.7% compared to the previous year reflecting weaker soda ash market conditions and demand. Production at both the soda ash facilities was adversely impacted by equipment unreliability and technical problems.
Sodium Bicarbonate
Sodium bicarbonate production was 93952 tons a decrease of 7.7% over the previous year was due to the weaker soda ash production volumes.
Salt
Salt (Purified Dried Vacuum) sales at 375414 tons (down 12.1%) and associated other salt sales collectively generated an EBITDA of GBP 16.4 million (Rs. 1410.100 Millions) with lower domestic winter demand due to unseasonably warm weather being the principal factor for the reduced sales volume.
Tata Chemicals Magadi
Limited
During the year Tata Chemicals Magadi Limited (TCML) achieved a sales turnover of USD 104.3 million (Rs. 5674.600 Millions) as compared to USD 116.8 million (Rs. 5599.500 Millions) in the previous year and posted a negative EBITDA of USD 2.03 million (Rs. 110.400 Millions) as against USD 20.65 million (Rs. 990.000 Millions) in the previous year. In the fi rst quarter of FY 2012-13 unusually heavy rains flooded lake Magadi severely affecting access to the raw material and ultimately affecting the soda ash production. In the second quarter of FY 2012-13 the Governments of India and Pakistan imposed an anti-dumping duty of approximately USD 20 / tons on all imported soda ash from Kenya. This action led to a delay in confirmation of orders by customers a temporary disruption of TCML sales to these markets and a reduction in the sales price realisation. EBITDA for the year was also affected by one-time fixed costs of USD 2.4 million (Rs. 130.600 Millions).
Despite the prevailing adverse conditions described above production performance of the Premium Ash (PAM) plant stabilised and significant improvements were achieved in efficiencies for fuel and power usage. In addition TCML continued to focus on operating effectiveness and efficiencies with initiatives such as Lean Six Sigma. Conversion to coal gasification in lieu of heavy fuel oil is on course with the primary aim to achieve long-term sustainable competitive advantage.
AMALGAMATION OF
WYOMING-1 (MAURITIUS) PRIVATE LIMITED WITH THE COMPANY
During the year, the Scheme of Amalgamation of Wyoming-1 (Mauritius) Private Limited (Wyoming-1), a wholly owned subsidiary, with the Company (‘the Scheme’) was filed before the High Court of Judicature at Bombay for its sanction pursuant to Section 391-394 of the Companies Act, 1956 (‘the Act’).
The Hon’ble High Court of Judicature at Bombay sanctioned the Scheme vide its Order dated 4th May, 2012. The
Scheme became effective on 23rd May, 2012 with the Appointed Date of the Scheme as 1st January, 2012. No shares of the Company were issued and allotted in lieu or exchange of the equity shares of Wyoming 1 under the Scheme.
AWARDS AND RECOGNITIONS
The Company during
the year has won many awards some of which are listed below:
Corporate
Sustainability and Safety Health and Environment
• Prestigious FE-EVI Green Business Leaders Award 2012
• FICCI Water Awards 2012
• CNBC Asia’s India CSR Award
• Awarded ‘Sustainability Plus’- the world’s first corporate sustainability label by CII
• CII - ITC Sustainability Award
• Recognised in the Carbon Disclosure Leadership Index in Carbon Disclosure Project in 2012
Communications
• 5 Awards at the Annual ABCI Awards
Product
• CII Design Excellence Award 2012 for Tata Swach
• Tata I Shakti Pulses voted as the Product of the Year 2012.
MANAGEMENT DISCUSSION
AND ANALYSIS
BUSINESS ENVIRONMENT
Global
The world economy is expected to grow by 3.1% in 2013 the same as in 2012 as indicated by the International Monetary Fund (IMF). The IMF expects advanced economies to grow by 1.2% while emerging economies are expected to grow by 5% in 2013.
Growth in the advanced economies is not expected to pick up with growth in US projected lower at 1.7% (2.2% in
2012) and the Euro Area expected to remain stagnant at -0.6%. On the other hand Japan is likely to show a slight improvement in growth to 2% from 1.9% in 2012.
While downside risks to global growth may have waned the Emerging Market Economies (EMEs) are experiencing signs of a longer growth slowdown. Growth prospects in these economies are expected to be tenuous in 2013. Even though some of the major economies show better growth they would still be below the potential which was reached in the pre-crisis period. The biggest economy amongst EMEs i.e. China is estimated to grow by a steady 7.8% in 2013 the same as 2012. Looking ahead it will be difficult to sustain the high growth rate should domestic consumption not expand.
Domestic
India’s economy is estimated to have grown 5% during Financial Year (FY) 2012-13 down from 6.2% in FY 2011-12. It is expected to pick-up to around 5.6% in FY 2013-14 on the back of expected good monsoons expected improvement in the savings-investment scenario furthering of fiscal reforms along with supportive monetary policy support to consumption from rural demand in a pre-election year and a slightly more supportive external economic environment. A normal monsoon in terms of both its timing and geographic dispersion is critical for agriculture sector output and demand. Despite the increase growth is expected to remain below the potential of the economy especially compared to the pre-crisis high-growth phase.
A major factor behind the downturn in the Indian economy has been a decline in the corporate investment and the household financial savings rate. High cost of capital weak demand expectations of firms problems in securing essential raw materials (especially coal and iron ore) and fuel linkages problems in acquiring necessary clearances and land acquisition have collectively contributed to the weak investment scenario.
The decline in the savings rate is largely a result of lower corporate profits and government savings combined with a decline in household financial savings due to high inflation. Liquidity remained tight almost throughout the year. This coupled with large government borrowings deterred banks’ ability to provide credit to the private sector. Interest rates also remained elevated. So far the Reserve Bank of India has been conservative in reducing policy rates.
India’s Current Account Deficit (CAD) was higher at 4.8% of GDP during FY 2012-13 compared to 4.2% of GDP during FY 2011-12 fuelled by rising imports of oil and gold. Large CAD which rose to a record high of 6.7% in Q3
2012 contributed to the weakness of the Rupee which has averaged at 54.32/USD in FY 2012-13 as against 47.87/ USD in FY 2011-12a depreciation of 13.4%.
INORGANIC CHEMICALS
The key products under the segment of Inorganic Chemicals are soda ash sodium bicarbonate cement and salt.
Soda Ash
With a capacity of over 5 million tons the Company is the second largest soda ash manufacturer in the World with
8% global capacity share. About two-thirds of this capacity is based on natural soda ash. This unique feature helps the Company to have a low energy intensity and low environmental footprint. The Company’s natural soda ash (derived from trona) operations are located at Lake Magadi in Kenya and at the Green River Basin of Wyoming in the USA where the world’s largest deposits of trona occur. Synthetic soda ash and sodium bicarbonate are manufactured at Mithapur India and Northwich UK. This process uses brine (salt water) and limestone as key raw materials.
With manufacturing facilities located across the four continents of North America Europe Africa and Asia the Company has the ability to optimally serve customers across the globe. Additionally distributed sourcing of raw
materials increases the reliability of supplies and mitigates the risks associated with potential regional disruptions that can adversely impact the global supply chain.
Emerging economies have been the primary growth driver for soda ash over the past decade. With rapidly increasing GDP and urbanisation these economies have experienced an increased per capita consumption of products using soda ash including fl at glass (automobiles housing) container glass (beverages) detergents baked goods clean water and sodium based chemicals. The global soda ash demand grew at 1.8% to 54 million tons in 2012. While majority of this growth was still in China Chinese domestic demand growth did see a slowdown compared to previous years. Overall world demand is forecast to grow at 4% p.a. through 2017 with fl at glass line additions in developing regions fuelling this demand growth.
Global soda ash production capacity increased approximately 6% to 65 Million tons with most of the capacity addition happening in China. Some synthetic manufacturers like Penrice (Australia) and Solvay (WEP) have announced capacity closures this year. Overcapacity in the market continues to be region specific. China and Europe have more capacity than demand while the producers in US Turkey and India are operating at high rates. World operating rates dropped from 86% in the previous year to about 83% during the year. World supply is forecast to grow at 3.7% p.a. through 2017 with China and Turkey leading this capacity addition.
Global soda ash prices increased in 2012 in the USA India and Europe reflecting increased input costs across the world as well as tight soda ash supply in some of these regions. However soda ash prices decreased in the major trading regions of Southeast Asia and Latin America as the U.S. producers gained market share primarily against the Chinese producers. By early 2013 pricing in these regions has largely stabilised as the U.S. producers find themselves near 100% capacity utilisation. Prices are expected to remain at current levels in the short term or see marginal upward revision in the second half of FY 2013-14.
In FY 2012-13 the Indian soda ash market witnessed two contrasting halves. The first half saw unprecedented growth of imports inspite of trade measures becoming effective in April 2012. The imports for FY 2012-13 were at a historical high of around 690000 tons. Low monsoon resulted in the detergent production not dipping during
that period. Overall detergent growth was robust and most fl oat and container glass units were operating at nearly full capacity. However towards the latter part of the year container glass units were operating at sub-optimal rates due to overcapacity and detergent end-use demand slowed down marginally. The domestic market witnessed an impressive overall growth of 12% for FY 2012-13 however accompanied by reports of higher inventory levels with customers and in trade markets.
While another fl oat glass line is expected to be commissioned in Rajasthan in FY 2013-14 it is estimated that the
overall soda ash consumption in fl at glass will not see an increase. It is expected that some fl oat glass units and container glass units will continue production at reduced operating rates to counter market overcapacity pressures.
Detergent demand is expected to improve on the back of end-use demand leading to an overall 4-5% p.a. growth in the Indian soda ash market over the next 5 years.
Sodium Bicarbonate
Sodium bicarbonate is commonly used as an ingredient in pharmaceuticals food additives animal feed and air pollution control. The Company is the world’s fourth largest producer of sodium bicarbonate with about 6% capacity share (FY 2012-13) and is the market leader in India and UK.
In Europe Tata Chemicals Europe’s (TCE) sodium bicarbonate brands Briskarb® and Alkakarb® have wide market acceptance and an established position. In 2012 demand for sodium bicarbonate in the UK was 60000 tons a marginal decrease compared to 2011 as some pharmaceutical production moved overseas although they required TCE product. The UK market continues to be driven by treatment of flue gas from waste incineration activities. TCE’s reputation for quality and differentiated grades continues to be its strength in the development of niche value sectors such as foam blowing soda blasting and other more graded product applications.
In India sales were marginally higher during the year helping the Company achieve a market share of over 50% in the domestic market. Sodium bicarbonate demand continues to demonstrate healthy growth across all consuming sectors particularly in food related applications. Growth rates of 8-10% p.a. are anticipated for the next 5 years. Growth drivers are reagent demand in alkali leaching of uranium ore and sustained incremental demand in the food and feed sectors.
Cement
The Company’s cement plant was setup in the year 1993 to convert solid wastes generated as by-products of soda ash manufacture to value-added products. The Company uses technology to separate solid effl uents and process them into Ordinary Portland Cement (OPC) and Masonry cement. Masonry cement enables the Company to convert its fly ash (generated in the power plant) into useful binding material. While the upward trend in raw material and freight costs is likely to be a key challenge for the business the Company will continue to focus on catering to the nearby markets for maximising realisations.
Cement sales crossed 500000 tons for the second time in 5 years in FY 2012-13 building upon the good performance in the previous year. This will continue to be supported by high regional growth rates of 9% estimated for FY 2013-14 up from 7% for FY 2012-13.
Salt
In India the estimated current annual consumption of edible salt is approximately 5.7 million tons. The demand for edible salt is expected to grow at around 1.5% p.a. The private sector contributes over 88% of the salt production the public sector has a share of about 2% while the cooperative sector contributes the balance 10%.
The salt portfolio of the Company continued to grow in FY 2012-13 leveraging its brand equity and a strong distribution network. While continuing its leadership position in the packaged salt market ’Tata Salt’ was ranked second in the Most Trusted Food brands as per the Economic Times Brand Equity Survey.
Tata Salt has shown growth in southern India with the Brand Equity Index (BEI) at 6.3 its highest ever level. This is also corroborated through growing sales in the southern market. ’Tata Salt Lite’ continues to lead in the premium low-sodium salt segment with a growing awareness and consumption driven by North Indian markets. All the salt brands continued to grow and together have achieved a market share of 66.8% amongst the national salt brands.
In the UK white (or Purified Dried Vacuum or PDV) salt has two major markets i.e. food and water softening. While historically these two demand sectors have been boosted by road treatment for winter weather conditions the market is less likely to require white salt for this purpose in today’s more sensitised environment therefore these spot sales opportunities are becoming more limited.
UK sales volume remained fl at as against the previous year with TCE holding market share of just over 50%. TCE has a key focus on providing high level of customer service to both the key sectors.
CONTINGENT
LIABILITIES:
(a) Guarantees:
(i) Bank Guarantees issued by Banks on behalf of the Company Rs. 2679.600 Millions (previous year Rs. 1633.900 Millions). These are covered by the charge created in favour of the Company's bankers by way of hypothecation of stocks and debtors.
(ii) Guarantees provided to third parties on behalf of subsidiaries USD 388.30 million (Rs. 21078.900 Millions) (previous year USD 138.30 million (Rs. 7036.000 Millions))
(b) Claims not acknowledged by the Company relating to cases contested by the Company and which, in the opinion of the Management, are not likely to devolve on the Company relating to the following areas:
(Rs. In Millions)
|
Particular |
31.03.2013 |
31.03.2012 |
|
Excise and Customs |
32.600 |
42.100 |
|
Sales Tax |
114.000 |
891.100 |
|
Demand for utility charges |
566.900 |
568.600 |
|
Labour and other claims against the Company not acknowledged as debt |
23.900 |
18.900 |
|
Income Tax (Pending before Appellate authorities in respect of which the Company is in appeal) |
1889.800 |
1867.000 |
|
Income Tax (Decided in Company's favour by Appellate authorities and Department is in further appeal) |
373.300 |
373.000 |
(c) Various claims pending before Industrial Tribunals and Labour Courts of which amounts are indeterminate.
STANDALONE AUDITED
FINANCIAL RESULTS FOR THE QUARTER AND NINE-MONTHS ENDED 31ST DECEMBER, 2013
(Rs. In Millions)
|
|
Particulars |
31.12.2013 |
30.09.2013 |
31.12.2013 |
|
|
1 |
Income from
operations |
|
|
|
|
|
|
a) Sales / income from operations |
27196.900 |
23664.400 |
67870.800 |
|
|
|
Less : Excise duty |
617.000 |
572.000 |
1724.700 |
|
|
|
Net sales/ income from operations |
26579.900 |
23092.400 |
66146.100 |
|
|
|
b) Other operating income |
141.000 |
457.700 |
693.500 |
|
|
|
Total income from
operations |
26720.900 |
23550.100 |
66839.600 |
|
|
2 |
Expenses |
|
|
|
|
|
|
a) Cost of materials consumed |
9614.400 |
10160.400 |
25104.000 |
|
|
|
b) Purchase of stock-in-trade |
3678.800 |
5691.700 |
15312.900 |
|
|
|
c) Changes in inventories of finished goods work-in- progress and stock-in-trade |
3249.800 |
(1920.100) |
(1825.400) |
|
|
|
d) Employee benefits expense |
697.400 |
614.400 |
2018.100 |
|
|
|
e) Power and fuel |
2107.600 |
2273.700 |
6230.600 |
|
|
|
f) Freight and forwarding charges |
1776.100 |
1652.500 |
4805.400 |
|
|
|
g) Depreciation and amortisation expense |
395.000 |
397.700 |
1203.100 |
|
|
|
h) Other expenses |
2862.100 |
2336.300 |
7588.300 |
|
|
|
Total expenses (2a to 2h) |
24381.200 |
21206.600 |
60437.000 |
|
|
3 |
Profit from operations
before other income finance costs and exceptional Items (1-2) |
2339.700 |
2343.500 |
6402.600 |
|
|
4 |
Other income |
-- |
-- |
-- |
|
|
|
a) Profit on sale/redemption of long term investments (note 2) |
-- |
-- |
-- |
|
|
|
b) Others |
263.300 |
503.400 |
1228.300 |
|
|
5 |
Profit from
ordinary activities before finance costs and exceptional Items (3+4) |
2603.300 |
2846.900 |
7630.900 |
|
|
6 |
Finance costs |
463.700 |
411.700 |
1316.900 |
|
|
7 |
Profit from ordinary
activities after finance costs but before exceptional Items (5-6) |
2139.300 |
2435.200 |
6314.000 |
|
|
8 |
Exceptional items : |
|
|
|
|
|
|
a) Exchange loss (net) on foreign currency long term borrowings including revaluation thereof (note 3) |
238.400 |
912.100 |
1584.700 |
|
|
|
b) Compensation on voluntary retirement |
-- |
-- |
-- |
|
|
|
c) Loss on sale/provision for diminution in the value of long term investments |
-- |
-- |
-- |
|
|
9 |
Profit from
ordinary activities before Tax (7-8) |
1900.900 |
1523.100 |
4729.300 |
|
|
10 |
Tax expense |
424.000 |
455.000 |
1180.000 |
|
|
11 |
Net profit after
Tax (9-10) |
1476.900 |
1068.100 |
3549.300 |
|
|
12 |
Paid-up equity share capital (Face value : ? 10 per share) |
2548.200 |
2548.200 |
2548.200 |
|
|
13 |
Reserves excluding revaluation reserves |
|
|
|
|
|
14 |
Earnings per share
(in ?) |
|
|
|
|
|
|
- Basic |
5.80* |
4.19* |
13.93* |
|
|
|
- Diluted |
5.80* |
4.19* |
13.93* |
|
|
* |
Not annualised |
|
|
|
|
|
See accompanying notes to the financial results |
|
|
|
||
|
|
|
|
|
||
|
A |
Particulars of
Shareholding |
|
|
|
|
|
1. |
Public Shareholding |
|
|
|
|
|
|
- Number of Shares |
175630421 |
175630421 |
175630421 |
|
|
|
- Percentage of shareholding |
68.94% |
68.94% |
68.94% |
|
|
2. |
Promoters and
promoter group Shareholding a)
Pledged/Encumbered |
|
|
|
|
|
|
- Number of Shares |
769276 |
769276 |
769276 |
|
|
|
- Percentage of shares (as a % of the total shareholding of promoter and promoter group) |
0.97% |
0.97% |
0.97% |
|
|
|
- Percentage of shares (as a % of the total share capital of the Company) |
0.30% |
0.30% |
0.30% |
|
|
|
b) Non-encumbered |
|
|
|
|
|
|
- Number of Shares |
78356581 |
78356581 |
78356581 |
|
|
|
- Percentage of shares (as a % of the total shareholding of promoter and promoter group) |
99.03% |
99.03% |
99.03% |
|
|
|
- Percentage of shares (as a % of the total share capital of the Company) |
30.76% |
30.76% |
30.76% |
|
|
|
Particulars |
31.12. 2013 |
|
B |
Investor Complaints |
|
|
|
Pending at the beginning of the quarter |
1 |
|
|
Received during the quarter |
7 |
|
|
Disposed of during the quarter |
7 |
|
|
Remaining unresolved at the end of the quarter |
1 |
Standalone Audited
Segment wise Revenue Results and Capital Employed
(Rs. In Millions)
|
Particulars |
31.12.2013 |
30.09.2013 |
31.12.2013 |
|
1 Segment revenue |
|
|
|
|
a. Inorganic chemicals |
7634.100 |
7296.400 |
21818.800 |
|
b. Fertilisers (note 5) |
17774.000 |
15386.600 |
40892.800 |
|
c. Other agri inputs |
929.900 |
598.100 |
3136.800 |
|
d. Others |
520.900 |
317.200 |
1231.400 |
|
Total |
26858.900 |
23598.300 |
67079.800 |
|
Less: Inter segment |
279.000 |
505.900 |
933.700 |
|
Total segment
revenue |
26579.900 |
23092.400 |
66146.100 |
|
2 Segment result |
|
|
|
|
a. Inorganic chemicals |
1347.200 |
1730.500 |
4521.900 |
|
b. Fertilisers (note 5) |
1376.300 |
1025.200 |
2921.200 |
|
c. Other agri inputs |
77.200 |
35.300 |
264.300 |
|
d. Others |
(122.000) |
(87.600) |
(259.200) |
|
Total |
2678.700 |
2703.400 |
7448.200 |
|
Less : |
|
|
|
|
(i) Finance costs |
463.700 |
411.700 |
1316.900 |
|
(ii) Net unallocated expenditure /(income) |
314.100 |
768.600 |
1402.000 |
|
Profit before Tax |
1900.900 |
1523.100 |
4729.300 |
|
3 Capital employed |
|
|
|
|
a. Inorganic chemicals |
14153.200 |
15017.000 |
14153.200 |
|
b. Fertilisers (note 5) |
18902.200 |
18496.700 |
18902.200 |
|
c. Other agri inputs |
570.700 |
46.200 |
570.700 |
|
d. Others |
734.300 |
854.200 |
734.300 |
|
e. Unallocated |
22849.600 |
21319.000 |
22849.600 |
|
Total |
57210.000 |
55733.100 |
57210.000 |
NOTES TO STANDALONE AUDITED
FINANCIAL RESULTS:
The above results were reviewed by the Audit Committee and approved by the Board of Directors at its meeting held on 3rd February, 2014 and the same have been audited by the Statutory Auditors.
Profit on sale/redemption of long term investments for the quarter and nine months ended 31st December 2012 and for the year ended 31st March 2013 represents profit on redemption of the Company’s investment in the following wholly owned subsidiary, arising on foreign currency fluctuation:
Bio Energy Venture - 1 (Mauritius) Private Limited – Rs. 1304.300 millions for the quarter and nine months ended 31st December, 2012 and Rs. 2296.600 millions for the year ended 31st March, 2013 and
Home field International Private Limited – Rs. Nil for the quarter and nine months ended 31st December, 2012 and Rs. 154.800 millions for the year ended 31st March, 2013
The Company had entered into an agreement to refinance the outstanding External Commercial Borrowing (ECB) of USD 190 Mn during the period of nine months ended 31st December, 2013. Pursuant to this refinancing, the balance of unamortised “Foreign Currency Monetary item Translation Difference Account” (FCMTDA) aggregating Rs. 547.900 millions (net of tax) relating to original loan had been written off; and the Company has terminated the related options, cross currency swaps and forward contracts as a result of which, there is a net charge of Rs. 238.400 millions on account of early termination of these derivative contracts.
The Board of Directors of the Company had approved the Scheme of Amalgamation ('the Scheme') of Homefield International Pvt. Ltd. ('Homefield') with the Company. Homefield is a wholly owned subsidiary of the Company with its registered office in Mauritius. No shares of the Company will be issued and allotted in lieu or exchange of the equity shares of Homefield under the Scheme. The rights of members of the Company will not be affected since there would be no change in the equity share capital of the Company. The appointed date of the Scheme is 1st April, 2013. The Petition under Sections 391-394 of the Companies Act, 1956 with the Hon’ble High Court of Judicature at Bombay has been admitted and the final hearing is awaited.
The previous period figures have been regrouped / rearranged wherever necessary.
FIXED ASSETS
Tangible Assets
- Land
- Buildings
- Plant and Machinery
- Furniture and Fittings
- Vehicles
- Office Equipment
- Saltworks, Reservoirs and Pans
- Traction Lines, Railway Sidings and Wagons
- Water Works
AS PER WEBSITE DETAIL
Press Release
TATA CHEMICALS
BABRALA PLANT WINS THE PRESTIGIOUS CII ENERGY EFFICIENT UNIT AWARD
August 28 2013
Babrala plant which produces urea in Uttar Pradesh is amongst the most energy-efficient fertiliser plants in India
Mumbai: Tata Chemicals (TCL) bagged the CII award for Excellence in Energy Management 2013 for the company’s Babrala plant in Uttar Pradesh.TCL won the ‘Energy Efficient Unit’ award in the general category. The company was felicitated at the14th National Awards for Excellence in Energy Management 2013 at a gala function in Hyderabad. The award strengthens the company’s commitment to environmental stewardship and its constant endeavour of meeting sustainability goals.
The Tata Chemicals Babrala plant was amongst 76 selected companies from around 232 applicants from across India. The company was selected based on its rigorous efforts for energy conservation during the last three years.
Speaking on the achievement R Mukundan MD TCL said “All Tata Chemicals manufacturing plants have demonstrated sustainable performance in achieving targets on their energy water and inclusivity dimensions and are becoming benchmarks on their environmental and safety performance. Our Babrala plant is amongst the most energy-efficient fertiliser plant in India. These prestigious awards and recognitions help us calibrate our approach to raise the bar and meet the emerging expectations around sustainable performance.”
The companies were evaluated based on criteria such as continuous improvements for energy conservation recycling of waste focus on renewable energy resources latest energy management systems (ISO-50001) etc. Categories for the award include cement power building and general.
The objective of the awards was to recognise and award excellence in energy management in industries and to facilitate sharing of information by the best energy-efficient companies. The entire focus of the evaluation was to assess the trend of reduction in specific energy consumption proximity to global best in energy consumption innovation in identifying and implementing energy-saving projects savings achieved methodology adopted during the implementation proven efforts taken by the company to sustain the savings and utilisation of renewable energy and waste materials.
The Tata Chemicals Babrala plant has also been awarded the Sword of Honour four times by the British Safety Council.
TATA CHEMICALS
INVITES NOMINATIONS FOR THE 3RD EDITION OF THE BEST CHEMISTRY TEACHER AWARD
(BCTA)
August 13 2013
Mumbai: In line with its mission of serving society through science Tata Chemicals is organising its 3rd edition of the annual Best Chemistry Teacher Award (BCTA) 2013 along with the Association of Chemistry Teachers (ACT) and CII. These awards recognise exceptional contribution of individuals from the chemistry teaching fraternity and inspire a whole new generation to actively pursue chemistry and its allied subjects.
Nominations to apply for the awards will be open until September 30 2013 wherein the applicant should be a full-time teacher engaged in teaching chemistry to class XI and XII or at the graduate or post graduate level. The applicants of BCTA 2011 and 2012 (excluding the winners) are also eligible to participate in BCTA 2013. The nominations for the entries are classified in five distinct award categories: Best Chemistry Teacher (Class XI/XII and equivalent) Best Chemistry Teacher (Bachelor's degree and equivalent) Best Chemistry Teacher (Master's degree and above) Best Chemistry Teacher for promotion of Chemistry as a subject and Best Young Chemistry Teacher.
Commenting on this initiative R Mukundan managing director Tata Chemicals stated "With the tremendous nationwide response received in the past we are excited to launch the third series of the award. The BCTA awards recognise the efforts of teachers who are responsible in creating awareness and educating the younger generation about the intrinsic presence of chemistry in everyday life and its role in meeting modern day challenges. We at Tata Chemicals believe that chemistry is fundamental to the sustainable development of human society and this is in line with our mission of Serving Society through Science."
Tata Chemicals has created an interactive website called the Human Touch of Chemistry (www.humantouchofchemistry.com) wherein interested and eligible teachers can send in their nominations online for awards in the above-mentioned categories.
The winners for the awards will be selected by eminent panelists comprising renowned Indian scientists professionals and academia. The winner teachers will be felicitated at a formal award ceremony which will be announced in November 2013.
TATA CHEMICALS
CONSOLIDATED INCOME FROM OPERATIONS FOR Q1 FY13-14 AT RS.33120.000 MILLIONS UP
BY 8 PERCENT
August 05 2013
PAT at Rs.750.000 Millions
Q1 FY13-14
consolidated financial highlights
- Income from operations at Rs. 33120.000 Millions
- Profit from operations at Rs.4110.000 Millions
- PBT at Rs.1610.000 Millions
- PAT at Rs.75 0.000Millions
- EPS at Rs.2.95 (not annualised)
Q1 FY13-14 standalone
financial highlights
- Income from operations at Rs.16920.000 Millions
- Profit from operations at Rs.2130.000 Millions
- PBT at Rs.1310.000 Millions
- PAT at Rs.1000.000 Millions
- EPS at Rs.3.94 (not annualised)
Q4 FY13 standalone
financial highlights
- Domestic chemicals business registers. healthy sales volumes in most products realisations stable
- Consumer products business performance on expected lines
- Global chemicals performance impacted due to softening demand lower realisations and plant stoppages
- Haldia production suffers. due to non-availability of phos acid in Q1
- Agri and trading fertiliser business volumes impacted due to volatile exchange rates
- Rallis EBITDA up at 12 percent due to improved performance of Metahelix
Financial performance
highlights
- Subsidy receivable at Rs.11600.000 Millions as on June 30 2013 compared to Rs.17530.000 Millions on March 31 2013
- Subsidy collections likely to face pressure in the coming quarters
- ECB USD 475 million: the third instalment of USD 95 million repaid in June 2013
Commenting on the company's Q1 FY13-14 performance R Mukundan managing director said:"Overall for the quarter domestic businesses showed decent performance with the chemicals and consumer business portfolio registering satisfactory numbers. Fertilisers and agri-business had an adverse impact of foreign exchange volatility and raw material shortages. International entities are challenged with issues of softening demand lower realisations plant stoppages and increasing energy prices.
Consumer-facing business continued its progressive journey with i-Shakti pulses registering 79 percent growth in sales compared with the same period last year. Tata Swach sales picked up during the quarter impressively.
We remain cautious on the global demand scenario going forward domestically as well as internationally and while prices may remain at the same levels margins remain under pressure. Subsidy outstanding has come down as compared to March 2013 levels but will continue to remain challenged in the balance portion of the year.
The implementation of the nutritional solutions plant in Chennai is on schedule. On the strategic front we continue to focus on building the specialty chemicals and consumer business portfolio."
Business-wise
performance
Living essentials
- Tata Salt sales up by 3.4 percent
- TCL salt franchisee market leader with 65.2 percent market share in the national branded salt segment
- Launched operation 'Vistaar' to enhance retail penetration for i-Shakti pulses
Industry essentials
- Global soda ash demand as well as realisations stable
- Domestic soda ash demand stable and prices improving
- Soda ash production in Europe impacted due to delayed turn-down
- Magadi production marginally impacted due to power interruption
- Production at Tata Chemicals North America on expected lines
Farm essentials
- Urea production in line with expectation. Q1 experienced higher urea imports. Global urea prices down. Will have to watch the next few quarters
- Neem-coated urea accounted for 35.7 percent of total urea production. SSP production higher than expectation
- DAP/NPK production impacted due to clarity on subsidies and raw material stoppages
- In Q1 FY14 Rallis registered 20 percent growth in revenue — net sales at Rs.4090.000 Millions — a new milestone. Net profit at Rs.270.000 Millions up by 14 percent
- IMACID resumed production in May 2013 post shut down. Production on expected lines
CMT REPORT (Corruption Money Laundering & Terrorism]
The Public Notice information has been collected from various sources
including but not limited to: The Courts
1] INFORMATION ON
DESIGNATED PARTY
No exist designating subject or any of its beneficial owners controlling
shareholders or senior officers as terrorist or terrorist organization or whom
notice had been received that all financial transactions involving their assets
have been blocked or convicted found guilty or against whom a judgement or
order had been entered in a proceedings for violating money-laundering
anti-corruption or bribery or international economic or anti-terrorism sanction
laws or whose assets were seized blocked frozen or ordered forfeited for
violation of money laundering or international anti-terrorism laws.
2] Court Declaration :
No exist to suggest that subject is or was
the subject of any formal or informal allegations prosecutions or other
official proceeding for making any prohibited payments or other improper
payments to government officials for engaging in prohibited transactions or
with designated parties.
3] Asset Declaration :
No records exist to suggest that the property or assets of the subject
are derived from criminal conduct or a prohibited transaction.
4] Record on Financial
Crime :
Charges or conviction
registered against subject: None
5] Records on Violation of
Anti-Corruption Laws :
Charges or
investigation registered against subject: None
6] Records on Int’l
Anti-Money Laundering Laws/Standards :
Charges or
investigation registered against subject: None
7] Criminal Records
No
available information exist that suggest that subject or any of its principals
have been formally charged or convicted by a competent governmental authority
for any financial crime or under any formal investigation by a competent
government authority for any violation of anti-corruption laws or international
anti-money laundering laws or standard.
8] Affiliation with
Government :
No record
exists to suggest that any director or indirect owners controlling shareholders
director officer or employee of the company is a government official or a
family member or close business associate of a Government official.
9] Compensation Package :
Our market
survey revealed that the amount of compensation sought by the subject is fair
and reasonable and comparable to compensation paid to others for similar
services.
10] Press Report :
No press reports / filings exists on
the subject.
CORPORATE GOVERNANCE
MIRA INFORM as part of its Due Diligence do provide comments on
Corporate Governance to identify management and governance. These factors often
have been predictive and in some cases have created vulnerabilities to credit
deterioration.
Our Governance Assessment focuses principally on the interactions
between a company’s management its Board of Directors Shareholders and other
financial stakeholders.
CONTRAVENTION
Subject is not known to have contravened any existing local laws
regulations or policies that prohibit restrict or otherwise affect the terms
and conditions that could be included in the agreement with the subject.
FOREIGN EXCHANGE RATES
|
Currency |
Unit
|
Indian Rupees |
|
US Dollar |
1 |
Rs.60.27 |
|
|
1 |
Rs.101.10 |
|
Euro |
1 |
Rs.83.74 |
INFORMATION DETAILS
|
Information
Gathered by : |
PRT |
|
|
|
|
Analysis Done by
: |
KAR |
|
|
|
|
Report Prepared
by : |
DPH |
SCORE & RATING EXPLANATIONS
|
SCORE FACTORS |
RANGE |
POINTS |
|
HISTORY |
1~10 |
8 |
|
PAID-UP CAPITAL |
1~10 |
8 |
|
OPERATING SCALE |
1~10 |
8 |
|
FINANCIAL CONDITION |
|
|
|
--BUSINESS SCALE |
1~10 |
8 |
|
--PROFITABILIRY |
1~10 |
8 |
|
--LIQUIDITY |
1~10 |
8 |
|
--LEVERAGE |
1~10 |
8 |
|
--RESERVES |
1~10 |
8 |
|
--CREDIT LINES |
1~10 |
8 |
|
--MARGINS |
-5~5 |
- |
|
DEMERIT POINTS |
|
|
|
--BANK CHARGES |
YES/NO |
YES |
|
--LITIGATION |
YES/NO |
YES |
|
--OTHER ADVERSE INFORMATION |
YES/NO |
NO |
|
MERIT POINTS |
|
|
|
--SOLE DISTRIBUTORSHIP |
YES/NO |
NO |
|
--EXPORT ACTIVITIES |
YES/NO |
NO |
|
--AFFILIATION |
YES/NO |
YES |
|
--LISTED |
YES/NO |
YES |
|
--OTHER MERIT FACTORS |
YES/NO |
YES |
|
DEFAULTER |
|
|
|
--RBI |
YES/NO |
NO |
|
--EPF |
YES/NO |
NO |
|
|
|
|
|
TOTAL |
|
72 |
This score serves as a reference to assess SC’s
credit risk and to set the amount of credit to be extended. It is calculated
from a composite of weighted scores obtained from each of the major sections of
this report. The assessed factors and their relative weights (as indicated
through %) are as follows:
Financial
condition (40%) Ownership
background (20%) Payment
record (10%)
Credit history
(10%) Market trend (10%) Operational size
(10%)
RATING EXPLANATIONS
|
RATING |
STATUS |
PROPOSED CREDIT LINE |
|
|
>86 |
Aaa |
Possesses an extremely
sound financial base with the strongest capability for timely payment of
interest and principal sums |
Unlimited |
|
71-85 |
Aa |
Possesses adequate
working capital. No caution needed for credit transaction. It has above
average (strong) capability for payment of interest and principal sums |
Large |
|
56-70 |
A |
Financial &
operational base are regarded healthy. General unfavourable factors will not
cause fatal effect. Satisfactory capability for payment of interest and principal
sums |
Fairly
Large |
|
41-55 |
Ba |
Overall operation is
considered normal. Capable to meet normal commitments. |
Satisfactory |
|
26-40 |
B |
Capability to overcome
financial difficulties seems comparatively below average. |
Small |
|
11-25 |
Ca |
Adverse factors are
apparent. Repayment of interest and principal sums in default or expected to
be in default upon maturity |
Limited
with full security |
|
<10 |
C |
Absolute credit risk
exists. Caution needed to be exercised |
Credit
not recommended |
|
-- |
NB |
New
Business |
-- |
This report is issued at your request without any
risk and responsibility on the part of MIRA INFORM PRIVATE LIMITED (MIPL)
or its officials.