1. Summary Information
|
Country |
India |
||
|
Company Name |
AUROBINDO PHARMA LIMITED |
Principal Name 1 |
Mr. P.V. Ramprasad Reddy |
|
Status |
Good |
Principal Name 2 |
Mr. K. Nityananda Reddy |
|
Registration # |
01-015190 |
||
|
Street Address |
Plot No. 2, Maithri Vihar, Behind Maithri Vanam, Ameerpet,
|
||
|
Established Date |
26.12.1986 |
SIC Code |
-- |
|
Telephone# |
91-40-23741083 |
Business Style 1 |
Manufacturer |
|
Fax # |
91-40-23746833 |
Business Style 2 |
- |
|
Homepage |
Product Name 1 |
Bulk Drugs |
|
|
# of employees |
8635 (Approximately) |
Product Name 2 |
Formulations |
|
Paid up capital |
Rs.291,200,000/-
|
Product Name 3 |
Tablets and Capsules |
|
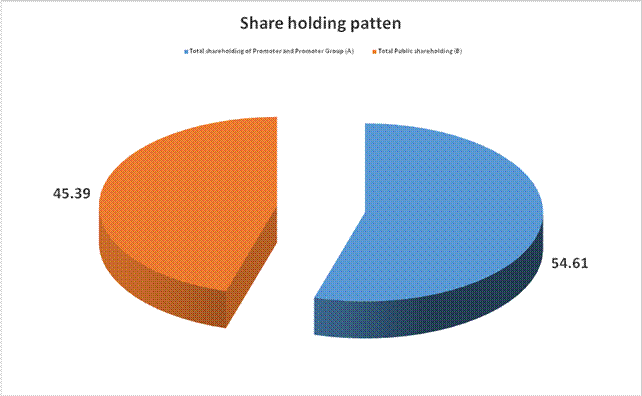
Shareholders |
Shareholding of
Promoter and Promoter Group 54.61%, Public Shareholding 45.39% |
Banking |
Andhra Bank |
|
Public Limited Corp. |
Yes |
Business Period |
28 Years |
|
IPO |
Yes |
International Ins. |
- |
|
Public |
Yes |
Rating |
Ba (52) |
|
Related
Company |
|||
|
Relation
|
Country
|
Company
Name |
CEO |
|
Subsidiary
|
China
|
ALL Pharma (Shanghai) Trading Company
Limited |
-- |
|
Note |
- |
||
2. Summary
Financial Statement
|
Balance Sheet as of |
31.03.2013 |
(Unit: Indian Rs.) |
|
|
Assets |
Liabilities |
||
|
Current Assets |
25,066,100,000 |
Current Liabilities |
9,693,200,000 |
|
Inventories |
14,317,300,000 |
Long-term Liabilities |
27,749,600,000 |
|
Fixed Assets |
20,119,100,000 |
Other Liabilities |
1,411,900,000 |
|
Deferred Assets |
0,000 |
Total Liabilities |
38,854,700,000 |
|
Invest& other Assets |
8,743,200,000 |
Retained Earnings |
29,099,800,000 |
|
|
|
Net Worth |
29,391,000,000 |
|
Total Assets |
68,245,700,000 |
Total Liab. & Equity |
68,245,700,000 |
|
Total Assets (Previous Year) |
59,912,100,000 |
|
|
|
P/L Statement as of |
31.03.2013 |
(Unit: Indian Rs.) |
|
|
Sales/ Total Income |
54,251,000,000 |
Net Profit |
4,959,900,000 |
|
Sales(Previous yr)/ Total Income |
42,814,500,000 |
Net Profit(Prev.yr) |
(426,100,000) |
MIRA INFORM REPORT
|
Report Date : |
17.04.2014 |
IDENTIFICATION DETAILS
|
Name : |
AUROBINDO PHARMA LIMITED |
|
|
|
|
Registered
Office : |
Plot No. 2, Maithri Vihar, Behind Maithri Vanam, Ameerpet,
|
|
|
|
|
Country : |
India |
|
|
|
|
Financials (as
on) : |
31.03.2013 |
|
|
|
|
Date of
Incorporation : |
26.12.1986 |
|
|
|
|
Com. Reg. No.: |
01-015190 |
|
|
|
|
Capital
Investment / Paid-up Capital : |
Rs.291.200
Millions |
|
|
|
|
CIN No.: [Company Identification
No.] |
L24239AP1986PLC015190 |
|
|
|
|
TAN No.: [Tax Deduction &
Collection Account No.] |
HYDA01477A |
|
|
|
|
Legal Form : |
A Public Limited Liability Company. The company’s Shares are Listed on
the Stock Exchange. |
|
|
|
|
Line of Business
: |
Manufacturing and Marketing Bulk Drugs, Formulations, Tablets and
Capsules, Syrups and Injectiables. |
|
|
|
|
No. of Employees
: |
8800 (Approximately) |
RATING & COMMENTS
|
MIRA’s Rating : |
Ba (52) |
|
RATING |
STATUS |
PROPOSED CREDIT LINE |
|
|
41-55 |
Ba |
Overall operation is considered normal. Capable to meet normal
commitments. |
Satisfactory |
|
Maximum Credit Limit : |
USD 110000000 |
|
|
|
|
Status : |
Good |
|
|
|
|
Payment Behaviour : |
Regular |
|
|
|
|
Litigation : |
Exist |
|
|
|
|
Comments : |
Subject is a well-established company having a fine track record. The company has recovered its financial losses and it has achieved
decent growth in its profitability during the financial year 2013. General
financial position of the company seems to be sound and healthy. Trade relations are reported as fair. Business is active. Payments are
reported to be regular and as per commitments. The company can be considered good for business dealings at usual
trade terms and conditions. |
NOTES :
Any query related to this report can be made
on e-mail : infodept@mirainform.com
while quoting report number, name and date.
ECGC Country Risk Classification List – March 31, 2014
|
Country Name |
Previous Rating (31.12.2013) |
Current Rating (31.03.2014) |
|
India |
A1 |
A1 |
|
Risk Category |
ECGC
Classification |
|
Insignificant |
A1 |
|
Low |
A2 |
|
Moderate |
B1 |
|
High |
B2 |
|
Very High |
C1 |
|
Restricted |
C2 |
|
Off-credit |
D |
INDIAN ECONOMIC OVERVIEW
US investment bank
Goldman Sachs has upgraded its outlook on Indian markets as it expects
positive impact of the election cycle.
India’s economy may
grow 4.7 % in the current financial year, lower than the official estimate of
4.9 %, Fitch Rating said. The global rating agency expects the economy to pick
up in the next two financial years.
Global ratings
agency Standard & Poor said increasing focus by India Inc on lowering debt
is likely to improve their credit profiles.
Singapore (1.1
million Indian tourists in 2012), Thailand (one million), the United Arab
Emirates ().98 million) and Malaysia ().82 million) emerged as the preferred
holidays hotspots for Indians. The total figure is expected to increase to 1.93
million by 2017, according to the latest Eurmonitor international report.
There is a $29.34 bn
outward foreign direct investment by domestic companies between April and
January of 2013/14 which has seen some signs of recovery according to a Care
Ratings report.
There are 264 number
of new companies being set up every day on average during 2014. Most of them
are registered in Mumbai. India had 1.38 million registered companies at the
end of January, 2014.
Twitter like
messaging service Weibo Corporation has filed to raise $ 500 million via a US
initial public offering. Alibaba, which owns a stake in Weibo is expected to
raise about $ 15 billion New York this year in the highest profile Internet IPO
since Facebook’s in 2012.
Bharti Airtel has
raised Rs.2,453.2 crore (350 million Swiss Francs) by selling six-year bonds at
a coupon rate of three per cent and maturing in 2020. This is the largest ever
bond offering by an Indian company in Swiss Francs. Bharat Petroleum
Corporation raised 175 million Swiss Francs by selling five year bonds at 2.98
% coupon rate in February.
Indian Oil
Corporation plans to invest Rs 7650 crore in setting up a petrochemical complex
at its almost complete Paradip refinery in Odhisha in three to four years. The
company board is set to consider the setting up of a 700000 tonne per annum
polypropylene plant at an estimated cost at Rs.3150 crore.
Global chief
information officers at gathering in Bangalore in April to meet Indian startups
at an event called Tech50 Watchout for Little Eye Labs-Facebook type deals in
the making.
RBI DEFAULTERS’ LIST STATUS
Subject’s name is not enlisted as a defaulter
in the publicly available RBI Defaulters’ list.
EPF (EMPLOYEE PROVIDENT FUND) DEFAULTERS’ LIST STATUS
Subject’s name is not enlisted as a defaulter
in the publicly available EPF (Employee Provident Fund) Defaulters’ list as of
31-03-2012.
INFORMATION DECLINED
Management Non Cooperative (91-40-66725401)
LOCATIONS
|
Registered Office/
Corporate Office : |
Plot No. 2, Maithri Vihar, Behind Maithri Vanam, Ameerpet,
|
|
Tel. No.: |
91-40-23741083 / 23741084 / 23744919 / 66725000 / 66725401 |
|
Fax No.: |
91-40-23746833 / 23741080 / 23748112 |
|
E-Mail : |
|
|
Website : |
|
|
|
|
|
Corporate Office : |
Water Mark Building, Plot No.11, Survey No.9, Kondapur, Hitech City, Hyderabad - 500 084, Andhra Pradesh, India. |
|
Tel. No.: |
91-40-66725000 |
|
Fax No.: |
91-40-23741080 / 23746833 |
|
|
|
|
Factory 1 : |
Survey No.379,385,386,388 to 396 and 269, Borpatla, Hatnoor Mandal, Medak District, 502 296, Andhra Pradesh, India |
|
|
|
|
Factory 2 : |
Plot No.103/A and 104/A, SVCIE, Industrial Development Area, Bollaram, Jinnaram (Mandal) Medak District, 500 092, Andhra Pradesh, India |
|
|
|
|
Factory 3 : |
Survey No.313 and 314 Bachupally, Quthubullapur Mandal, Range Reddy District, 500 090, Andhra Pradesh, India |
|
|
|
|
Factory 4 : |
Plot No.4 in Survey No.151 and Plot Nos.34 to 48 in Survey No. part of 146, 150, 151, 152, 153 and 154 situated in Phase-III, SPIIC, EPIP, IDA, Pashamylaram, Patancheru Mandal, Medak District, 502 307, Andhra Pradesh, India |
|
|
|
|
Factory 5 : |
Plot No.68 to 70, 73 to 91, 95, 96, 260 and 261 Industrial Development Area, Chemical Zone, Pashamylaram, Patancheru Mandal, Medak District, 502 307, Andhra Pradesh, India |
|
|
|
|
Factory 6 : |
Survey No. 329/39 and 329/47, Chitkul Village, Patancheru Mandal, Medak District, 502 307, Andhra Pradesh, India |
|
|
|
|
Factory 7 : |
Sy.Nos.411/P, 425/P, 434/P, 435/P and 458/P, Plot No.S1(Part), Special Economic Zone (Pharma), APIIC, Green Industrial Park, Polepally Village, Jedcherla Mandal, Mahaboob Nagar, 509 302, Andhra Pradesh, India |
|
|
|
|
Factory 8 : |
Survey No.10 and 13, Gaddapothram, Industrial Development Area - Kazipally Industrial Area, Jinnaram Mandal, Medak District, 502 319, Andhra Pradesh, India |
|
|
|
|
Factory 9 : |
Survey No.369, 370 371 and 374, Gundlamachanoor, Hatnoora Mandal, Medak District, 502 296, Andhra Pradesh, India |
|
|
|
|
Factory 10 : |
Survey No.61-66, Industrial Development Area, Pydibhimavaram, Ranasthalam Mandal, Srikakulam, 532 409, Andhra Pradesh, India |
|
|
|
|
Factory 11 : |
Survey No.314, Bachupally, Quthubullapur Mandal, Range Reddy District, 500 090, Andhra Pradesh, India |
|
|
|
|
Factory 12 : |
JN Pharma City, Road No.10,11 and 19, 20, E Bonangi Village, Parawada, Visakhapatnam District, 531 021, Andhra Pradesh, India |
|
|
|
|
Factory 13 : |
1128, RIICO
Phase-III, Bhiwadi, 301 019, Rajasthan, India (Sub-leased to Auronext Pharma
Private Limited, a subsidiary of the Company) |
|
|
|
|
APLRC – I |
Survey No.313 and 314 Bachupally, Quthubullapur Mandal,
Ranga Reddy District - 500 090, |
|
|
|
|
APLRC - II |
Survey No.71 and 72, 502203, |
DIRECTORS
As on: 31.03.2013
|
Name : |
Mr. K. Ragunathan |
|
Designation : |
Non-executive Director |
|
Date of Birth/Age : |
50 Years |
|
Experience : |
28 years |
|
|
|
|
Name : |
Mr. K. Nityananda Reddy |
|
Designation : |
Managing Director |
|
Date of Birth/Age : |
55 Years |
|
Qualification : |
Masters Degree in Science (Organic Chemistry) |
|
|
|
|
Name : |
Mr. N. Govindarajan, |
|
Designation : |
Managing Director |
|
Date of Birth/Age : |
45 Years |
|
Qualification : |
B.E. (Mechanical) |
|
|
|
|
Name : |
Dr. M. Sivakumaran |
|
Designation : |
Whole-Time Director |
|
Date of Birth/Age : |
70 Years |
|
Qualification : |
Masters Degree in Science |
|
Experience : |
40 years |
|
|
|
|
Name : |
Mr. M. Madan Mohan Reddy |
|
Designation : |
Whole-Time Director |
|
Date of Birth/Age : |
53 Years |
|
Qualification : |
Masters Degree in Science (Organic
Chemistry) |
|
|
|
|
Name : |
Mr. P.V. Ramprasad Reddy |
|
Designation : |
Chairman |
|
Date of Birth/Age : |
55 Years |
|
Qualification : |
Post-Graduate |
|
|
|
|
Name : |
Mr. P. Sarath Chandra
Reddy |
|
Designation : |
Non-Executive Director |
|
Date of Birth/Age : |
28 Yeas |
|
Qualification : |
Graduate in Business Administration |
|
|
|
|
Name : |
Mr. M. Sitarama Murthy |
|
Designation : |
Non-Executive Director |
|
Date of Birth/Age : |
53 Years |
|
Qualification : |
Masters in Electronics |
|
|
|
|
Name : |
Dr. D. Rajagopala Reddy |
|
Designation : |
Non-Executive Director |
|
Date of Birth/Age : |
54 Years |
|
Qualification : |
Master's Degree in Science |
|
|
|
|
Name : |
Dr. C. Channa Reddy |
|
Designation : |
Non-Executive Director |
|
Date of Birth/Age : |
68 Years |
KEY EXECUTIVES
|
Name : |
Mr. Sudhir B Singhi |
|
Designation : |
Chief Financial Officer |
|
|
|
|
Name : |
Mr. A. Mohan Rami Reddy |
|
Designation : |
Company Secretary |
SHAREHOLDING PATTERN
As on: 31.03.2014
|
Category of
Shareholder |
Total
No. of Shares |
Total
Shareholding as a % of Total No. of Shares |
|
(A) Shareholding of Promoter and Promoter Group |
|
|
|
|
|
|
|
|
150483428 |
51.63 |
|
|
8692358 |
2.98 |
|
|
159175786 |
54.61 |
|
|
|
|
|
Total shareholding of Promoter and Promoter Group (A) |
159175786 |
54.61 |
|
(B) Public Shareholding |
|
|
|
|
|
|
|
|
28326301 |
9.72 |
|
|
333116 |
0.11 |
|
|
52951 |
0.02 |
|
|
69177453 |
23.74 |
|
|
97889821 |
33.59 |
|
|
|
|
|
|
6117790 |
2.10 |
|
|
|
|
|
|
18867331 |
6.47 |
|
|
7654704 |
2.63 |
|
|
100 |
0.00 |
|
|
1751489 |
0.60 |
|
|
843895 |
0.29 |
|
|
899722 |
0.31 |
|
|
7872 |
0.00 |
|
|
34391414 |
11.80 |
|
Total Public shareholding (B) |
132281235 |
45.39 |
|
Total (A)+(B) |
291457021 |
100.00 |
|
(C) Shares held by Custodians and against which Depository
Receipts have been issued |
0 |
0.00 |
|
|
0 |
0.00 |
|
|
0 |
0.00 |
|
|
0 |
0.00 |
|
Total (A)+(B)+(C) |
291457021 |
0.00 |
BUSINESS DETAILS
|
Line of Business : |
Manufacturing and Marketing Bulk Drugs, Formulations, Tablets and
Capsules, Syrups and Injectiables. |
GENERAL INFORMATION
|
No. of Employees : |
8800 (Approximately) |
||||||||||||||||||||||||||||||
|
|
|
||||||||||||||||||||||||||||||
|
Bankers : |
|
||||||||||||||||||||||||||||||
|
|
|
||||||||||||||||||||||||||||||
|
Facilities : |
(Rs.
In Millions)
|
||||||||||||||||||||||||||||||
|
|
|
|
Banking
Relations : |
-- |
|
|
|
|
Auditors : |
|
|
Statutory
Auditors : |
|
|
Name : |
S R Batliboi and Company Chartered Accountants |
|
Address : |
Oval Office, 18 iLabs Centre, Hi-tech City, Madhapur, Hyderabad – 500081, Andhra Pradesh, India |
|
Internal
Auditors : |
|
|
Name : |
KPMG Chartered Accountants |
|
Address : |
1st Floor, Lodha Excelus, Apollo Mills Compound, N M Joshi
Marg, Mahalakshmi, Mumbai – 400 011, |
|
|
|
|
Subsidiaries : |
|
|
|
|
|
Joint ventures : |
|
|
|
|
|
Enterprises over which
key management personnel or their relatives exercise significant influence : |
|
CAPITAL STRUCTURE
As on: 31.03.2013
Authorised Capital :
|
No. of Shares |
Type |
Value |
Amount |
|
|
|
|
|
|
660,000,000 |
Equity Shares |
Rs.1/- each |
Rs.660.000 Millions |
|
|
|
|
|
Issued, Subscribed & Paid-up Capital :
|
No. of Shares |
Type |
Value |
Amount |
|
|
|
|
|
|
291211290 |
Equity Shares |
Rs.1/- each |
Rs.291.200
Millions |
|
|
|
|
|
Reconciliation of the
equity shares outstanding at the beginning and at the end of the year
(Rs. in Millions)
|
|
As at March 31, 2013 |
|
|
|
Numbers |
Value |
|
Equity shares |
|
|
|
At the beginning of the year |
291,121,290 |
291.1 |
|
Issued during the year under employee stock option plan |
90,000 |
0.1 |
|
Outstanding at the end of the year |
291,211,290 |
291.2 |
Terms/rights attached
to equity shares
The Company has only one class of equity shares having as par values of Rs.1 per share. Each holder of equity shares is entitled to one vote per share.
The Company declares and pays dividends in Indian rupees. The dividend proposed by the Board of Directors is subject to the approval of shareholders in the ensuing Annual General Meeting.
During the year ended March 31, 2013, the amount of dividend per share recognized as distributions to equity shareholders was Rs.1.5 (March 31, 2012: Rs.1) including interim dividend of Rs.1 (March 31, 2012: Nil).
In the event of liquidation of the Company, the holders of equity shares will be entitled to receive remaining assets of the Company, after distribution of all preferential amounts. However, no such preferential amounts exist currently. The distribution will be in proportion to the number of equity shares held by the shareholders.
Details of
shareholders holding more than 5% equity shares in the Company
|
|
As at March 31, 2013 |
|
|
|
Number |
% holding |
|
Mr. P.V. Ramprasad Reddy |
19,481,440 |
6.69 |
|
Mrs. P. Suneela Rani |
90,830,550 |
31.19 |
|
TOTAL |
110,311,990 |
37.88 |
As per of the Company, including its register of shareholders/members and other declarations received from shareholders regarding beneficial interest, the above shareholding represents both legal and beneficial ownerships of shares.
For details of shares reserved for issue under Employee
Stock Option Plan (ESOP) of the Company, Refer Note 31.
FINANCIAL DATA
[all figures are
in Rupees Millions]
ABRIDGED BALANCE
SHEET
|
SOURCES OF FUNDS |
|
|
31.03.2013 |
|
I.
EQUITY
AND LIABILITIES |
|
|
|
|
(1)Shareholders' Funds |
|
|
|
|
(a) Share Capital |
|
|
291.200 |
|
(b) Reserves & Surplus |
|
|
29099.800 |
|
(c) Money
received against share warrants |
|
|
0.000 |
|
|
|
|
|
|
(2) Share Application money pending allotment |
|
|
0.000 |
|
Total
Shareholders’ Funds (1) + (2) |
|
|
29391.000 |
|
|
|
|
|
|
(3)
Non-Current Liabilities |
|
|
|
|
(a) long-term borrowings |
|
|
10410.600 |
|
(b) Deferred tax liabilities (Net) |
|
|
679.400 |
|
(c) Other long term
liabilities |
|
|
0.000 |
|
(d) long-term
provisions |
|
|
85.000 |
|
Total Non-current
Liabilities (3) |
|
|
11175.000 |
|
|
|
|
|
|
(4) Current Liabilities |
|
|
|
|
(a) Short term
borrowings |
|
|
17339.000 |
|
(b) Trade payables |
|
|
9012.800 |
|
(c) Other current
liabilities |
|
|
680.400 |
|
(d) Short-term
provisions |
|
|
647.500 |
|
Total Current
Liabilities (4) |
|
|
27679.700 |
|
|
|
|
|
|
TOTAL |
|
|
68245.700 |
|
|
|
|
|
|
II.
ASSETS |
|
|
|
|
(1) Non-current assets |
|
|
|
|
(a) Fixed Assets |
|
|
|
|
(i) Tangible assets |
|
|
20119.100 |
|
(ii) Intangible Assets |
|
|
0.000 |
|
(iii) Capital
work-in-progress |
|
|
1663.400 |
|
(iv)
Intangible assets under development |
|
|
0.000 |
|
(b) Non-current Investments |
|
|
7079.400 |
|
(c) Deferred tax assets (net) |
|
|
0.000 |
|
(d) Long-term Loan and Advances |
|
|
2891.000 |
|
(e) Other
Non-current assets |
|
|
185.800 |
|
Total Non-Current
Assets |
|
|
31938.700 |
|
|
|
|
|
|
(2) Current assets |
|
|
|
|
(a) Current investments |
|
|
0.400 |
|
(b) Inventories |
|
|
14317.300 |
|
(c) Trade receivables |
|
|
17305.900 |
|
(d) Cash and cash
equivalents |
|
|
1145.700 |
|
(e) Short-term loans
and advances |
|
|
2759.800 |
|
(f) Other current
assets |
|
|
777.900 |
|
Total Current Assets |
|
|
36307.000 |
|
|
|
|
|
|
TOTAL |
|
|
68245.700 |
|
SOURCES OF FUNDS |
|
31.03.2012 |
31.03.2011 |
|
|
SHAREHOLDERS FUNDS |
|
|
|
|
|
1] Share Capital |
|
291.100 |
291.100 |
|
|
2] Share Application Money |
|
0.000 |
0.000 |
|
|
3] Reserves & Surplus |
|
24640.600 |
25405.000 |
|
|
4] (Accumulated Losses) |
|
0.000 |
0.000 |
|
|
NETWORTH |
|
24931.700 |
25696.100 |
|
|
LOAN FUNDS |
|
|
|
|
|
1] Secured Loans |
|
14930.300 |
10380.100 |
|
|
2] Unsecured Loans |
|
9489.200 |
6578.400 |
|
|
TOTAL BORROWING |
|
24419.500 |
16958.500 |
|
|
DEFERRED TAX LIABILITIES |
|
37.900 |
1218.200 |
|
|
|
|
|
|
|
|
TOTAL |
|
49389.100 |
43872.800 |
|
|
|
|
|
|
|
|
APPLICATION OF FUNDS |
|
|
|
|
|
|
|
|
|
|
|
FIXED ASSETS [Net Block] |
|
16267.400 |
13498.900 |
|
|
Capital work-in-progress |
|
5580.800 |
5367.300 |
|
|
|
|
|
|
|
|
INVESTMENT |
|
6290.000 |
4930.800 |
|
|
DEFERREX TAX ASSETS |
|
0.000 |
0.000 |
|
|
|
|
|
|
|
|
CURRENT ASSETS, LOANS & ADVANCES |
|
|
|
|
|
|
Inventories |
|
12192.600
|
12610.200
|
|
|
Sundry Debtors |
|
14262.800
|
14802.900
|
|
|
Cash & Bank Balances |
|
140.100
|
1222.100
|
|
|
Other Current Assets |
|
768.700
|
264.300
|
|
|
Loans & Advances |
|
4409.700
|
5715.200
|
|
Total
Current Assets |
|
31773.900
|
34614.700
|
|
|
Less : CURRENT
LIABILITIES & PROVISIONS |
|
|
|
|
|
|
Sundry Creditor |
|
5848.500
|
7331.400
|
|
|
Other Current Liabilities |
|
4057.800
|
6633.300
|
|
|
Provisions |
|
616.700
|
574.200
|
|
Total
Current Liabilities |
|
10523.000
|
14538.900
|
|
|
Net Current Assets |
|
21250.900
|
20075.800
|
|
|
|
|
|
|
|
|
MISCELLANEOUS EXPENSES |
|
0.000 |
0.000 |
|
|
|
|
|
|
|
|
TOTAL |
|
49389.100 |
43872.800 |
|
PROFIT & LOSS
ACCOUNT
|
|
PARTICULARS |
31.03.2013 |
31.03.2012 |
31.03.2011 |
|
|
|
SALES |
|
|
|
|
|
|
|
Income |
54251.000 |
42814.500 |
41331.200 |
|
|
|
Other Income |
265.100 |
190.600 |
570.100 |
|
|
|
TOTAL (A) |
54516.100 |
43005.100 |
41901.300 |
|
|
|
|
|
|
|
|
Less |
EXPENSES |
|
|
|
|
|
|
|
Cost of materials consumed |
30536.400 |
23932.900 |
23286.300 |
|
|
|
Purchase of traded goods |
780.900 |
355.200 |
85.300 |
|
|
|
(Increase)/decrease in work-in-progress, traded and finished goods |
(1210.800) |
898.700 |
(1363.800) |
|
|
|
Employee benefit expenses |
4314.200 |
3641.000 |
3036.000 |
|
|
|
Other expenses |
10249.700 |
8251.700 |
6715.300 |
|
|
|
Exceptional items |
0.000 |
3198.600 |
287.100 |
|
|
|
TOTAL (B) |
44670.400 |
40278.100 |
32046.200 |
|
|
|
|
|
|
|
|
Less |
PROFIT/
(LOSS) BEFORE INTEREST, TAX, DEPRECIATION AND AMORTISATION (A-B) (C) |
9845.700 |
2727.000 |
9855.100 |
|
|
|
|
|
|
|
|
|
Less |
FINANCIAL
EXPENSES (D) |
2500.600 |
2675.800 |
550.200 |
|
|
|
|
|
|
|
|
|
|
PROFIT/
(LOSS) BEFORE TAX, DEPRECIATION AND AMORTISATION (C-D) (E) |
7345.100 |
51.200 |
9304.900 |
|
|
|
|
|
|
|
|
|
Less/ Add |
DEPRECIATION/
AMORTISATION (F) |
1713.900 |
1429.400 |
1250.400 |
|
|
|
|
|
|
|
|
|
|
PROFIT/ (LOSS)
BEFORE TAX (E-F) (G) |
5631.200 |
(1378.200) |
8054.500 |
|
|
|
|
|
|
|
|
|
Less |
TAX (H) |
671.300 |
(952.100) |
2116.500 |
|
|
|
|
|
|
|
|
|
|
PROFIT/ (LOSS)
AFTER TAX (G-H) (I) |
4959.900 |
(426.100) |
5938.000 |
|
|
|
|
|
|
|
|
|
Add |
PREVIOUS
YEARS’ BALANCE BROUGHT FORWARD |
14797.100 |
15561.500 |
10900.900 |
|
|
|
|
|
|
|
|
|
Less |
APPROPRIATIONS |
|
|
|
|
|
|
|
Dividend on equity shares |
436.800 |
291.100 |
587.200 |
|
|
|
Tax on dividend |
72.000 |
47.200 |
96.400 |
|
|
|
General reserve |
496.000 |
0.000 |
593.800 |
|
|
BALANCE CARRIED
TO THE B/S |
18752.200 |
14797.100 |
15561.500 |
|
|
|
|
|
|
|
|
|
|
EARNINGS IN
FOREIGN CURRENCY |
|
|
|
|
|
|
|
Exports on F.O.B. basis |
38710.100 |
29239.900 |
26969.800 |
|
|
|
Interest |
14.200 |
16.600 |
32.700 |
|
|
|
Sale of dossiers/Services |
331.800 |
523.500 |
2320.700 |
|
|
TOTAL EARNINGS |
39056.100 |
29780.000 |
29323.200 |
|
|
|
|
|
|
|
|
|
|
IMPORTS |
|
|
|
|
|
|
|
Raw Materials and packing materials |
17845.800 |
13845.100 |
15061.500 |
|
|
|
Capital Goods |
349.100 |
730.400 |
827.400 |
|
|
|
Stores and spares and lab chemicals |
84.400 |
123.400 |
142.900 |
|
|
TOTAL IMPORTS |
18279.300 |
14698.900 |
16031.800 |
|
|
|
|
|
|
|
|
|
|
Earnings/ (Loss)
Per Share (Rs.) |
|
|
|
|
|
|
Basic |
17.04 |
(1.46) |
20.63 |
|
|
|
Diluted |
17.02 |
(1.46) |
18.56 |
|
KEY RATIOS
|
PARTICULARS |
|
31.03.2013 |
31.03.2012 |
31.03.2011 |
|
PAT / Total Income |
(%) |
9.10
|
(1.00)
|
14.17
|
|
|
|
|
|
|
|
Net Profit Margin (PBT/Sales) |
(%) |
10.38
|
(3.22)
|
19.49
|
|
|
|
|
|
|
|
Return on Total Assets (PBT/Total Assets} |
(%) |
9.46
|
(2.87)
|
16.74
|
|
|
|
|
|
|
|
Return on Investment (ROI) (PBT/Networth) |
|
0.19
|
(0.06)
|
0.31
|
|
|
|
|
|
|
|
Debt Equity Ratio (Total Debt /Networth) |
|
0.94
|
0.98 |
0.66 |
|
|
|
|
|
|
|
Current Ratio (Current Asset/Current Liability) |
|
1.31
|
3.02
|
2.38
|
FINANCIAL ANALYSIS
[all figures are
in Rupees Millions]
YEAR-ON-YEAR GROWTH
|
Year
on Year Growth |
31.03.2011 |
31.03.2012 |
31.03.2013 |
|
|
(Rs.
In Millions) |
(Rs.
In Millions) |
(Rs.
In Millions) |
|
Sales |
41331.200 |
42814.500 |
54251.000 |
|
|
|
3.589 |
26.712 |
NET PROFIT MARGIN
|
Net
Profit Margin |
31.03.2011 |
31.03.2012 |
31.03.2013 |
|
|
(Rs.
In Millions) |
(Rs.
In Millions) |
(Rs.
In Millions) |
|
Sales |
41331.200 |
42814.500 |
54251.000 |
|
Profit |
5938.000 |
(426.100) |
4959.900 |
|
|
14.37% |
(1.00%) |
9.14% |
LOCAL AGENCY FURTHER INFORMATION
|
Sr. No. |
Check List by Info
Agents |
Available in Report (Yes / No) |
|
1] |
Year of Establishment |
Yes |
|
2] |
Locality of the firm |
Yes |
|
3] |
Constitutions of the firm |
Yes |
|
4] |
Premises details |
No |
|
5] |
Type of Business |
Yes |
|
6] |
Line of Business |
Yes |
|
7] |
Promoter's background |
Yes |
|
8] |
No. of employees |
Yes |
|
9] |
Name of person contacted |
No |
|
10] |
Designation of contact person |
No |
|
11] |
Turnover of firm for last three years |
Yes |
|
12] |
Profitability for last three years |
Yes |
|
13] |
Reasons for variation <> 20% |
---------------------- |
|
14] |
Estimation for coming financial year |
No |
|
15] |
Capital in the business |
Yes |
|
16] |
Details of sister concerns |
Yes |
|
17] |
Major suppliers |
No |
|
18] |
Major customers |
No |
|
19] |
Payments terms |
No |
|
20] |
Export / Import details (if applicable) |
No |
|
21] |
Market information |
---------------------- |
|
22] |
Litigations that the firm / promoter involved in |
Yes |
|
23] |
Banking Details |
Yes |
|
24] |
Banking facility details |
Yes |
|
25] |
Conduct of the banking account |
---------------------- |
|
26] |
Buyer visit details |
---------------------- |
|
27] |
Financials, if provided |
Yes |
|
28] |
Incorporation details, if applicable |
Yes |
|
29] |
Last accounts filed at ROC |
Yes |
|
30] |
Major Shareholders, if available |
Yes |
|
31] |
Date of Birth of Proprietor/Partner/Director, if available |
Yes |
|
32] |
PAN of Proprietor/Partner/Director, if available |
No |
|
33] |
Voter ID No of Proprietor/Partner/Director, if available |
No |
|
34] |
External Agency Rating, if available |
No |
LITIGATION
DETAILS:
CASE
STATUS INFORMATION
|
ARBAPPL 33 / 2014 |
ARBAPPLSR 2501 / 2014 |
CASE IS:PENDING |
|
PETITIONER |
RESPONDENT |
|
|
M/S B.RAMA RAO AND COMPANY, HYD |
VS |
M/S. AUROBINDO
PHARMA LIMITED (UNIT - VIII) |
|
PET.ADV. : SUDARSHAN |
RESP.ADV. : |
|
|
SUBJECT: ARBITRATION
APLICATION |
DISTRICT: HYDERABAD |
|
FILING
DATE: 09.04.2014 |
POSTING
STAGE : For Admission |
|
|
REG.
DATE : 10.04.2014 |
LISTING
DATE : 11.04.2014 |
STATUS : |
FINANCIAL HIGHLIGHTS:
The Company continued to show steady performance, achieved increase in revenues, operating profit and bottom line during the financial year 2012-13, despite the macroeconomic challenges in almost all the overseas markets. On the manufacturing side, there was severe stress due to shortage as well as high cost of power purchased from state grids. Currencies remained volatile, with intermittent sharp movements.
The Company demonstrated its resilience and the strength of its business model by expanding the product portfolio and aggressively marketing them, managing costs better in an inflationary environment, stepping up its manufacturing efficiencies and by staying focused on steadily raising its bottom line. Every effort as in the past was made to expand the global footprint and consolidate the position in the existing growth markets. Overall, the focus was on improving shareholder value.
The consolidated gross revenue from operations was higher by 27% at Rs.60008.300 million in the year over the previous year. The formulation and API ratio during the year was 57:43. Consolidated net operating income inclusive of dossier income of Rs.759.800 million is Rs.58553.200 million showing a growth of 26.5% over the previous year.
Consolidated gross revenue from formulation during the year was Rs.33872.000 million, 30.1% higher on a year-on-year basis. In the API markets, both domestic and overseas, the Company strived to increase its share of high value products and special efforts were made to build relationships in the developed markets. API revenues for the year were Rs.25362.000 million, a growth of 23% over the previous year, on account of favorable demand scenario as well as focused efforts at enhancing product realizations.
There has been a year-on-year improvement in EBITDA by 200 basis points. EBITDA before forex adjustments and other income for the year was Rs.8891.000 million which is 15.2% of net operating income and has gone up by 45.7% on year-on-year basis. Profitability during the year has improved due to better sales and business mix which had favorable impact on material consumption to net sales by 3.4%, and staff cost to net sales marginally decreased by 25 basis points and other expenses to net sales increased by 1.1%.
As far as foreign exchange is concerned, the closing rupee dollar rate was Rs.54.285 on March 31, 2013 while it was Rs.50.875 on March 31, 2012. The rupee has been highly volatile through the year and has depreciated by 6.7% during the financial year. This has resulted in a net exchange loss of Rs.1634.400 million during the year which includes an amount of Rs.1353.200 million on borrowings adjusted to finance charges as per revised Schedule VI. It has also increased the Company's borrowings by approximately Rs.2100 million as on March 31, 2013 on account of restatement.
REVIEW OF OPERATIONS
Formulations sales to USA was Rs.17526.000 million, recording a 48.1% growth over the previous year. Europe and Rest of the World geographies recorded a sale of Rs.8843.000 million in 2012-13, an increase of 39.8% over the previous fiscal. There was a 4.6% fall in ARV formulation sales at Rs.7503.000 million, in an endeavour to shed low margin products and optimize on their margins. Strategic action was taken to be selective in building products and markets that contribute to the bottom line.
In terms of segmental contribution to the formulations revenue, the share of US was 51.7% against 45.5% in the previous year. Similarly, European as well as the rest of the world was 26.1% against 24.3% and ARV was 22.2% against 30.2% in the previous year. The segmental shift in both API and formulations is reflective of the Company's efforts to improve margins and this trend is expected to continue.
In generic markets of US, UK, Germany, Spain and the Netherlands, the Company is progressing well. Additional thrust to raise the marketing presence and gain margin is ongoing in countries such as Japan, Portugal and Italy. The subsidiaries in the US have turned around and are substantially improving their sales.
In respect of US business, the Company has had a balanced growth between new product introductions and the base business. There was an increased presence with key customers. The marketing efforts were directed towards expanding strongly through retail chains with new product launches. Necessarily, aggressive positions were taken from an inventory standpoint in preparations for those launches; wherever required, the Company built inventory to take advantage of launch needs, while trimming inventory costs as a routine. Today, Aurobindo has a well balanced portfolio and a pragmatic growth plan.
In the formulation business, the Company is spreading across the geographies to grow in each of the geography independently rather than trying to be focused on only one or two markets. In case of API business, the objective is to grow high value and niche products while taking advantage of the vertically integrated manufacturing systems.
The Company targets to grow the ARV business while ensuring that the focus remains on the bottom line. During the year, in keeping with this strategy, Aurobindo participated in tenders where the Company could quote a price which will ensure competitive margins rather than just chasing the top-line. There is a very large portfolio of ARV products with the Company and the objective is to grow this business while climbing the value chain.
UNSECURED LOAN
(Rs. in Millions)
|
Particulars |
As
on 31.03.2013 |
As
on 31.03.2012 |
|
LONG-TERM
BORROWINGS |
|
|
|
Deferred sales tax loan |
639.300 |
706.200 |
|
SHORT-TERM
BORROWINGS |
|
|
|
Buyers credit |
1152.400 |
878.500 |
|
Packing credit loans |
6115.000 |
7654.500 |
|
Short-term loans from banks |
1085.700 |
250.000 |
|
Total |
8992.400 |
9489.200 |
|
Note: Unsecured term loans in foreign currency carry interest in the range of LIBOR plus 3% to 3.75%. These loans have been repaid in 2012-13. Deferred sales tax loan is interest free and payable in various installments as per sales tax deferment scheme. The last installment is payable in 2025-26. |
||
OUTLOOK
Going ahead, introduction of new products by the Company is expected to be a strong driver in the formulations market with about 20 to 25 launches in 2013-14 and efforts shall continue to increase the penetration in the existing baseline business.
The focus on API is to reduce the dependency on the pure Betalactam products. The Company has 279 DMFs filed in the U.S., Europe and Japan. While Aurobindo has a growing presence in the US and several countries of Europe for over several years, a determined effort is being made to make inroads in to Japan. Today Aurobindo exports six API products and intermediates to several prestigious customers in that country. Purposeful efforts are being made to grow this quality-conscious market, and the Company has been able to maintain more than 50% growth in Japan in each of the last six quarters.
Aurobindo has a wide array of well-balanced products on offer. Some are specialized and can drive higher margins, some belong to niche spaces such as ophthalmics, while others are typical mass market, high volume molecules that are expected to boost the bottom line over the next couple of years. There are others that are gaining higher volumes which are being leveraged to take advantage of the in-house API strengths, vertical integration of capacities and improving manufacturing efficiencies.
There are a large number of ANDA applications that have been submitted in the past few months, which await approvals, adding to the pipeline of products on offer. The Company believes that there would be significant increase in the product basket over next 2 to 3 years. Aurobindo is making a foray in to the injectables market which could gain traction in the latter half of 2013-14. Given that there are fewer competitors than in solid orals, the objective is to gain around 10-15% market share as the Company moves forward.
It needs to be highlighted that the improved performance in 2012-13 was without the manufacturing capacities at Unit-IV, Unit-VI and less than optimum capacity utilization at Unit-XII. The recent spate of approvals would further ramp up the capacity utilization at Unit-VII. Team Aurobindo is fairly confident of improving the market share and top line every quarter of the year ahead.
It is expected that European operations in countries such as Italy and Portugal would stabilize in 2013-14 and turn around a year later. Meanwhile operations in countries such as UK, the Netherlands, Germany and Spain are targeted to grow faster than the previous year. Volumes in Canada are also picking up and Australian operations are likely to stabilize over the next 18 to 24 months.
Aurobindo has made a foray into the CRAMS business in the past few months and believes that it should become a significant portion of the income in about 3 years. While it has started contributing to the business model, and is likely to improve gradually, the Company shall work to ramp up the CRAMS business, build a mutually advantageous relationship with customers, become a dependable resource and contribute meaningfully to the revenue stream.
The Company will be overcoming a major challenge in availability and cost of power. The possibility of plant shutdown and cost escalation through diesel generation threatened the operations of almost all the Company's facilities. The year witnessed an energy crisis which included three-day week power holiday, surprise powercuts and prohibitive cost increases. Considerable relief has now been worked out by independently installing the meters in all but one of the production units, to do power trading through the power exchange which has brought down the cost and added to the certainty of power availability.
MANAGEMENT DISCUSSION
AND ANALYSIS
ECONOMIC BACKGROUND
The Gross Domestic Product (GDP) growth rate for the past two years has successively slowed, down to 6.2% in 2011-12 and further to 5% in 2012-13. Despite this, the compound annual growth rate (CAGR) of GDP at factor cost, over the decade ending 2012-13 was 7.9%.
The economy slowed down rapidly despite recovering from the global financial crisis, due to a variety of reasons such as, high inflation, reduced consumption demand, deceleration in corporate and infrastructure investment and tighter monetary policy. The economy was also hit by additional shocks of a slowing global economy, weighed down by the crisis in the Euro area and uncertainties about fiscal policy in the United States.
As growth turned sluggish and government revenues did not keep pace with spending, the fiscal deficit threatened to breach the target. With government savings falling, and private savings also shrinking, the current account deficit, which is the investment that cannot be financed by domestic savings and has to be financed through trade surplus, also widened.
However, India is still in an enviable position with the GDP expected to climb to 6.4% again, in 2013-14. The growth is expected to increase further to 6.7% in 2014-15, according to the World Bank's latest India Development Update, a bi-annual report on the Indian economy. The Prime Minister's Economic Advisory Panel expects the economic growth rate to increase to 6.4% in 2013-14 from 5% during 2012-13, on the back of improvement in the performance of agriculture and manufacturing sectors.
INDUSTRY PERSPECTIVE
India's pharmaceutical sector is poised to grow from the present US$ 15.6 billion, to US$ 35.9 billion by 2017. A similar forecast has been published in a Pricewaterhouse Coopers (PwC) report which believes that the industry size could possibly touch US$ 74 billion by 2020. The Indian Government's Pharma Vision 2020 also aims at making India a global leader in end-to-end manufacture by 2020, and hence the Government is planning to set up a US$ 640 million venture capital fund to boost drug discovery and further strengthen the pharmaceutical sector.
According to industry estimates, the Indian pharmaceutical industry produces about 60,000 generic brands in 60 therapeutic categories and manufactures more than 400 different APIs. Presently, generics dominate the market while the expectations are that patent-protected products are likely to constitute 10% of the industry cake by 2015. Both Indian and foreign multinationals are set to launch patented drugs across India.
Rural India is likely to witness a step-up in demand since manufacturers are reaching out to chemists by expanding their distribution network. Pharma industry is likely to see greater vibrancy when the networks start to impact manufacturing by 2015. India is considered a high-value hub for clinical trials due to the presence of genetically diverse population and availability of skilled doctors.
In its bid to step up Indian exports from the present tally of US$ 310 billion and reach a target of US$ 500 billion by 2014, the government believes that pharma is a major thrust sector growing at 15% annually and generics is a major strength area. Pharma industry is considered a focus area to achieve the overall target. India is expected to double pharmaceutical exports in the next few years, with the Pharmaceutical Export Promotion Council (Pharmexcil) eyeing overseas sales worth US$ 20 billion by the end of 2014-15. The figure stood at around $10 billion in 2010-11.
Traditionally India has been exporting to regulated markets, the US and the EU markets accounting for a major share apart from other regulated markets such as Oceania and Japan and less regulated markets such as Latin America, Africa and parts of Asia. India witnessed a phenomenal growth in the EU and North America, with growth in Africa also being spectacular. In the former markets India has largely been existent in the upper end of the value chain.
Japan offers a fresh opportunity for quality conscious manufacturers. Given the heavy pressure on the health requirements, specially its aging population, Japan which is a US$ 109 billion market, of which generics constitute 8%, has decided to enlarge its generics portfolio. Japan today represents an opportunity for the Indian pharmaceutical industry. India has also entered into an FTA with Japan, which is a conscious agreement to mutually increase cooperation in the pharma sector. An element of this is the fact that Japan has extended national treatment to Indian companies.
Salient features of
the Indian pharma industry are:
- Accounts for over 10% of global pharmaceutical production;
- Manufactures over 60,000 generic brands across 60 therapeutic categories;
- Produces more than 400 different APIs;
- Over 120 US FDA and 84 UK MHRA approved manufacturing facilities in India;
- Manufacturing cost of Indian pharma companies is up to 65% lower than that of US firms and almost half of that of European manufacturers;
- Lower cost of production and R and D capabilities boosts competitiveness of Indian pharma companies;
- Comparative cost advantage enhances Indian pharma exports; and,
- Pharma industry exports
amount to approximately US$ 310 bn a year.
CONTINGENT
LIABILITIES:
(Rs. in Millions)
|
Particulars |
As at March 31, 2013 |
As at March 31, 2012 |
|
Outstanding bank guarantees |
486.300 |
391.900 |
|
Claims arising from disputes not acknowledged as debts |
|
|
|
- indirect taxes (excise duty and service tax)* |
196.300 |
140.700 |
|
Claims arising from disputes not acknowledged as debts - direct taxes* |
105.000 |
105.000 |
|
Claims against the Company not acknowledged as debts* |
493.100 |
23.700 |
|
Bills discounted with banks |
3,252.900 |
- |
|
Corporate guarantee to bank for loan taken by 100% subsidiary |
- |
1,589.800 |
* in respect of above matters, future cash outfows in respect of contingent liabilities are determinable only on receipt of judgements pending at various forums/authorities.
INDEX OF CHARGES
|
S.No. |
Charge ID |
Date of Charge
Creation/Modification |
Charge amount
secured |
Charge Holder |
Address |
Service Request
Number (SRN) |
|
1 |
10402714 |
08/01/2013 |
1,300,000,000.00 |
DBS BANK LIMITED |
SALARPURIA WINDSOR, NO.3, ULSOOR ROAD, BENGALURU, KARNATAKA - 560042, INDIA |
B67978148 |
|
2 |
10359357 |
25/05/2012 |
1,560,000,000.00 |
IFCI LIMITED |
IFCI TOWER, 5-9-13, TARAMANDAL COMPLEX, SAIFABAD, HYDERABAD, ANDHRA PRADESH - 500004, INDIA |
B41106147 |
|
3 |
10359358 |
25/05/2012 |
1,300,000,000.00 |
IFCI LIMITED |
IFCI TOWER, 5-9-13, TARAMANDAL COMPLEX, SAIFABAD, HYDERABAD, ANDHRA PRADESH - 500004, INDIA |
B41106543 |
|
4 |
10269583 |
22/09/2011 * |
379,750,000.00 |
AXIS BANK LIMITED |
TRISHUL 3RD FLOOR OPP SAMARTHESHWAR TEMPLE, LAW G |
B22085377 |
|
5 |
10262723 |
28/12/2010 |
2,250,000,000.00 |
IFCI LIMITED |
IFCI TOWER, 5-9-13, TARAMANDAL COMPLEX, SAFIFABAD, HYDERABAD, ANDHRA PRADESH - 500004, INDIA |
B03928439 |
|
6 |
10265641 |
28/12/2010 |
1,856,000,000.00 |
ING BANK N V |
SINGAPORE BRANCH, 9 RAFFLES PLACE,#19-02 REPUBLIC PLAZA, SINGAPORE, - 048619, SINGAPORE |
B03586161 |
|
7 |
10266490 |
28/12/2010 |
1,645,000,000.00 |
IFCI LIMITED |
IFCI TOWER, 5-9-13, TARAMANDAL COMPLEX, SAFIFABAD, HYDERABAD, ANDHRA PRADESH - 500004, INDIA |
B05139555 |
|
8 |
10215595 |
06/11/2012 * |
1,630,000,000.00 |
ICICI BANK LIMITED |
ICICI BANK TOWER, PLOT NO.12, NANAKRAM GUDA, 6TH FLOOR, TOWER II, NORTH WING, HYDERABAD, ANDHRA PRADESH - 500032, INDIA |
B63172589 |
|
9 |
10044936 |
08/07/2013 * |
1,300,000,000.00 |
HDFC BANK LIMITED |
HDFC BANK HOUSESENAPATI BAPAT MARG, LOWER PAREL W, MUMBAI, MAHARASHTRA - 400013, INDIA |
B80455975 |
|
10 |
10030551 |
12/07/2012 * |
2,800,000,000.00 |
IDBI BANK LIMITED |
5-9-89/1 &2, CHAPEL ROAD, PB NO.370, HYDERABAD, ANDHRA PRADESH - 500001, INDIA |
B44031094 |
|
11 |
80028833 |
03/01/2005 |
430,000,000.00 |
IDBI BANK LIMITED |
BASHEERBAGH, HYDERABAD, ANDHRA PRADESH - 500001, INDIA |
- |
|
12 |
80028840 |
01/10/2001 * |
400,000,000.00 |
ICICI LIMITED |
ICICI TOWERS, BHANDRA KURLA COMPLEX, MUMBAI, MAHARASHTRA - 400051, INDIA |
- |
|
13 |
80022102 |
06/06/2013 * |
3,260,000,000.00 |
CANARA BANK |
PRIME CORPORATE BRANCH, TSR COMPLEX, 2ND FLOOR, 1 |
B77396448 |
|
14 |
80013577 |
27/06/2012 * |
4,200,000,000.00 |
ANDHRA BANK |
SOMAJIGUDA BRANCH, 6-3-352/2, ASTRA HEIGHTS, ROAD, NO.1, BANJARA HILLS, HYDERABAD, ANDHRA PRADESH - 500034, INDIA |
B42847137 |
|
15 |
80028828 |
23/12/1999 |
150,000,000.00 |
EXPORT-IMPORT BANK OF INDIA |
WORLD TRADE CENTRE, CUFFE PARADE, MUMBAI, MAHARASHTRA - 400005, INDIA |
- |
|
16 |
80013576 |
30/04/2013 * |
5,300,000,000.00 |
STATE BANK OF INDIA |
CORPORATE ACCOUNT GROUP BRANCH, OZONE, 2ND FLOOR, |
B76325125 |
|
17 |
80013053 |
19/04/2013 * |
11,700,000,000.00 |
STATE BANK OF HYDERABAD |
INDUSTRIAL FINANCE BRANCH, TOPAZ BUILDING, AMRUTHA HILLS, PANJAGUTTA, HYDERABAD, ANDHRA PRADESH - 500082, INDIA |
B76493881 |
|
18 |
80026247 |
11/02/2013 * |
1,300,000,000.00 |
STANDARD CHARTERED BANK |
6-3-1090, TSR TOWERS, RAJ BHAVAN ROAD, SOMAJIGUDA, HYDERABAD, ANDHRA PRADESH - 500082, INDIA |
B68854371 |
* Date of charge modification
FIXED ASSETS:
·
·
·
Leasehold buildings
·
Freehold buildings
·
Plant and Machinery
·
Furniture and Fittings
·
Vehicles
·
Office Equipment
STATEMENT OF STAND ALONE UNAUDITED RESULTS FOR THE QUARTER & NINE
MONTHS ENDED 31.12.2013
Rs. In Millions
|
Particulars |
Three months ended |
Nine months ended |
||
|
31.12.2013 |
30.09.2013 |
31.12.2013 |
||
|
Unaudited |
Unaudited |
Unaudited |
||
|
1 |
Income from Operations |
|
|
|
|
|
(a) Net sates/income from operations (Net
of excise duty) |
18929.100 |
158.16.200 |
50703.100 |
|
|
(b) Other Operating Income |
50.400 |
163.800 |
373.800 |
|
|
Total
income from operations (net) |
18979.500 |
15980.000 |
51076.900 |
|
2 |
Expenses |
|
|
|
|
|
(a) Cost of materials consumed |
8802.800 |
8083.800 |
24842.500 |
|
|
(b) Purchases of stock-in trade |
642.400 |
42.900 |
873.70 |
|
|
(c) Changes in inventories of finished
goods. work-in-progress and stock in trade |
(464.800) |
185.500 |
286.500 |
|
|
(d) Employee benefits expense |
1334.700 |
1196.400 |
3765.700 |
|
|
(e) Depreciation and Anmortisation Expenses |
471.900 |
470.300 |
1401.500 |
|
|
(f) Provision for decline in the value of long-term investment |
-- |
250.000 |
250.000 |
|
|
(g) Other Expenses |
2866.200 |
2618.500 |
7974.800 |
|
|
Total
expenses |
13653.200 |
12847.400 |
39394.700 |
|
3 |
Profit/ (Loss) from operations before other
Income, finance costs and exceptional Items (1-2) |
5326.300 |
3132.600 |
11682.200 |
|
4 |
Other Income |
131.300 |
20.500 |
180.500 |
|
5 |
Profit/ (Loss) from operations before other
income, finance costs and exceptional items (3+4) |
5457.600 |
3153.100 |
11862.700 |
|
6 |
Finance Costs |
174.500 |
196.900 |
578.700 |
|
|
Foreign exchange (Gain)/Loss |
(202.100) |
783.800 |
1977.000 |
|
7 |
Profit/ (Loss) from ordinary activities
after finance cost but before exceptional items (5-6) |
5485.200 |
2172.400 |
9307.000 |
|
8 |
Exceptional items |
-- |
-- |
-- |
|
9 |
Profit/ (Loss) from ordinary activities
before tax (7+8) |
5485.200 |
2172.400 |
9307.000 |
|
10 |
Tax expenses |
1303.600 |
375.400 |
1892.100 |
|
11 |
Net Profit / (Loss) from ordinary
activities after tax (9-10) |
4181.600 |
1797.000 |
7414.900 |
|
12 |
Extraordinary item (net of tax expense) |
-- |
-- |
-- |
|
13 |
Net Profit / (Loss) for the period (11-12) |
4181.600 |
1797.000 |
7414.900 |
|
14 |
Share of profit' (loss) of associates |
-- |
-- |
-- |
|
15 |
Minority Interest |
-- |
-- |
-- |
|
16 |
Net Profit/ (Loss) after taxes, minority
interest and share of profit/(loss) of associates (13+14+15) |
4181.600 |
1797.000 |
7414.900 |
|
17 |
Paid up equity share capital (Face Value of
Rs10/- each) |
291.200 |
291.200 |
291.200 |
|
18 |
Reserve excluding Revaluation Reserve as
per Balance Sheet of previous accounting year |
-- |
-- |
-- |
|
19. |
Earnings per share of Re.1/- each (not annualised) |
|
|
|
|
|
(a) Basic |
14.36 |
6.17 |
25.46 |
|
|
(b) Diluted |
14.34 |
6.16 |
25.43 |
|
A |
PARTICULARS OF SHAREHOLDING |
|
|
|
|
1 |
Public Shareholding |
|
|
|
|
|
- Number of shares |
131,834,694 |
131,514,694 |
131,834,694 |
|
|
- Percentage of shareholding |
45.27% |
45.16% |
45.27% |
|
2 |
Promoters and Promoter group shareholding |
|
|
|
|
|
a) Pledged / Encumbered |
|
|
|
|
|
- Number of shares |
34,931,797 |
33,293,797 |
34,931,797 |
|
|
- Percentage of shares (as a % of the total
shareholding of Promoter & Promoter group) |
21.92% |
20.85% |
21.92% |
|
|
- Percentage of shares (as a % of the total
Share Capital of the Company) |
12.00% |
11.43% |
12.00% |
|
|
b) Non Encumbered |
|
|
|
|
|
- Number of shares |
124,444,799 |
128,402,799 |
124,444,799 |
|
|
- Percentage of shares (as a % of the total
shareholding of Promoter & Promoter group) |
78.08% |
79.15% |
78.08% |
|
|
- Percentage of shares (as a % of the total
Share Capital of the Company) |
42.73% |
43.41% |
42.73% |
|
|
|
|
|
|
|
B |
INVESTOR
COMPLAINTS |
|
|
|
|
|
Pending at the beginning of the quarter |
Nil |
|
|
|
|
Received during the quarter |
65 |
|
|
|
|
Disposed off during the quarter |
65 |
|
|
|
|
Remaining unresolved at the end of the
quarter |
Nil |
|
|
Notes :
- The above unaudited financial results for the quarter and nine months ended December 31, 2013 as reviewed by the Audit Committee have been approved by the Board at its meeting held on February 06, 2014. A Limited Review of the stand alone financial results for the quarter ended December 31, 2013 has been carried out by the Statutory Auditors.
- The consolidated financial results have been prepared in accordance with AS - 21 on 'Consolidated Financial Statement' and AS-27 ' Financial Reporting of Interests in Joint Ventures' and includes financial results of all Subsidiaries and Joint Venture.
- The Company's operations fall within a single primary business segment viz. 'Pharmaceutical Products'.
- Sales of standalone for the current quarter include exports Rs.14368.200 Millions (Quarter ended December 31, 2012: Rs.10292.100 Millions).
- Net sales for the current quarter include dossier income in standalone of Rs.9.800 Millions (Quarter ended December 31, 2012:Rs.185.700 Millions) and in consolidated of Rs.16.700 Millions (Quarter ended December 30, 2012: Rs.385.500 Millions).
- Foreign exchange (gain)/loss for stand alone and consolidated includes exchange difference of Rs.519.600 Millions, Rs.492.000 Millions,Rs.499.900 Millions for three months ended December 31, 2013, September 30, 2013,December 31, 2012, respectively and Rs.1516.400 Millions, Rs.1444.400 Millions for the nine months ended December 31, 2013 and December 31, 2012 respectively and Rs.1353.200 Millions for the year ended March 31, 2013 arising from foreign currency borrowings to the extent that they are regarded as an adjustment to finance cost as per para 4(e) of "AS 16" on Borrowing costs.
- With effect from April 1, 2013, the Company has changed the accounting policy for valuation of cost of the inventory from ‘first- in -first out’ basis to ‘moving average basis’. Accordingly, this has resulted in decrease/(increase) in the value of inventory on standalone basis as at December 31, 2013 and September 30, 2013 by Rs. 37.700 Millions and Rs.69.400 Millions respectively, and on consolidated basis by Rs.(178.600 Millions) and Rs.71.300 Millions respectively, and decrease/(increase) in profit before tax on standalone basis for the quarter ended December 31, 2013 and September 30, 2013, and for the nine months ended December 31, 2013 by Rs.(31.700 Millions), Rs. 63.400 Millions and Rs. 37.700 Millions respectively, and on consolidated basis for the quarter ended December 31, 2013 and September 30, 2013, and for the nine months ended Decemeber 31, 2013 by (Rs.239.000 Millions) Rs.55.400 Millions and Rs. (179.200 Millions) respectively.
- The Company incorporated a wholly owned subsidiary viz. AuroZymes Limited on November 28,.2013.
- The Company has allotted 1,27,500 equity shares Re.1/- each under ESOP on January 9,.2014. Consequently, the paid up share capital of the Company has increased to 29,13,38,790 equity shares of Re.1/- each.
- Previous period figures have been regrouped/rearranged whereever considered necessary to conform to the current period presentation.
AS PER WEBSITE DETAILS:
PRESS RELEASE:
AUROBINDO COMPLETES
THE ACQUISITION OF SELECT WESTERN EUROPEAN BUSINESSES OF ACTAVIS
1st April 2014,
Hyderabad
Aurobindo Pharma Limited (BSE: 524804 and NSE: AUROPHARMA) today announced the completion of the previously announced acquisition of certain commercial operations in Western Europe from Actavis plc (NYSE: ACT). The agreement to acquire the Actavis operations was announced in January 2014.
Aurobindo acquires personnel, commercial infrastructure, products, marketing authorisations and dossier licence rights in seven European countries. Actavis and Aurobindo have also entered into a long term commercial and supply arrangement.
Following receipt of clearances from competent authorities, Aurobindo now intends to combine the strength of both enterprises (including its vertically integrated platform and existing commercial infrastructure) in these markets and to identify and maximise all opportunities to improve performance.
The acquisition will make Aurobindo one of the leading Indian pharmaceutical companies in Europe said Mr. Muralidharan, SVP of European Operations for Aurobindo. The acquisition will enable Aurobindo to achieve critical mass in Western Europe with a top 10 position in several key markets. He further added “I am delighted to welcome relevant Actavis customers, suppliers, partners and employees to Aurobindo. We will continue to collaborate with Actavis to ensure business continuity and a smooth transition. In parallel, we will work closely with the acquired management teams to achieve a rapid and successful integration”.
Mr. Arvind Vasudeva, CEO of Aurobindo’s Formulations Business further stated that: “We had carefully reviewed the Actavis European operations and concluded that with our cost competitiveness and group structure we could significantly capitalize Actavis’ strong market position in these Western European countries and improve profitability, thereby accelerating our strategy of becoming a significant Gx player in Europe”.
About Aurobindo
Aurobindo Pharma Limited (www.aurobindo.com), headquartered at Hyderabad, India, manufactures generic pharmaceuticals and active pharmaceutical ingredients. The company’s manufacturing facilities are approved by several leading regulatory agencies like US FDA, UK MHRA, WHO, Health Canada, MCC South Africa, ANVISA Brazil. The company’s robust product portfolio is spread over 6 major therapeutic/product areas encompassing Antibiotics, Anti-Retrovirals, CVS, CNS, Gastroenterologicals, and Anti-Allergics, supported by an outstanding R&D set-up. The Company is marketing these products globally, in over 125 countries.
CMT REPORT (Corruption, Money Laundering & Terrorism]
The Public Notice information has been collected from various sources
including but not limited to: The Courts,
1] INFORMATION ON
DESIGNATED PARTY
No exist designating subject or any of its beneficial owners,
controlling shareholders or senior officers as terrorist or terrorist
organization or whom notice had been received that all financial transactions
involving their assets have been blocked or convicted, found guilty or against
whom a judgement or order had been entered in a proceedings for violating
money-laundering, anti-corruption or bribery or international economic or
anti-terrorism sanction laws or whose assets were seized, blocked, frozen or
ordered forfeited for violation of money laundering or international
anti-terrorism laws.
2] Court Declaration :
No exist to suggest that subject is or was
the subject of any formal or informal allegations, prosecutions or other
official proceeding for making any prohibited payments or other improper
payments to government officials for engaging in prohibited transactions or
with designated parties.
3] Asset Declaration :
No records exist to suggest that the property or assets of the subject
are derived from criminal conduct or a prohibited transaction.
4] Record on Financial
Crime :
Charges or conviction
registered against subject: None
5] Records on Violation of
Anti-Corruption Laws :
Charges or investigation
registered against subject: None
6] Records on Int’l
Anti-Money Laundering Laws/Standards :
Charges or
investigation registered against subject: None
7] Criminal Records
No
available information exist that suggest that subject or any of its principals
have been formally charged or convicted by a competent governmental authority
for any financial crime or under any formal investigation by a competent
government authority for any violation of anti-corruption laws or international
anti-money laundering laws or standard.
8] Affiliation with
Government :
No record
exists to suggest that any director or indirect owners, controlling
shareholders, director, officer or employee of the company is a government
official or a family member or close business associate of a Government
official.
9] Compensation Package :
Our market
survey revealed that the amount of compensation sought by the subject is fair
and reasonable and comparable to compensation paid to others for similar
services.
10] Press Report :
No press reports / filings exists on
the subject.
CORPORATE GOVERNANCE
MIRA INFORM as part of its Due Diligence do provide comments on
Corporate Governance to identify management and governance. These factors often
have been predictive and in some cases have created vulnerabilities to credit
deterioration.
Our Governance Assessment focuses principally on the interactions
between a company’s management, its Board of Directors, Shareholders and other
financial stakeholders.
CONTRAVENTION
Subject is not known to have contravened any existing local laws,
regulations or policies that prohibit, restrict or otherwise affect the terms
and conditions that could be included in the agreement with the subject.
FOREIGN EXCHANGE RATES
|
Currency |
Unit
|
Indian Rupees |
|
US Dollar |
1 |
Rs.60.23 |
|
|
1 |
Rs.100.79 |
|
Euro |
1 |
Rs.83.29 |
INFORMATION DETAILS
|
Information
Gathered by : |
NYA |
|
|
|
|
Analysis Done by
: |
KAR |
|
|
|
|
Report Prepared
by : |
NTH |
SCORE & RATING EXPLANATIONS
|
SCORE FACTORS |
RANGE |
POINTS |
|
HISTORY |
1~10 |
6 |
|
PAID-UP CAPITAL |
1~10 |
5 |
|
OPERATING SCALE |
1~10 |
6 |
|
FINANCIAL CONDITION |
|
|
|
--BUSINESS SCALE |
1~10 |
6 |
|
--PROFITABILIRY |
1~10 |
5 |
|
--LIQUIDITY |
1~10 |
6 |
|
--LEVERAGE |
1~10 |
6 |
|
--RESERVES |
1~10 |
6 |
|
--CREDIT LINES |
1~10 |
6 |
|
--MARGINS |
-5~5 |
-- |
|
DEMERIT POINTS |
|
|
|
--BANK CHARGES |
YES/NO |
YES |
|
--LITIGATION |
YES/NO |
YES |
|
--OTHER ADVERSE INFORMATION |
YES/NO |
NO |
|
MERIT POINTS |
|
|
|
--SOLE DISTRIBUTORSHIP |
YES/NO |
NO |
|
--EXPORT ACTIVITIES |
YES/NO |
NO |
|
--AFFILIATION |
YES/NO |
YES |
|
--LISTED |
YES/NO |
YES |
|
--OTHER MERIT FACTORS |
YES/NO |
YES |
|
DEFAULTER |
|
|
|
--RBI |
YES/NO |
NO |
|
--EPF |
YES/NO |
NO |
|
TOTAL |
|
52 |
This score serves as a reference to assess
SC’s credit risk and to set the amount of credit to be extended. It is
calculated from a composite of weighted scores obtained from each of the major
sections of this report. The assessed factors and their relative weights (as
indicated through %) are as follows:
Financial
condition (40%) Ownership
background (20%) Payment
record (10%)
Credit history
(10%) Market trend (10%) Operational size
(10%)
RATING EXPLANATIONS
|
RATING |
STATUS |
PROPOSED CREDIT LINE |
|
|
>86 |
Aaa |
Possesses an extremely sound financial base with the strongest
capability for timely payment of interest and principal sums |
Unlimited |
|
71-85 |
Aa |
Possesses adequate working capital. No caution needed for credit
transaction. It has above average (strong) capability for payment of interest
and principal sums |
Large |
|
56-70 |
A |
Financial & operational base are regarded healthy. General
unfavourable factors will not cause fatal effect. Satisfactory capability for
payment of interest and principal sums |
Fairly Large |
|
41-55 |
Ba |
Overall operation is considered normal. Capable to meet normal
commitments. |
Satisfactory |
|
26-40 |
B |
Capability to overcome financial difficulties seems comparatively
below average. |
Small |
|
11-25 |
Ca |
Adverse factors are apparent. Repayment of interest and principal sums
in default or expected to be in default upon maturity |
Limited with
full security |
|
<10 |
C |
Absolute credit risk exists. Caution needed to be exercised |
Credit not
recommended |
|
-- |
NB |
New Business |
-- |
This report is issued at your request without any
risk and responsibility on the part of MIRA INFORM PRIVATE LIMITED (MIPL)
or its officials.