MIRA INFORM REPORT
|
Report Date : |
15.04.2014 |
IDENTIFICATION DETAILS
|
Name : |
HIKAL LIMITED |
|
|
|
|
Registered
Office : |
717/718, Maker
Chambers V, 7th Floor, Nariman Point, Mumbai – 400 021,
Maharashtra |
|
|
|
|
Country : |
India |
|
|
|
|
Financials (as
on) : |
31.03.2013 |
|
|
|
|
Date of
Incorporation : |
08.07.1988 |
|
|
|
|
Com. Reg. No.: |
11–048028 |
|
|
|
|
Capital
Investment / Paid-up Capital : |
Rs. 164.401 millions |
|
|
|
|
CIN No.: [Company Identification
No.] |
L24200MH1988PTC048028 |
|
|
|
|
TAN No.: [Tax Deduction &
Collection Account No.] |
MUMH07537F /
BRDH00497A |
|
|
|
|
PAN No.: [Permanent Account No.] |
AAACH0383A |
|
|
|
|
Legal Form : |
A Public Limited Liability company. The company’s Share are Listed on
the Stock Exchange. |
|
|
|
|
Line of Business
: |
The Company is engaged in the manufacturing of various chemical intermediates,
specialty chemicals, Active pharma ingredients and Contracts Research
activities. |
|
|
|
|
No. of Employees
: |
Information declined by the management. |
RATING & COMMENTS
|
MIRA’s Rating : |
Ba (48) |
|
RATING |
STATUS |
PROPOSED CREDIT LINE |
|
|
41-55 |
Ba |
Overall operation is considered normal. Capable to meet normal
commitments. |
Satisfactory |
|
Maximum Credit Limit : |
USD 18050000 |
|
|
|
|
Status : |
Satisfactory |
|
|
|
|
Payment Behaviour : |
Usually correct |
|
|
|
|
Litigation : |
Exist |
|
|
|
|
Comments : |
Subject is an
established company having satisfatory track. The company
possesses a favourable financial profile marked by adequate networth base. Management has reported
a drastic dip in its net profitability during 2013. However, trade relations are fair. Business is active. Payment terms
are reported as usually correct. The company can be considered for business dealings at usual trade terms and conditions. |
NOTES :
Any query related to this report can be made
on e-mail : infodept@mirainform.com
while quoting report number, name and date.
ECGC Country Risk Classification List – March 31, 2014
|
Country Name |
Previous Rating (31.12.2013) |
Current Rating (31.03.2014) |
|
India |
A1 |
A1 |
|
Risk Category |
ECGC
Classification |
|
Insignificant |
A1 |
|
Low |
A2 |
|
Moderate |
B1 |
|
High |
B2 |
|
Very High |
C1 |
|
Restricted |
C2 |
|
Off-credit |
D |
INDIAN ECONOMIC OVERVIEW
US investment bank
Goldman Sachs has upgraded its outlook on Indian markets as it expects
positive impact of the election cycle.
India’s economy may
grow 4.7 % in the current financial year, lower than the official estimate of 4.9
%, Fitch Rating said. The global rating agency expects the economy to pick up
in the next two financial years.
Global ratings
agency Standard & Poor said increasing focus by India Inc on lowering debt
is likely to improve their credit profiles.
Singapore (1.1
million Indian tourists in 2012), Thailand (one million), the United Arab
Emirates ().98 million) and Malaysia ().82 million) emerged as the preferred
holidays hotspots for Indians. The total figure is expected to increase to 1.93
million by 2017, according to the latest Eurmonitor international report.
There is a $29.34 bn
outward foreign direct investment by domestic companies between April and
January of 2013/14 which has seen some signs of recovery according to a Care
Ratings report.
There are 264 number
of new companies being set up every day on average during 2014. Most of them
are registered in Mumbai. India had 1.38 million registered companies at the
end of January, 2014.
Twitter like
messaging service Weibo Corporation has filed to raise $ 500 million via a US
initial public offering. Alibaba, which owns a stake in Weibo is expected to
raise about $ 15 billion New York this year in the highest profile Internet IPO
since Facebook’s in 2012.
Bharti Airtel has
raised Rs.2,453.2 crore (350 million Swiss Francs) by selling six-year bonds at
a coupon rate of three per cent and maturing in 2020. This is the largest ever
bond offering by an Indian company in Swiss Francs. Bharat Petroleum
Corporation raised 175 million Swiss Francs by selling five year bonds at 2.98
% coupon rate in February.
Indian Oil
Corporation plans to invest Rs 7650 crore in setting up a petrochemical complex
at its almost complete Paradip refinery in Odhisha in three to four years. The
company board is set to consider the setting up of a 700000 tonne per annum
polypropylene plant at an estimated cost at Rs.3150 crore.
Global chief
information officers at gathering in Bangalore in April to meet Indian startups
at an event called Tech50 Watchout for Little Eye Labs-Facebook type deals in
the making.
EXTERNAL AGENCY RATING
|
Rating Agency Name |
ICRA |
|
Rating |
(Long term loans): BBB+ |
|
Rating Explanation |
Moderate degree of safety and moderate credit risk. |
|
Date |
September 2013. |
|
Rating Agency Name |
ICRA |
|
Rating |
(Short Term fund based): A3 |
|
Rating Explanation |
Moderate degree of safety and higher credit risk. |
|
Date |
September 2013. |
RBI DEFAULTERS’ LIST STATUS
Subject’s name is not enlisted as a defaulter in
the publicly available RBI Defaulters’ list.
EPF (Employee Provident Fund) DEFAULTERS’ LIST STATUS
Subject’s name is not enlisted as a defaulter
in the publicly available EPF (Employee Provident Fund) Defaulters’ list as of
31-03-2012.
INFORMATION DENIED BY
|
Name : |
Mr. Dr. Chatterji |
|
Designation : |
General Manager |
|
Contact No.: |
91-22-309731100 / 1199 |
|
Date : |
21.03.2014 |
LOCATIONS
|
Registered
Office / Corporate Office : |
717/718, Maker
Chambers V, 7th Floor, Nariman Point, Mumbai – 400 021,
Maharashtra, India |
|
Tel. No.: |
91-22-22301801 |
|
Fax No.: |
91-22-22833913 |
|
E-Mail : |
|
|
Website : |
|
|
|
|
|
Head Office : |
6, Nawab Building,
327, Dr. D. N. Road, Fort, Mumbai – 400 001, Maharashtra, India. |
|
Tel. No.: |
91-22-22301801 |
|
Fax No.: |
91-22-22833913 |
|
|
|
|
Administrative
Office : |
Great Eastern
Chambers, 6th Flore, Sector 11, CBD – Belapur, Navi Mumbai – 400 614, Maharashtra,
India |
|
Tel. No.: |
91-22-27574276 /
27574336 / 27574991 / 30973100 |
|
Fax No.: |
91-22-27574277 |
|
Email : |
|
|
|
|
|
Plant Location
: |
Taloja Mahad Panoli Tel
No. : 91-2646-302 100 Bangalore R and D Centre, Bangalore Pune ·
MIDC, Taloja, District Raigad, Maharashtra ·
MIDC, Mahad, District Raigad, Maharashtra ·
GIDC, Panoli, District Bharuch, Gujarat ·
KIADB, Jigani, Bangalore, Karnataka ·
Bannerghatta, Bangalore, Karnataka ·
MIDC, Dombivli, Maharashtra |
|
|
|
|
Overseas
Office |
Located at ·
Japan ·
USA |
DIRECTORS
As on 31.03.2013
|
Name : |
Mr. Baba N. Kalyani |
|
Designation : |
Chairman and Non Executive Director |
|
|
|
|
Name : |
Mr. Jai Hiremath |
|
Designation : |
Vice Chairman and Managing Director |
|
|
|
|
Name : |
Mr. Sameer J. Hiremath |
|
Designation : |
Deputy Managing Director |
|
|
|
|
Name : |
Mr. Prakash V. Mehta |
|
Designation : |
Independent, Non-Executive Director |
|
|
|
|
Name : |
Mr. Shivkumar M. Kheny |
|
Designation : |
Independent, Non-Executive Director |
|
|
|
|
Name : |
Mr. Kannan K. Unni |
|
Designation : |
Independent, Non-Executive Director |
|
|
|
|
Name : |
Dr. Peter Pollak |
|
Designation : |
Independent, Non-Executive Director |
|
|
|
|
Name : |
Mr. Amit Kalyani |
|
Designation : |
Alternate Director to Peter Pollak |
|
|
|
|
Name : |
Mr. Wolfgang Welter |
|
Designation : |
Director |
|
|
|
|
Name : |
Mrs. Sugandha J. Hiremath |
|
Designation : |
Non-Executive Director |
KEY EXECUTIVES
|
Name : |
Mr. Sham. V. Wahalekar |
|
Designation : |
Company Secretary |
|
Name : |
Mr. Dr. Chatterji |
|
Designation : |
General Manager |
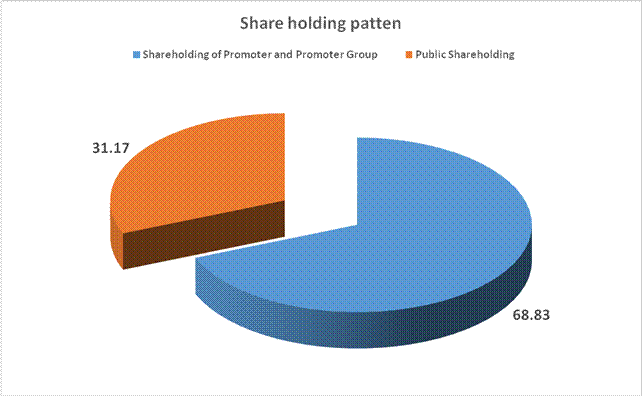
SHAREHOLDING PATTERN
As on 31.12.2013
|
Category of Shareholder |
Total No. of Shares |
Total
Shareholding as a % of Total No. of Shares |
|
|
(A) Shareholding
of Promoter and Promoter Group |
|
||
|
|
|
|
|
|
|
1572680 |
9.57 |
|
|
|
9623022 |
58.53 |
|
|
|
120000 |
0.73 |
|
|
|
120000 |
0.73 |
|
|
|
11315702 |
68.83 |
|
|
|
|
|
|
|
Total
shareholding of Promoter and Promoter Group (A) |
11315702 |
68.83 |
|
|
(B) Public
Shareholding |
|
||
|
|
|
|
|
|
|
1592346 |
9.69 |
|
|
|
1070 |
0.01 |
|
|
|
20100 |
0.12 |
|
|
|
526656 |
3.20 |
|
|
|
2140172 |
13.02 |
|
|
|
|
|
|
|
|
180789 |
1.10 |
|
|
|
|
|
|
|
|
1128861 |
6.87 |
|
|
|
202466 |
1.23 |
|
|
|
1472110 |
8.95 |
|
|
|
14352 |
0.09 |
|
|
|
1006 |
0.01 |
|
|
|
24310 |
0.15 |
|
|
|
1360000 |
8.27 |
|
|
|
72442 |
0.44 |
|
|
|
2984226 |
18.15 |
|
|
Total Public
shareholding (B) |
5124398 |
31.17 |
|
|
Total (A)+(B) |
16440100 |
100.00 |
|
|
(C) Shares held by
Custodians and against which Depository Receipts have been issued |
0 |
0.00 |
|
|
|
0 |
0.00 |
|
|
|
0 |
0.00 |
|
|
|
0 |
0.00 |
|
|
Total
(A)+(B)+(C) |
16440100 |
0.00 |
|
BUSINESS DETAILS
|
Line of Business : |
The Company is engaged in the manufacturing of various chemical
intermediates, specialty chemicals, Active pharma ingredients and Contracts
Research activities. |
||||||||
|
|
|
||||||||
|
Products : |
|
PRODUCTION STATUS AS ON 31.03.2012
|
Particulars |
Unit |
Actual
Production |
|
(Intermediate for dyes, pesticides and pharmaceuticals) |
|
1668.24 |
|
Electricity |
KWH |
10.800 |
|
Furnace oil |
Ltrs. |
2.16 |
|
LSHS / LDO /GAS |
Ltrs. |
0.46 |
GENERAL INFORMATION
|
No. of Employees : |
Information declined by the management. |
||||||||||||||||||||||||||||||||||||||||||||||||||||||||||||||||||||||||||||||||||||||||||||||||||||||||||||||||||||||||||||||||||||||||||||
|
|
|
||||||||||||||||||||||||||||||||||||||||||||||||||||||||||||||||||||||||||||||||||||||||||||||||||||||||||||||||||||||||||||||||||||||||||||
|
Bankers : |
|
||||||||||||||||||||||||||||||||||||||||||||||||||||||||||||||||||||||||||||||||||||||||||||||||||||||||||||||||||||||||||||||||||||||||||||
|
|
|
||||||||||||||||||||||||||||||||||||||||||||||||||||||||||||||||||||||||||||||||||||||||||||||||||||||||||||||||||||||||||||||||||||||||||||
|
Facilities : |
|
||||||||||||||||||||||||||||||||||||||||||||||||||||||||||||||||||||||||||||||||||||||||||||||||||||||||||||||||||||||||||||||||||||||||||||
|
|
|
|
Banking
Relations : |
-- |
|
|
|
|
Auditors : |
|
|
Name : |
BSR and Company Chartered Accountants |
|
|
|
|
Legal Advisor : |
Malvi Ranchoddas
and Company |
|
|
|
|
Subsidiaries : |
·
Hikal
International B.V. (“HIBV”) ·
Acoris
Research Limited (“ARL”) |
|
|
|
|
Enterprises over
which key management personnel and their relatives exercise significant
influence : |
·
Decent
Electronics Private Limited (“DEPL”) ·
Marigold
Investments Private Limited ·
Iris
Investments Private Limited ·
Karad
Engineering Consultancy Private limited (“KECPL”) ·
Ekdant
Investments Private limited (“EIPL”) ·
Rameshwar
Investment Private Limited (“RIPL”) ·
Badrinath
Investment Private Limited (“BIPL”) ·
Rushabh
Capital Services Private Limited (“RCSPL”) |
CAPITAL STRUCTURE
As on 31.03.2013
Authorised Capital :
|
No. of Shares |
Type |
Value |
Amount |
|
|
|
|
|
|
25000000 |
Equity Share |
Rs.10/- Each |
Rs.250.000
Millions |
|
5000000 |
Cumulative
Redeemable Preference shares |
Rs.100/- Each |
Rs.500.000
Millions |
|
|
|
|
|
|
|
Total |
|
Rs.750.000 Millions |
Issued, Subscribed & Paid-up Capital :
|
No. of Shares |
Type |
Value |
Amount |
|
|
|
|
|
|
16440100 |
Equity Shares |
Rs.10/- Each |
Rs.164.401
Millions |
|
|
|
|
|
a. Reconciliation of the
shares outstanding at the beginning and at the end of the reporting period
|
|
March 31, 2013 |
|
|
|
No. millions |
Rs. In Millions |
|
At the beginning of the year |
16.44 |
164.40 |
|
Outstanding at the end of the year |
16.44 |
164.40 |
|
|
|
|
Terms/rights attached to equity shares
The company has only one class of equity shares having a par value of Rs.10/- per share. Each holder of equity shares is entitled to one vote per share. The company declares and pays dividends in Indian Rupees. The dividend proposed by the Board of Directors is subject to the approval of the shareholders in the ensuing Annual General Meeting.
During the year ended March 31, 2013 the amount of per share dividend recognized as distributions to equity shareholders was Rs.2.50/- (March 31, 2012: Rs. 6/-).In the event of liquidation of the company, the holders of equity shares will be entitled to receive remaining assets of the company, after distribution of all preferential amounts. The distribution will be in proportion to the number of equity shares held by the shareholders.
c. Details of
shareholders holding more than 5% shares in the company
|
|
March 31, 2013 |
|
|
Equity shares of
Rs.10 each fully paid |
No. millions |
Class |
|
Kalyani Investment Company Limited |
5.16 |
31.36 |
|
Shri Badrinath Investment Private Limited |
2.65 |
16.15 |
|
Shri Rameshwara Investment Private Limited |
1.31 |
7.96 |
|
International Finance Corporation |
1.36 |
8.27 |
|
Sugandha J Hiremath |
1.29 |
7.84 |
FINANCIAL DATA
[all figures are
in Rupees Millions]
ABRIDGED BALANCE
SHEET
|
SOURCES
OF FUNDS |
31.03.2013 |
31.03.2012 |
31.03.2011 |
|
|
|
|
|
|
I.
EQUITY AND LIABILITIES |
|
|
|
|
(1)Shareholders' Funds |
|
|
|
|
(a) Share Capital |
164.400 |
164.400 |
164.400 |
|
(b) Reserves & Surplus |
4,348.080 |
4,433.780 |
4,052.410 |
|
(c) Money received against
share warrants |
0.000 |
0.000 |
0.000 |
|
|
|
|
|
|
(2) Share Application money
pending allotment |
0.000 |
0.000 |
0.000 |
|
Total
Shareholders’ Funds (1) + (2) |
4,512.480 |
4,598.180 |
4,216.810 |
|
|
|
|
|
|
(3) Non-Current Liabilities |
|
|
|
|
(a) long-term borrowings |
2,196.270 |
2,268.770 |
2,325.870 |
|
(b) Deferred tax liabilities
(Net) |
86.250 |
86.710 |
26.800 |
|
(c) Other long term
liabilities |
0.000 |
0.000 |
0.000 |
|
(d) long-term provisions |
96.620 |
64.190 |
62.830 |
|
Total
Non-current Liabilities (3) |
2,379.140 |
2,419.670 |
2,415.500 |
|
|
|
|
|
|
(4) Current Liabilities |
|
|
|
|
(a) Short term borrowings |
2,602.830 |
2,054.670 |
1,913.410 |
|
(b) Trade payables |
1,128.410 |
1,139.260 |
819.940 |
|
(c) Other current liabilities |
1,236.280 |
1,062.460 |
1,047.780 |
|
(d) Short-term provisions |
60.440 |
129.680 |
131.270 |
|
Total
Current Liabilities (4) |
5,027.960 |
4,386.070 |
3,912.400 |
|
|
|
|
|
|
TOTAL |
11,919.580 |
11,403.920 |
10,544.710 |
|
|
|
|
|
|
II.
ASSETS |
|
|
|
|
(1) Non-current assets |
|
|
|
|
(a) Fixed Assets |
|
|
|
|
(i) Tangible assets |
5,607.570 |
5,783.960 |
5,755.320 |
|
(ii) Intangible Assets |
0.000 |
0.000 |
0.000 |
|
(iii) Capital work-in-progress |
485.430 |
747.560 |
512.130 |
|
(iv) Intangible assets under
development |
0.000 |
0.000 |
0.000 |
|
(b) Non-current Investments |
31.270 |
181.670 |
181.670 |
|
(c) Deferred tax assets (net) |
0.000 |
0.000 |
0.000 |
|
(d) Long-term Loan and Advances |
704.160 |
1,236.000 |
1,012.220 |
|
(e) Other Non-current assets |
0.000 |
0.000 |
0.000 |
|
Total
Non-Current Assets |
6,828.430 |
7,949.190 |
7,461.340 |
|
|
|
|
|
|
(2) Current assets |
|
|
|
|
(a) Current investments |
0.000 |
0.000 |
0.000 |
|
(b) Inventories |
2,570.330 |
1,918.530 |
1,715.060 |
|
(c) Trade receivables |
846.290 |
987.340 |
852.210 |
|
(d) Cash and cash equivalents |
154.050 |
59.190 |
88.030 |
|
(e) Short-term loans and
advances |
514.200 |
486.540 |
425.760 |
|
(f) Other current assets |
6.280 |
3.130 |
2.310 |
|
Total
Current Assets |
4,091.150 |
3,454.730 |
3,083.370 |
|
|
|
|
|
|
TOTAL |
10,919.580 |
11,403.920 |
10,544.710 |
PROFIT & LOSS
ACCOUNT
|
|
PARTICULARS |
31.03.2013 |
31.03.2012 |
31.03.2011 |
|
|
|
SALES |
|
|
|
|
|
|
|
Income |
6604.170 |
6942.350 |
4935.110 |
|
|
|
Other Income |
63.080 |
49.570 |
59.580 |
|
|
|
TOTAL (A) |
6667.250 |
6991.920 |
4994.690 |
|
|
|
|
|
|
|
|
Less |
EXPENSES |
|
|
|
|
|
|
|
Cost of materials consumed |
2725.980 |
2945.770 |
2246.580 |
|
|
|
Purchases of Stock-in-trade |
0.000 |
0.000 |
37.970 |
|
|
|
Changes in inventories of finished goods and work-in-progress |
(115.480) |
161.500 |
(170.740) |
|
|
|
Employee benefits expense |
701.760 |
556.860 |
526.950 |
|
|
|
Other expenses |
1447.980 |
1444.040 |
1071.310 |
|
|
|
Exceptional Items |
484.330 |
218.490 |
31.540 |
|
|
|
TOTAL (B) |
5244.570 |
5326.660 |
3743.610 |
|
|
|
|
|
|
|
|
Less |
PROFIT
BEFORE INTEREST, TAX, DEPRECIATION AND AMORTISATION (A-B) (C) |
1422.680 |
1665.260 |
1251.080 |
|
|
|
|
|
|
|
|
|
Less |
FINANCIAL
EXPENSES (D) |
598.780 |
640.320 |
412.380 |
|
|
|
|
|
|
|
|
|
|
PROFIT
BEFORE TAX, DEPRECIATION AND AMORTISATION (C-D) (E) |
823.900 |
1024.940 |
838.700 |
|
|
|
|
|
|
|
|
|
Less/ Add |
DEPRECIATION/
AMORTISATION (F) |
490.620 |
424.230 |
381.880 |
|
|
|
|
|
|
|
|
|
|
PROFIT BEFORE
TAX (E-F) (G) |
333.280 |
600.710 |
456.820 |
|
|
|
|
|
|
|
|
|
Less |
TAX (H) |
78.240 |
59.910 |
13.890 |
|
|
|
|
|
|
|
|
|
|
PROFIT AFTER TAX
(G-H) (I) |
255.040 |
540.800 |
442.930 |
|
|
|
|
|
|
|
|
|
Add |
PREVIOUS
YEARS’ BALANCE BROUGHT FORWARD |
214.640 |
214.140 |
278.870 |
|
|
|
|
|
|
|
|
|
Less |
APPROPRIATIONS |
|
|
|
|
|
|
|
Transfer to General Reserve |
30.000 |
100.000 |
100.000 |
|
|
|
Interim Dividend on Equity Shares |
0.000 |
0.000 |
49.320 |
|
|
|
Proposed Dividend on Equity Shares |
41.000 |
99.000 |
49.320 |
|
|
|
Dividend Tax |
7.000 |
16.00 |
15.500 |
|
|
BALANCE CARRIED
TO THE B/S |
391.68 |
214.640 |
214.140 |
|
|
|
|
|
|
|
|
|
|
EARNINGS IN
FOREIGN CURRENCY |
|
|
|
|
|
|
|
Export Earnings |
5818.080 |
5572.230 |
3463.030 |
|
|
TOTAL EARNINGS |
5818.080 |
5572.230 |
3463.030 |
|
|
|
|
|
|
|
|
|
|
IMPORTS |
|
|
|
|
|
|
|
Raw Materials |
1925.550 |
1698.750 |
1171.560 |
|
|
|
Capital Goods |
14.310 |
35.590 |
9.050 |
|
|
|
Stores & Spares |
7.460 |
2.630 |
3.490 |
|
|
TOTAL IMPORTS |
1947.320 |
1736.970 |
1184.100 |
|
|
|
|
|
|
|
|
|
|
Earnings Per
Share (Rs.) |
|
|
|
|
|
|
Basic |
15.52 |
32.90 |
26.94 |
|
|
|
Diluted |
15.52 |
32.90 |
26.37 |
|
KEY RATIOS
|
PARTICULARS |
|
31.03.2013 |
31.03.2012 |
31.03.2011 |
|
PAT / Total Income |
(%) |
3.83
|
7.73
|
8.86 |
|
|
|
|
|
|
|
Net Profit Margin (PBT/Sales) |
(%) |
5.05
|
8.65
|
9.25 |
|
|
|
|
|
|
|
Return on Total Assets (PBT/Total Assets} |
(%) |
3.20
|
5.73
|
4.64 |
|
|
|
|
|
|
|
Return on Investment (ROI) (PBT/Networth) |
|
0.07
|
0.13
|
0.11 |
|
|
|
|
|
|
|
Debt Equity Ratio (Total Debt /Networth) |
|
1.06
|
0.94
|
1.01 |
|
|
|
|
|
|
|
Current Ratio (Current Asset/Current Liability) |
|
0.81
|
0.79
|
0.79 |
FINANCIAL ANALYSIS
[all figures are
in Rupees Millions]
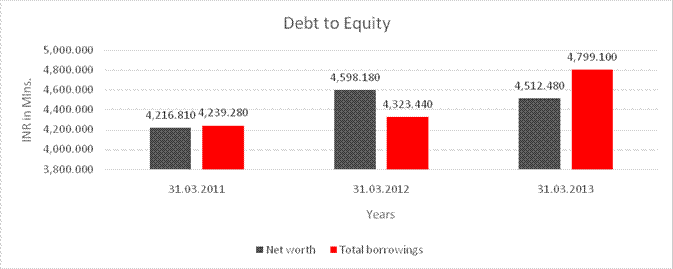
DEBT EQUITY RATIO
|
Particular |
31.03.2011 |
31.03.2012 |
31.03.2013 |
|
|
(INR
in Mlns.) |
(INR
in Mlns.) |
(INR
in Mlns.) |
|
Share Capital |
164.400 |
164.4 |
164.400 |
|
Reserves & Surplus |
4052.41 |
4433.78 |
4348.08 |
|
Net
worth |
4,216.810 |
4,598.180 |
4,512.480 |
|
|
|
|
|
|
long-term borrowings |
2,325.870 |
2,268.770 |
2196.270 |
|
Short term borrowings |
1,913.410 |
2,054.670 |
2,602.830 |
|
Total
borrowings |
4,239.280 |
4,323.440 |
4,799.100 |
|
Debt/Equity
ratio |
1.005 |
0.940 |
1.064 |
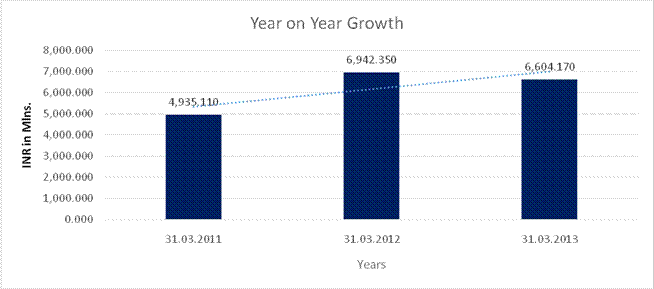
YEAR-ON-YEAR GROWTH
|
Year
on Year Growth |
31.03.2011 |
31.03.2012 |
31.03.2013 |
|
|
(INR
in Mlns) |
(INR
in Mlns) |
(INR
in Mlns) |
|
Sales |
4,935.110 |
6,942.350 |
6,604.170 |
|
|
|
40.673 |
(4.871) |
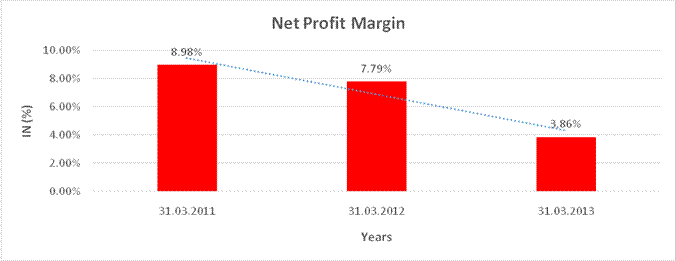
NET PROFIT MARGIN
|
Net
Profit Margin |
31.03.2011 |
31.03.2012 |
31.03.2013 |
|
|
(INR
in Mlns) |
(INR
in Mlns) |
(INR
in Mlns) |
|
Sales |
4,935.110 |
6,942.350 |
6,604.170 |
|
Profit After Tax |
442.930 |
540.800 |
255.040 |
|
|
8.98% |
7.79% |
3.86% |
LOCAL AGENCY FURTHER INFORMATION
|
Sr. No. |
Check List by Info
Agents |
Available in Report (Yes / No) |
|
1] |
Year of Establishment |
Yes |
|
2] |
Locality of the firm |
Yes |
|
3] |
Constitutions of the firm |
Yes |
|
4] |
Premises details |
No |
|
5] |
Type of Business |
Yes |
|
6] |
Line of Business |
Yes |
|
7] |
Promoter's background |
Yes |
|
8] |
No. of employees |
Yes |
|
9] |
Name of person contacted |
Yes |
|
10] |
Designation of contact person |
Yes |
|
11] |
Turnover of firm for last three years |
Yes |
|
12] |
Profitability for last three years |
Yes |
|
13] |
Reasons for variation <> 20% |
---------------------- |
|
14] |
Estimation for coming financial year |
No |
|
15] |
Capital in the business |
Yes |
|
16] |
Details of sister concerns |
Yes |
|
17] |
Major suppliers |
No |
|
18] |
Major customers |
No |
|
19] |
Payments terms |
No |
|
20] |
Export / Import details (if applicable) |
No |
|
21] |
Market information |
---------------------- |
|
22] |
Litigations that the firm / promoter involved in |
Yes |
|
23] |
Banking Details |
Yes |
|
24] |
Banking facility details |
Yes |
|
25] |
Conduct of the banking account |
---------------------- |
|
26] |
Buyer visit details |
---------------------- |
|
27] |
Financials, if provided |
Yes |
|
28] |
Incorporation details, if applicable |
Yes |
|
29] |
Last accounts filed at ROC |
Yes |
|
30] |
Major Shareholders, if available |
Yes |
|
31] |
Date of Birth of Proprietor/Partner/Director, if available |
No |
|
32] |
PAN of Proprietor/Partner/Director, if available |
No |
|
33] |
Voter ID No of Proprietor/Partner/Director, if available |
No |
|
34] |
External Agency Rating, if available |
Yes |
LITIGATION DETAILS
|
LITIGATION DETAILS |
||||||||
|
Bench:- Bombay |
||||||||
|
Lodging No:- |
ITXAL/2450/2010 |
Failing Date:- |
06.12.2010 |
Reg. No.:- |
ITXAL/6966/2010 |
Reg. Date:- |
31.12.2010 |
|
|
Petitioner:- |
THE COMMISSIONER OF INCOME TAX – 3 |
Respondent:- |
HIKAL LIMITED |
|||||
|
Petn.Adv:- |
P. S. SAHADEVAN |
|||||||
|
District:- |
MUMBAI |
|||||||
|
Bench:- |
DIVISION |
Category:- |
TAX APPEALS |
|||||
|
Status:- |
Admitted (Unready) |
Stage:- |
FOR ADMISSION – FRESH |
|||||
|
Last Date:- |
19.11.2012 |
|||||||
|
Last Coram:- |
HON’BLE SHRI JUSTICE J.P. DEVADHAR HON;BLE SHRI JUSTICE M.S. SANKLECHA |
|||||||
|
Act:- |
Income Tax Act, 1961 |
|||||||
BACKGROUND
Subject was incorporated as a public limited Company on 08 July 1988 having its registered office at 717/718, Maker Chamber V, Nariman Point, Mumbai 21.
The Company is engaged in the manufacturing of various chemical intermediates, specialty chemicals, Active pharma ingredients and Contracts Research activities.
The Company is operating in the crop protection and pharmaceuticals space.
EXPORTS
Exports for the year increased to Rs. 5818 million (80% of total sales) from Rs. 5572 million (70% of total sales) in the previous year; an increase of 61% versus the last fiscal year. . This is due to the new customers added in overseas geographies and domestic customers for products that are re-exported.
OPERATIONS
CROP PROTECTION
DIVISION:
Their Crop Protection division revenues are primarily driven from contract manufacturing products for multinational innovator companies. The past year saw a volume increase of a fungicide produced for a major European multinational company. An intermediate for the same customer produced at their Mahad facility has grown in volume and based on future forecasts given by the customer, they expect it to grow further.
They have added two customers for commercial manufacturing which is expected to commence next year. The lab trials for these molecules have been completed. They worked on multiple late stage research projects for Japanese Crop Protection companies which are expected to fructify over the next two years. It will lead to additional revenues in the Crop Protection division. They are currently working on an intermediate to be manufactured at their Mahad facility for the Japanese market. It is a solvent for the electronic chemical market with extremely stringent quality requirements. The success of this project along with others has opened up a new market in the fast growing specialty chemicals field for the company.
They have invested incrementally in debottlenecking their plants at
Taloja and Mahad to cater to the additional demand of their customers. Going forward, they are focusing on maximum
capacity utilization at their manufacturing facilities which will improve their
profitability. They have successfully completed Safety, Health and Environment
audits with their multinational customers who have
reinforced their high standards and quality systems. This should lead to
additional business in the years to come. In addition, they have invested in
increasing the capacity of their R and D personnel and equipment at their
Taloja plant which focuses on process improvements and new product development.
The on-patent molecule that they are contract manufacturing for a European
multinational innovator customer has grown substantially over last year’s
volume. Based on their customer’s forecast, they expect that this molecule will
further grow as their customer’s registration gets approved in new markets for
this new generation product.
PHARMACEUTICAL
DIVISION:
They pharmaceutical division recorded a turnover of Rs. 3,716 millions as compared to Rs. 4,477 millions in the previous year, a decline of 17%. While they managed to successfully diversify the geographies in which we sell and their customer base, much of the decline in revenues was due to delayed orders of products from their existing customers and the decline in selling prices. They have signed a long term contract manufacturing agreement with a European innovator customer to commercially manufacture pharmaceutical products for human health. Commercial production of one of these large volume products has commenced late last year and they expect the benefit of full ramp up in 2014. They have also completed the validation of another important API for this customer and they expect commercial production to also commence in 2014. These products will be contract manufactured exclusively for this customer through a technology transfer process as it is one of their largest molecules. The benefits of this agreement will reap rewards over the next few years as they mutually expand the relationship encompassing additional services and products. During the year they signed another manufacturing agreement with a specialty US based food Ingredient Company. The long term manufacturing agreement is for a specialty food ingredient product manufactured under pharmaceutical grade conditions. Commercial supplies have begun and they expect to ramp up to full production in the upcoming year. This new business is a diversification in terms of products and customers that the company has traditionally garnered. They have completed the validation of a new molecule for an important Japanese customer through a technology transfer. This product will be registered by the customer and they expect to start production once all the regulatory approvals are completed in 2014. This is an important step for the company as they have been operating in the Japanese market for over a decade and have had varied levels of success on the commercial manufacturing side. They expect this commercial manufacturing business to expand over the next few years in Japan as they have an established track record of supplying products in line with the expectations of their customers on specifications and quality. Some of their existing API''s that have been manufactured over a period of time are experiencing both stable volumes and prices. As there are fewer competitors, they expect these molecules to diversify the current product pipeline while serving as a business development tool for adding newer customers. Hikal has a valuable role to play by providing options across the pharmaceutical value chain from early stage support on research to flexible manufacturing solutions on the commercial scale. The past year they have diversified their customers and geographies. This has brought along a larger product portfolio which is less dependent on a few major products as has been seen in the past. Additionally new regulated capacity in terms of the Panoli site has increased their offerings and services. They should see these factors drive growth for the division in the years to come.
AWARDS
During the year, the company received the following awards:
Aditya Birla Award for the “Best Responsible Care Company” in India.
US FDA audit and approval of second pharmaceutical manufacturing site in Panoli.
Japanese Pharmaceutical and Medical Devices Authority (PMDA) approval at their Panoli and Jigani Pharmaceutical.
MANAGEMENT DISCUSSION AND ANALYSIS REPORT
PHARMACEUTICAL MARKET
2012 has been a year mixed year for the Pharmaceutical Industry where the per capita cost and use of medicines declined worldwide. The global pharmaceutical industry is expected to surpass the $1 trillion mark, which is a milestone in itself led by the growth in emerging markets. While the developed markets are expected to have moderate returns, focus is on the emerging nations such as Brazil, India, Russia, Mexico, Indonesia, China, South Africa and Turkey to drive incremental sales.
The pharmaceutical industry is influenced by economic factors which are heavily dependent on government policy
Decisions on spending. While 2012 was a volatile year for the global markets, 2013 is showing signs of a steady recovery on a macroeconomic front. The US market which is the largest pharmaceutical market by volume and revenues, relied heavily on the new government policy, primarily healthcare reform. This is expected to reshape the way in which medicines are purchased, sold and reimbursed hence, directly affecting the sales of pharmaceuticals. Japan and Western Europe which remain the 2 and 3 largest markets after the U.S. are expected to be flat.
Combined growth in global spending annually is forecasted to more than double by 2016 to as much as $70 billion, up from a $30-billion pace in 2012, driven by volume increases in the emerging markets and attributed slightly to the developed nations. Government spending in emerging markets are expected to increase from $194 billion in 2011 to between $345 billion and $375 billion by 2016, or $91 in drug spending per capita. These increases will be driven by rising incomes, continued low cost for drugs, and government-sponsored programs designed to increase access to treatments. Generic drugs and other products, including over-the-counter medicines will account for major portion of that increase. In the emerging markets, China is expected to reach $161 billion by 2016, Brazil's $47 billion, India's $29 billion, and Russia's $27 billion. The global pharmaceutical industry is likely to experience a return to earnings growth in 2013 as fewer top-selling drugs lose their patent protection compared with last year, and a further earnings growth in 2014 is also anticipated as the negative effects of the patent cliff recede.
These growth levels pose a significant opportunity for companies such as Hikal to partner with its existing customer base to meet the increased opportunities on volumes and new products.
PHARMACEUTICALS – OPERATIONAL PERFORMANCE
The pharmaceutical division recorded a turnover of Rs.3,716 millions as compared to Rs.4,477 millions in the previous year, a decline of 17%. While they managed to successfully diversify the geographies in which they sell and their customer base, much of the decline in revenues was due to delayed orders of products from their existing customers and the decline in selling prices.
One of their leading API products grew by approximately 4% last year globally. However, due to some destocking by some of their major customers combined with a slight decline in prices, lower than expected revenues were realised for the division. Their R&D has developed new and improved processes for some API's which will help reduce the manufacturing cost and make more competitive. These processes are not only commercially beneficial but also have a greener footprint which is in line with the companies' goal and objectives on sustainability. In the long run they expect to consolidate their market share and effectively increase it with a “leaner and greener” process.
They have signed a long term contract manufacturing agreement with a European innovator customer to commercially manufacture pharmaceutical products for human health. Commercial production of one of these large volume products has commenced late last year and they expect the benefit of full ramp up in 2014. they have also completed the validation of another important API for this customer and they expect commercial production to also commence in 2014. These products will be contract manufactured exclusively for this customer through a technology transfer process as it is one of their largest molecules. The benefits of this agreement will reap rewards over the next few years as they mutually expand the relationship encompassing additional services and products.
During the year they signed another manufacturing agreement with a Speciality US based food ingredient company. The long term manufacturing agreement is for a speciality food ingredient product manufactured under pharmaceutical grade conditions. Commercial supplies have begun and they expect to ramp up to full production in the upcoming year. This new business is a diversification in terms of products and customers that the company has traditionally garnered. They have completed the validation of a new molecule for an important Japanese customer through a technology transfer.
This product will be registered by the customer and they expect to start production once all the regulatory approvals are completed in 2014. This is an important step for the company as they have been operating in the Japanese market for over a decade and have had varied levels of success on the commercial manufacturing side. They expect this commercial manufacturing business to expand over the next few years in Japan as they have an established track record of supplying products in line with the expectations of their customers on specifications and quality. Some of their existing API's that have been manufactured over a period of time are experiencing both stable volumes and prices. As there are fewer competitors, they expect these molecules to diversify the current product pipeline while serving as a business development tool for adding newer customers. Their animal health API which is contract manufactured for a leading innovator company is growing in volume. This is an exclusive contract for the company manufactured at a dedicated facility. Larger volumes will help increase the product profitability going forward.
On the regulatory front, they achieved two significant milestones. Their Panoli manufacturing facility received and passed its first US FDA audit successfully. It is a great accomplishment for the company from a regulatory, quality, environment, and health and safety perspective. It bears testimony to the high standards that they uphold. From a business perspective it diversifies and de-risks their manufacturing base and offers their customers two facilities with an increased range of capabilities, services and manufacturing options that they have to offer. Both their pharmaceutical manufacturing sites were audited and approved by the Japanese Pharmaceutical and Medical Devices Authority (PMDA) to commercially supply products to the Japanese market. This accomplishment now opens up a new avenue for further growth and opportunities for the company.
During the year, they received multiple audits from their existing and new customers who categorize the company as a preferred supplier. As the industry has witnessed multiple quality and regulatory issues in this past year, the focus of many companies has been on ensuring the best standards are being met by third party suppliers. The company won the Aditya Birla award for the “Best Responsible Care” chemical company in India last year which has been very well received by their existing and potential customers. It also reinforces the highest standards that are followed and maintained at Hikal. Overall, although the pharmaceutical division has recorded a dip in sales, the future outlook for the company is bright.
Some of the pharmaceutical industry's main markets are under pressure. North America, Europe and Japan which jointly account for a majority of the global sales are experiencing a slowdown in value growth. The industry continues to brace itself for some fundamental changes in the marketplace and is looking at newer ways to drive growth. Further, higher R&D costs, a relatively dry pipeline for new drugs, increasing pressure from payers and providers for reduced healthcare costs and a host of other factors are putting pressure on global pharmaceutical companies. These companies are looking for new ways to boost drug discovery potential, reduce time to market and reduce costs along the whole value chain.
This is where Hikal has a valuable role to play by providing options across the pharmaceutical value chain from early stage support on research to flexible manufacturing solutions on the commercial scale. The past year they have diversified customers and geographies. This has brought along a larger product portfolio which is less dependent on a few major products as has been seen in the past. Additionally new regulated capacity in terms of the Panoli site has increased their offerings and services. They should see these factors drive growth for the division in the years to come.
.
CROP PROTECTION MARKET
In 2012, the global crop protection market is estimated to have increased by 6.4% to reach $47.3 billion. The trend of improved crop prices witnessed in 2011 continued into 2012 creating a situation of strong growth during the year, resulting in an 8.9% increase in real terms over the previous year. As one can see in the below chart (figure 1), the market has recorded growth over the past two years which is expected to continue in the future.
Some of the key factors influencing the global agrochemical market have been increased crop commodity prices. The rise in crop prices has however has not been constant. There have been effects reflecting the impact of weather on crop production in some years, increased import demand for grain and use of crops for biofuel, all of which have impacted grain supply and demand. Between 2010 and up to the end of 2012 prices of commodities have again begun to increase, resulting in higher volume demand for agrochemicals.
In addition to the increase in commodity prices, another major contributory factor within the last three years has been the significant change in global glyphosate prices. Over the past few years, China had created an oversupply situation which has now eased leading to some price improvements in the past year.
Some other factors contributing to the growth of the global agrochemical market are the strength of the farm economy in Latin America, particularly in Brazil, as well as the increasing use of crops for biofuel. Genetically Modified (GM) seed technology continues to have a growing influence on the market. The last two years have resulted in high single digit growth. If they were to analyses 2012, Latin America had improved crop prices particularly because of the weakening Brazilian Real and increased GM seed uptake in the region. Europe sustained its cereal and rapeseed prices. In the U.S. market there was stability in glyphosate prices and high corn, soybean and rice realisations. Asia experienced increasing grain demand in China and South East regions as well a strong rice price. All these factors put together resulted in buoyant sales for the Crop Protection Industry in 2012.
CROP PROTECTION - OPERATIONAL PERFORMANCE
In 2012, the revenues of the crop protection division increased substantially by 17% to Rs.2,888 millions as compared to Rs. 2,465 millions in the prior year. The increase in sales was primarily due to the larger off take of existing products and new products that were commercialized from the R and D phase.
Their crop protection division revenues are primarily driven from contract and custom manufacturing products for multinational innovator companies. The on-patent molecules that they contract manufacture for an European multinational innovator customer has grown substantially in volume terms as customer has received new registration approvals across the world. Thiabendazole (TBZ), a fungicide for which they have a dedicated manufacturing facility at their Taloja site, is doing well. The volume has been steadily increasing over the past few years and they expect it to further increase next year as new markets are penetrated, which in turn will considerably improve the plant utilization. This fungicide has additional uses in animal health which is also a growing market allied to the crop protection division.
Their efforts in Japan continue to yield results. They have successfully completed multiple late phase research projects which are likely to be commercialized over the next 18 - 24 months. They have completed a pilot trial of a fungicide for a large multinational Japanese company at their Mahad site and they expect the commercial quantities to be supplied during the financial year. They have completed a commercial scale order for a speciality chemical for another Japanese customer which is expected to ramp up in the next few months from their Mahad site. This is a speciality large volume product which will lead to additional opportunities. For an existing customer in Japan, they have completed scale up studies for a new product which is expected to be commercialised in the near future. Two additional products for a leading Agrochemical company in Japan are undergoing scale up studies at their research and pilot plant facilities. These products will add to the commercial pipeline for the Crop Protection division in the near future. They have undergone and successfully completed EHS and Quality audits of Global Multinational Companies, including.
Japan which has reinforced their high standards and quality systems. This is a key requirement for sustainable business in future as well. They continue to target some of the global customers in the US market who are looking for established, quality manufacturers of Advanced Intermediates and Active Ingredients. Some of the potential customers have visited and audited their facilities and they have a good chance to add them into their fold as new customers.
This past year they have not only added products, but also increased their business development efforts in Europe, US and particularly Japan. These efforts have begun to yield results which are visible through the increased number molecules under evaluation in the pipeline and several successful products in the commercialisation phase. As the Crop protection market grows, they expect Hikal's revenues, capacity utilisation and profitability to increase over the next few years.
FUTURE OUTLOOK
The contract manufacturing industry continues to grow at a steady pace, driven by cost pressures, stringent regulatory requirements and patent expires. The highly competitive nature of the industry has been driving consolidation and companies are increasingly off shoring to emerging markets such as India to reduce costs. As a result, companies in key outsourcing destinations have been improving their manufacturing infrastructure which in turn is increasing their global competitiveness. India as a manufacturing and research service industry is driven by cost competitiveness, robust chemistry capabilities supported by a talent pool of skilled professionals and R&D infrastructure. As an industry, they have been able to leverage this capability in research chemistry, especially in the areas of analytical chemistry and compound synthesis.
As a company, Hikal has developed robust capabilities in process chemistry, analytical chemistry, process development and scale up capabilities for clinical and commercial API's for the pharmaceutical industry and AI's for the crop protection industry. They offer strong regulatory compliance, significant cost improvement advantages while delivering the same quality product and specification manufactured by their customers. The opportunity for the company is significant given the fact that globally there is a shift of towards companies with capabilities such as Hikal in India.
UNSECURED
LOANS
|
Particular |
31.03.2013 (Rs. in Millions) |
31.03.2012 (Rs. in Millions) |
||||||||||||||||||||||||||||
|
Long term Borrowing |
|
|
||||||||||||||||||||||||||||
|
Term loans from banks and others |
58.250 |
50.000 |
||||||||||||||||||||||||||||
|
Deferred sales
tax liability |
3.720 |
4.980 |
||||||||||||||||||||||||||||
|
|
|
|
||||||||||||||||||||||||||||
|
Short term Borrowing |
|
|
||||||||||||||||||||||||||||
|
Loans repayable on demand Inter corporate deposits |
|
|
||||||||||||||||||||||||||||
|
From related parties |
59.450 |
43.50 |
||||||||||||||||||||||||||||
|
From others |
445.500 |
160.000 |
||||||||||||||||||||||||||||
|
Total |
566.920 |
258.480 |
||||||||||||||||||||||||||||
|
Notes : Long term Borrowing
|
||||||||||||||||||||||||||||||
UNAUDITED FINANCIAL RESULTS FOR THE QUARTER
AND NINE MONTHS ENDED DECEMBER 31, 2013
Rs. In Millions
|
Particular |
Unaudited |
Quarter |
Nine Months Ended |
|
|
2013 |
2013 |
2013 |
|
Sales / income from operations |
2180.100 |
2048.000 |
6059.600 |
|
Less: Excise duty |
15.900 |
20.1000 |
42.800 |
|
Net sales / income
from operations |
2164.200 |
2027.900 |
6016.800 |
|
Total expenditure |
|
|
|
|
a) Cost of materials and utilities consumed |
1370.000 |
1113.900 |
3515.600 |
|
b) Purchases of stock- in- trade |
0.000 |
0.000 |
0.000 |
|
c) Change in inventories of finished goods and work in progress |
(162.000) |
(54.600) |
(180.600) |
|
d) Employee benefits expense |
211.500 |
193.300 |
594.500 |
|
e) Depreciation and amortisation expenses |
140.000 |
138.000 |
411.800 |
|
f) Other expenses |
244.100 |
294.400 |
682.500 |
|
Total
expenditure |
1803.600 |
1685.000 |
5023.800 |
|
Profit from
operations before other income, interest and impact of forward contracts |
360.600 |
342.900 |
993.000 |
|
Other Income |
-- |
6.500 |
337.600 |
|
Profit Before
Interest and impact of forward contracts |
360.600 |
349.400 |
1330.600 |
|
Finance cost |
129.800 |
137.400 |
417.700 |
|
Profit from
ordinary activities before tax and impact of forward contracts |
230.800 |
212.000 |
912.900 |
|
- Exchange loss (Refer note no. 3 below) |
79.100 |
17.500 |
98.600 |
|
- Reversal of cash flow hedge reserve |
-- |
-- |
-- |
|
Profit from
ordinary activities before tax |
151.700 |
194.500 |
814.300 |
|
Provision for taxation |
|
|
|
|
- Current taxes |
31.700 |
40.800 |
170.600 |
|
- Minimum Alternatives Tax credit |
(15.00) |
(40.800) |
(153.900) |
|
- Deferred tax |
32.200 |
53.300 |
187.400 |
|
Net Profit after
tax |
102.800 |
141.200 |
610.200 |
|
Paid-up equity share capital |
1644 |
1644 |
1644 |
|
Reserves excluding revaluation reserves |
|
|
|
|
Earnings per share
( face value Rs. 10/-) |
|
|
|
|
- Basic |
6.25 |
8.59 |
37.12 |
|
- Diluted |
6.25 |
8.59 |
37.12 |
|
- Cash |
14.77 |
14.77 |
14.77 |
|
A. PARTICULARS OF
HOLDINGS |
|
|
|
|
Public shareholding |
|
|
|
|
- No of shares |
5124398 |
5124398 |
5124398 |
|
- Percentage of shareholding |
31.17% |
31.17% |
31.17% |
|
Promoters and promoter group shareholding |
|
|
|
|
a) Pledged / Encumbered |
|
|
|
|
- No of shares |
|
|
|
|
- Percentage of shares (as a % of the total shareholding of promoters and promoter group) |
|
|
|
|
- Percentage of shares (as a % of the total share capital of the company) |
|
|
|
|
b) Non-encumbered |
|
|
|
|
- No of shares |
11315702 |
11315702 |
11315702 |
|
- Percentage of shares (as a % of the total shareholding of promoters and promoter group) |
100.00% |
100.00% |
100.00% |
|
- Percentage of shares (as a % of the total share capital of the company) |
68.83% |
68.83% |
68.83% |
|
|
|
|
|
|
|
|
|
|
|
B) INVESTOR COMPLAINTS |
31.12.2013 |
|
|
|
Pending at the beginning of the quarter |
Nil |
|
|
|
Received during the quarter |
Nil |
|
|
|
Disposed of during the quarter |
Nil |
|
|
|
Remaining unresolved at the end of the quarter |
Nil |
|
|
1.
The
above results were reviewed by the Audit Committee and approved by the Board of
Directors at their meeting on February 6, 2014
2. The Board of Directors have declared interim dividend of 20% (Rs.2/- per
equity share of the face value of Rs.10/-each ) (Previous Year Rs. Nil ) .
3. The Company has entered into swap contracts (previous year including options
and forward contracts) against long term loans which will mature year on year
up to August 2015. The Company is of the opinion that the "Mark to Market”
loss on these transactions represent un realised losses that are notional
in nature. The mark to market loss as on December 31, 2013 on these
swap contracts is Rs. 1,59.800 millions, out of which amount of Rs. 60.000
millions is charged to Profit and Loss account. The un provided mark to market
loss as on December 31, 2013 on these swap contracts not recognised in profit
and loss amounts to Rs. 99.800 millions (Previous year as on
December 31, 2012 Rs. 2,10.400 millions). Further, due to volatility in
foreign currency rates in the quarter December, 2012 unprovided
exchange difference on outstanding short term working capital loans was
Rs.32.100 millions, which is Rs. Nil as on December 31,2013.
4. The Company at its extra ordinary general meeting held on May 17,2013
decided to cancel / rescind the ESOP Scheme. Consequently, Rs
330.600 millions in the trust was received by the Company and accounted as
other income. This will ensure compliance of the SEBI circular no
CIR/CFD/DIL/3/2013 dated January 17, 2013.
5. The results for
the quarter ended December 31, 2013 have been subjected to a "Limited
Review" by the Statutory Auditors of the Company.
FIXED ASSETS
·
Freehold
Land
·
Leasehold land
·
Building
·
Plant
and Machinery
·
Electrical installation
·
Office
Equipments
·
Furniture
and Fixtures
·
Vehicles
·
Ships
AS PER WEBSITE
DETAILS
PRESS RELEASE:
Q1 Results – FY 2013-14,
Net profit up by 618% at Rs. 366.000 millions
Mumbai, August 7,
2013: Hikal Limited, the preferred long-term partner for leading global
life sciences companies, announced its financial results for the first quarter
ended 30th June, 2013.
Performance
highlights for the Quarter ended 30th June, 2013
• Net sales up by 10.4% to Rs. 1825.000 millions as
compared to Rs. 1653.000 millions
in the corresponding quarter of the previous year.
• Pharmaceutical sales up by 23.8 % to Rs.
1188.000 millions as compared to Rs. 960.000 millions in the corresponding
quarter of the previous year.
• Crop protection sales down by 8.1% to Rs.
637.000 millions as compared to Rs. 693.000 millions in the corresponding quarter of the previous year.
• Net Profit was up by 618 % at Rs. 366.000
millions as compared to Rs. 51.000 millions in the
corresponding quarter of the previous year as the company received income
of Rs. 328.000 millions which is
due to cancellation / rescind of the ESOP scheme in compliance with SEBI
guidelines. The net profit was Rs.14 crore from operations
increased by 175% as compared to 5.1 crore in the corresponding quarter of
the previous year.
Commenting on the
results, Jai Hiremath, Chairman and Managing Director, Hikal Limited.
said, “they have had a good
start to this financial year. Their revenues are up by 10.4 % to Rs. 1825.000 millions as compared to the
corresponding quarter of the previous year. Thei pharmaceutical business has
grown significantly by 23.8 % this quarter due to the increased demand from their existing
customers as well as their new customers
added in the past year. The Crop protection business forecast is positive from their customers for the
remaining part of this financial year. The exchange loss on account of past foreign
exchange hedges is behind us and they expect positive results in the quarters to come.”
ABOUT HIKAL:
Hikal is a
reliable long-term partner to companies in the Pharmaceuticals, Crop
Protection, and Specialty Chemicals industry. The company is in the business of
supplying research services, active ingredients and intermediates, manufactured
using stringent global quality standards, for its global customers. Hikal’s
advanced manufacturing facilities have been inspected and approved by leading
multinational companies in the Crop protection and Pharmaceutical sectors. The
Crop protection facilities are located at Taloja and Mahad (Maharashtra).
Hikal’s R and D facilities are located at Pune and Bangalore. The
Pharmaceutical manufacturing facilities are situated in Jigani (Bangalore) and
Panoli (Gujarat), respectively.
SAFE HARBOR
STATEMENT:
Statements in this
document relating to future status, events, or circumstances, including but not
limited to statements about plans and objectives, the progress and results of
research and development, potential product characteristics and uses, product
sales potential and target dates for product launch are forward-looking
statements based on estimates and the anticipated effects of future events on
current and developing circumstances Such statements are subject to numerous
risks and uncertainties and are not necessarily predictive of future results.
Actual results may differ materially from those anticipated in the
forward-looking statements.The company assumes no obligation to update
forward-looking statements to reflect actual results, changed assumptions or
other factors.
CMT REPORT [Corruption, Money Laundering
& Terrorism]
The Public Notice
information has been collected from various sources including but not limited
to: The Courts, India Prisons Service, Interpol, etc.
1] INFORMATION ON DESIGNATED PARTY
No exist designating subject or any of its
beneficial owners, controlling shareholders or senior officers as terrorist or
terrorist organization or whom notice had been received that all financial
transactions involving their assets have been blocked or convicted, found
guilty or against whom a judgement or order had been entered in a proceedings
for violating money-laundering, anti-corruption or bribery or international
economic or anti-terrorism sanction laws or whose assets were seized, blocked,
frozen or ordered forfeited for violation of money laundering or international
anti-terrorism laws.
2] Court Declaration :
No records exist
to suggest that subject is or was the subject of any formal or informal
allegations, prosecutions or other official proceeding for making any
prohibited payments or other improper payments to government officials for
engaging in prohibited transactions or with designated parties.
3] Asset Declaration :
No records exist to suggest that the
property or assets of the subject are derived from criminal conduct or a
prohibited transaction.
4] Record on Financial Crime :
Charges or conviction registered
against subject: None
5] Records on Violation of
Anti-Corruption Laws :
Charges or investigation
registered against subject: None
6] Records on Int’l Anti-Money
Laundering Laws/Standards :
Charges or investigation
registered against subject: None
7] Criminal Records
No available information exist that suggest
that subject or any of its principals have been formally charged or convicted
by a competent governmental authority for any financial crime or under any
formal investigation by a competent government authority for any violation of
anti-corruption laws or international anti-money laundering laws or standard.
8] Affiliation with Government :
No record exists to suggest that any
director or indirect owners, controlling shareholders, director, officer or
employee of the company is a government official or a family member or close
business associate of a Government official.
9] Compensation Package :
Our market survey revealed that the amount
of compensation sought by the subject is fair and reasonable and comparable to
compensation paid to others for similar services.
10] Press Report :
No
press reports / filings exists on the subject.
CORPORATE GOVERNANCE
MIRA INFORM as
part of its Due Diligence do provide comments on Corporate Governance to
identify management and governance. These factors often have been predictive
and in some cases have created vulnerabilities to credit deterioration.
Our Governance Assessment
focuses principally on the interactions between a company’s management, its
Board of Directors, Shareholders and other financial stakeholders.
CONTRAVENTION
Subject is not
known to have contravened any existing local laws, regulations or policies that
prohibit, restrict or otherwise affect the terms and conditions that could be
included in the agreement with the subject.
FOREIGN EXCHANGE RATES
|
Currency |
Unit
|
Indian Rupees |
|
US Dollar |
1 |
Rs.60.27 |
|
UK Pound |
1 |
Rs.101.10 |
|
Euro |
1 |
Rs.83.74 |
INFORMATION DETAILS
|
Information
Gathered by : |
PRT |
|
|
|
|
Report Prepared
by : |
SNT |
SCORE & RATING EXPLANATIONS
|
SCORE FACTORS |
RANGE |
POINTS |
|
HISTORY |
1~10 |
6 |
|
PAID-UP CAPITAL |
1~10 |
6 |
|
OPERATING SCALE |
1~10 |
6 |
|
FINANCIAL CONDITION |
|
|
|
--BUSINESS SCALE |
1~10 |
6 |
|
--PROFITABILIRY |
1~10 |
6 |
|
--LIQUIDITY |
1~10 |
5 |
|
--LEVERAGE |
1~10 |
5 |
|
--RESERVES |
1~10 |
5 |
|
--CREDIT LINES |
1~10 |
5 |
|
--MARGINS |
-5~5 |
- |
|
DEMERIT POINTS |
|
|
|
--BANK CHARGES |
YES/NO |
YES |
|
--LITIGATION |
YES/NO |
YES |
|
--OTHER ADVERSE INFORMATION |
YES/NO |
NO |
|
MERIT POINTS |
|
|
|
--SOLE DISTRIBUTORSHIP |
YES/NO |
NO |
|
--EXPORT ACTIVITIES |
YES/NO |
NO |
|
--AFFILIATION |
YES/NO |
YES |
|
--LISTED |
YES/NO |
YES |
|
--OTHER MERIT FACTORS |
YES/NO |
YES |
|
--DEFAULTER |
|
|
|
--RBI |
YES/NO |
NO |
|
--EPF |
YES/NO |
NO |
|
TOTAL |
|
48 |
This score serves as
a reference to assess SC’s credit risk and to set the amount of credit to be
extended. It is calculated from a composite of weighted scores obtained from
each of the major sections of this report. The assessed factors and their
relative weights (as indicated through %) are as follows:
Financial condition (40%) Ownership background (20%) Payment
record (10%)
Credit history (10%) Market trend (10%) Operational
size (10%)
RATING EXPLANATIONS
|
RATING |
STATUS |
PROPOSED CREDIT LINE |
|
|
>86 |
Aaa |
Possesses an extremely sound financial base with the strongest capability
for timely payment of interest and principal sums |
Unlimited |
|
71-85 |
Aa |
Possesses adequate working capital. No caution needed for credit
transaction. It has above average (strong) capability for payment of interest
and principal sums |
Large |
|
56-70 |
A |
Financial & operational base are regarded healthy. General
unfavourable factors will not cause fatal effect. Satisfactory capability for
payment of interest and principal sums |
Fairly Large |
|
41-55 |
Ba |
Overall operation is considered normal. Capable to meet normal
commitments. |
Satisfactory |
|
26-40 |
B |
Capability to overcome financial difficulties seems comparatively
below average. |
Small |
|
11-25 |
Ca |
Adverse factors are apparent. Repayment of interest and principal sums
in default or expected to be in default upon maturity |
Limited with
full security |
|
<10 |
C |
Absolute credit risk exists. Caution needed to be exercised |
Credit not
recommended |
|
- |
NB |
New Business |
- |
This report is issued at your request without any
risk and responsibility on the part of MIRA INFORM PRIVATE LIMITED (MIPL)
or its officials.
\