MIRA INFORM REPORT
|
Report Date : |
17.04.2014 |
IDENTIFICATION DETAILS
|
Name : |
NAVIN FLUORINE INTERNATIONAL LIMITED |
|
|
|
|
Registered
Office : |
2nd Floor, Sunteck Centre, |
|
|
|
|
Country : |
|
|
|
|
|
Financials (as
on) : |
31.03.2013 |
|
|
|
|
Date of
Incorporation : |
25.06.1998 |
|
|
|
|
Com. Reg. No.: |
11-115499 |
|
|
|
|
Capital
Investment / Paid-up Capital : |
Rs. 97.572
Millions |
|
|
|
|
CIN No.: [Company Identification
No.] |
L24110MH1998PLC115499 |
|
|
|
|
TAN No.: [Tax Deduction &
Collection Account No.] |
MUMP14428B |
|
|
|
|
PAN No.: [Permanent Account No.] |
AABCP0464B |
|
|
|
|
Legal Form : |
A Public Limited Liability Company. The Company’s Shares are Listed on
the Stock Exchanges. |
|
|
|
|
Line of Business
: |
Manufacturing and Selling of Chemicals. |
|
|
|
|
No. of Employees
: |
Information declined by management |
RATING & COMMENTS
|
MIRA’s Rating : |
A (60) |
|
RATING |
STATUS |
PROPOSED CREDIT LINE |
|
|
56-70 |
A |
Financial & operational base are regarded healthy. General
unfavourable factors will not cause fatal effect. Satisfactory capability for
payment of interest and principal sums |
Fairly Large |
|
Maximum Credit Limit : |
USD 20380000 |
|
|
|
|
Status : |
Good |
|
|
|
|
Payment Behaviour : |
Regular |
|
|
|
|
Litigation : |
Clear |
|
|
|
|
Comments : |
Subject is a well-established company having fine track record. There appears sharp dip in profitability of the company during the
financial year 2013. However, the rating reflects well-established position of the company
in the fluorochemicals industry supported by comfortable financial risk
profile and adequate liquidity position. Trade relations are reported as fair. Business is active. Payments are
reported to be regular and as per commitments. The company can be considered good for normal business dealings at
usual trade terms and conditions. |
NOTES :
Any query related to this report can be made
on e-mail : infodept@mirainform.com
while quoting report number, name and date.
INDIAN ECONOMIC OVERVIEW
US investment bank
Goldman Sachs has upgraded its outlook on Indian markets as it expects
positive impact of the election cycle.
India’s economy may
grow 4.7 % in the current financial year, lower than the official estimate of
4.9 %, Fitch Rating said. The global rating agency expects the economy to pick
up in the next two financial years.
Global ratings
agency Standard & Poor said increasing focus by India Inc on lowering debt
is likely to improve their credit profiles.
Singapore (1.1
million Indian tourists in 2012), Thailand (one million), the United Arab
Emirates ().98 million) and Malaysia ().82 million) emerged as the preferred
holidays hotspots for Indians. The total figure is expected to increase to 1.93
million by 2017, according to the latest Eurmonitor international report.
There is a $29.34 bn
outward foreign direct investment by domestic companies between April and
January of 2013/14 which has seen some signs of recovery according to a Care
Ratings report.
There are 264 number
of new companies being set up every day on average during 2014. Most of them
are registered in Mumbai. India had 1.38 million registered companies at the
end of January, 2014.
Twitter like
messaging service Weibo Corporation has filed to raise $ 500 million via a US initial
public offering. Alibaba, which owns a stake in Weibo is expected to raise
about $ 15 billion New York this year in the highest profile Internet IPO since
Facebook’s in 2012.
Bharti Airtel has
raised Rs.2,453.2 crore (350 million Swiss Francs) by selling six-year bonds at
a coupon rate of three per cent and maturing in 2020. This is the largest ever
bond offering by an Indian company in Swiss Francs. Bharat Petroleum
Corporation raised 175 million Swiss Francs by selling five year bonds at 2.98
% coupon rate in February.
Indian Oil
Corporation plans to invest Rs 7650 crore in setting up a petrochemical complex
at its almost complete Paradip refinery in Odhisha in three to four years. The
company board is set to consider the setting up of a 700000 tonne per annum
polypropylene plant at an estimated cost at Rs.3150 crore.
Global chief
information officers at gathering in Bangalore in April to meet Indian startups
at an event called Tech50 Watchout for Little Eye Labs-Facebook type deals in
the making.
EXTERNAL AGENCY RATING
|
Rating Agency Name |
CARE |
|
Rating |
Long term bank facilities: “AA” |
|
Rating Explanation |
High degree of safety and very low credit risk. |
|
Date |
10.09.2013 |
|
Rating Agency Name |
CARE |
|
Rating |
Short term bank facilities: “A1+” |
|
Rating Explanation |
Very strong degree of safety and lowest credit risk. |
|
Date |
10.09.2013 |
RBI DEFAULTERS’ LIST STATUS
Subject’s name is not enlisted as a defaulter
in the publicly available RBI Defaulters’ list.
EPF (Employee Provident Fund) DEFAULTERS’ LIST STATUS
Subject’s name is not enlisted as a defaulter
in the publicly available EPF (Employee Provident Fund) Defaulters’ list as of
31-03-2012.
INFORMATION DECLINED
MANAGEMENT NON-COOPERATIVE (Tel. No.: 91-22-66509999)
LOCATIONS
|
Registered Office : |
2nd Floor, Sunteck Centre, |
|
Tel. No.: |
91-22-66509999/ 24043300 |
|
Fax No.: |
91-22-66509800 |
|
E-Mail : |
|
|
Website : |
|
|
|
|
|
Factory 1 : |
P. O. Bhestan, Udhana – Navsari Road, Surat – 395023, Gujarat, India |
|
Tel. No.: |
91-261-2890325 |
|
Fax No.: |
91-261-2890288 |
|
E-Mail : |
|
|
|
|
|
Factory 2 : |
New Industrial Area, |
|
Tel. No.: |
91-727-2403015 |
|
Fax No.: |
91-727-2259362 |
|
E-Mail : |
|
|
|
|
|
International Office : |
Global Head of Business Development – Crams |
|
Tel. No.: |
1908-243-0159 |
|
Fax No.: |
1908-704-9150 |
|
E-mail : |
|
|
|
|
|
Sales Office : |
Located At: · Mumbai · Kolkata · Chennai · New Delhi · Surat · Hyderabad · New Jersey |
DIRECTORS
As on 31.03.2013
|
Name : |
Mr. Hrishikesh A. Mafatlal |
|
Designation : |
Chairman |
|
Date of Birth/ Age: |
58 Years |
|
Expertise in functional
areas : |
He is an Industrialist having diversified experience of more than 35 years in the areas of Textiles, Chemicals, Petrochemicals, Financial Services etc |
|
Date of Appointment : |
25.06.1998 |
|
|
|
|
Name : |
Mr. T. M.M. Nambiar |
|
Designation : |
Director |
|
|
|
|
Name : |
Mr. Pradip N. Kapadia |
|
Designation : |
Director |
|
Qualification : |
B.A, LLB |
|
Date of Appointment : |
21.01.2003 |
|
|
|
|
Name : |
Mr. Sunil S. Lalbhai |
|
Designation : |
Director |
|
Qualification |
Masters in Chemistry, Economy, Planning and Policy |
|
|
|
|
Name : |
Mr. S.M. Kulkarni |
|
Designation : |
Director |
|
Date of Birth/ Age: |
74 years |
|
Qualification : |
B.E. |
|
Expertise in
functional areas : |
Corporate and Business Advisor |
|
Date of Appointment : |
19.10.2006 |
|
|
|
|
Name : |
Mr. R. Sankaran |
|
Designation : |
Director |
|
Qualification : |
Masters in Economics |
|
Date of Appointment : |
30.03.2007 |
|
Date of Cessation: |
28.02.2013 |
|
|
|
|
Name : |
Mr. V. P. Mafatlal |
|
Designation : |
Director |
|
|
|
|
Name : |
Mr. S.G. Mankad |
|
Designation : |
Director |
|
Date of Birth/ Age: |
65 Years |
|
Expertise in
functional areas : |
He is a retired IAS Officer. He was the Chief Secretary to Government of Gujarat from 2005 to 2007 and has also held important positions in Government of India (Ministries of Finance, Agriculture and Human Resource Development) and Government of Gujarat. |
|
Date of Appointment : |
29.04.2011 |
|
|
|
|
Name : |
Mr. Atul Kumar Srivastava |
|
Designation : |
Finance Director |
|
Date of Birth/ Age: |
61 Years |
|
Expertise in
functional areas : |
Finance Accounting, Taxation and Commerce |
|
Date of Appointment : |
21.01.2003 |
|
Other Directorship : |
· Mafatlal Industries Limited · Mafatlal Denim Limited |
|
|
|
|
Name : |
Mr. S.S. Khanolkar |
|
Designation : |
Managing Director |
|
Date of Appointment : |
01.01.2011 |
KEY EXECUTIVES
|
Name : |
Mr. N.B. Mankad |
|
Designation : |
Company Secretary |
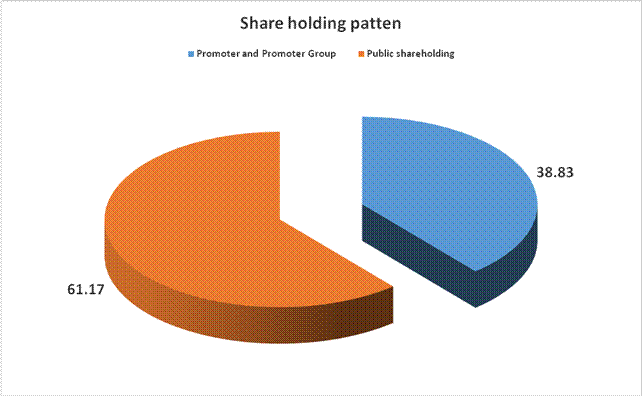
MAJOR SHAREHOLDERS / SHAREHOLDING PATTERN
As on 31.12.2013
|
Names of Shareholders |
No. of Shares |
Percentage of
Holding |
|
(A) Shareholding of Promoter and Promoter Group |
|
|
|
|
|
|
|
|
484841 |
4.97 |
|
|
3240508 |
33.20 |
|
|
65145 |
0.67 |
|
|
65145 |
0.67 |
|
|
3790494 |
38.83 |
|
|
|
|
|
Total shareholding of Promoter and Promoter Group (A) |
3790494 |
38.83 |
|
(B) Public Shareholding |
|
|
|
|
|
|
|
|
292279 |
2.99 |
|
|
5076 |
0.05 |
|
|
681761 |
6.98 |
|
|
979116 |
10.03 |
|
|
|
|
|
|
588669 |
6.03 |
|
|
|
|
|
|
3577483 |
36.65 |
|
|
728115 |
7.46 |
|
|
97220 |
1.00 |
|
|
57228 |
0.59 |
|
|
1206 |
0.01 |
|
|
38786 |
0.40 |
|
|
4991487 |
51.14 |
|
Total Public shareholding (B) |
5970603 |
61.17 |
|
Total (A)+(B) |
9761097 |
100.00 |
|
(C) Shares held by Custodians and against which Depository Receipts
have been issued |
|
|
|
|
0 |
0.00 |
|
|
0 |
0.00 |
|
|
0 |
0.00 |
|
Total (A)+(B)+(C) |
9761097 |
100.00 |
Shareholding of securities (including shares, warrants, convertible
securities) of persons belonging to the category Promoter and Promoter Group
|
Sl.No. |
Name of the
Shareholder |
Details of Shares held |
|
|
No. of Shares held |
As a % |
||
|
1 |
Mafatlal Impex Private Limited |
10,85,193 |
11.12 |
|
2 |
Suremi Trading Private Limited |
6,46,081 |
6.62 |
|
3 |
Nocil Limited |
5,66,340 |
5.80 |
|
4 |
Suremi Trading Private Limited |
3,37,879 |
3.46 |
|
5 |
Mafatlal Exim Private Limited |
3,24,484 |
3.32 |
|
6 |
Mafatlal Industries Limited |
1,89,964 |
1.95 |
|
7 |
Gayatri Pestichem Mfg Private Limited |
44,610 |
0.46 |
|
8 |
Arvi Associates Private Limited |
25,672 |
0.26 |
|
9 |
Mafatlal Impex Private Limited |
10,255 |
0.11 |
|
10 |
Pamil Investments Private Limited |
6,486 |
0.07 |
|
11 |
Sushripada Investments Private Limited |
3,414 |
0.03 |
|
12 |
Sumil Holding Private Limited |
20 |
0.00 |
|
13 |
Milap Texchem Private Limited |
20 |
0.00 |
|
14 |
Milekha Texchem Company Private Limited |
20 |
0.00 |
|
15 |
Shamir Texchem Texchem Private Limited |
20 |
0.00 |
|
16 |
Shripad Associates Private Limited |
50 |
0.00 |
|
17 |
Hrishikesh Arvind Mafatlal |
1,83,937 |
1.88 |
|
18 |
Vishad Padmanabh Mafatlal |
1,11,433 |
1.14 |
|
19 |
Vishad P.Mafatlal Pam Huf1 P Mafatlal |
910 |
0.01 |
|
20 |
Sheth Mafatlal Gagalbhai Foundation Trustno 2 |
786 |
0.01 |
|
21 |
Sheth Mafatlal Gagalbhai Foundation Trustno.3 |
786 |
0.01 |
|
22 |
Sheth Mafatlal Gagalbhai Foundation Trust No 10 |
786 |
0.01 |
|
23 |
Sheth Mafatlal Gagalbhai Foundation Trust No 9 |
786 |
0.01 |
|
24 |
Sheth Mafatlal Gagalbhai Foundation Trust No22 |
786 |
0.01 |
|
25 |
Sheth Mafatlal Gagalbhai Foundation Trust No 20 |
786 |
0.01 |
|
26 |
Sheth Mafatlal Gagalbhai Foundation Trust No 5 |
786 |
0.01 |
|
27 |
Sheth Mafatlal Gagalbhai Foundation Trust No 7 |
786 |
0.01 |
|
28 |
Shri Hrishikesh Arvind Mafatlal Public Charitable Trust No.1 |
786 |
0.01 |
|
29 |
Shri Arvind N Mafatlal Public Charitable Trust |
786 |
0.01 |
|
30 |
Shri Arvind N Mafatlal Public Charitable Trust No.2 |
786 |
0.01 |
|
31 |
Shri Padmanabh Arvind Mafatlal Public Charitable Trust No.1 |
786 |
0.01 |
|
32 |
Shri Padmanabh Arvind Mafatlal Public Charitable Trust No.2 |
786 |
0.01 |
|
33 |
Shri Padmanabh Arvind Mafatlal Public Charitable Trust No.3 |
786 |
0.01 |
|
34 |
Navinchandra Mafatlal Charity Trust No 11 |
786 |
0.01 |
|
35 |
Navinchandra Mafatlal Charity Trust No 2 |
786 |
0.01 |
|
36 |
Navinchandra Mafatlal Charity Trust No 3 |
786 |
0.01 |
|
37 |
Navinchandra Mafatlal Charity Trust No 6 |
786 |
0.01 |
|
38 |
Navinchandra Mafatlal Charity Trust No 12 |
786 |
0.01 |
|
39 |
Navinchandra Mafatlal Charity Trust No 13 |
786 |
0.01 |
|
40 |
Navinchandra Mafatlal Charity Trust No 15 |
786 |
0.01 |
|
41 |
Shri Pransukhlal Charity Trust No 3 |
786 |
0.01 |
|
42 |
Shri Pransukhlal Charity Trust No 2 |
786 |
0.01 |
|
43 |
Navinchandra Mafatlal Charity Trust No 4 |
786 |
0.01 |
|
44 |
Navinchandra Mafatlal Charity Trust No 7 |
786 |
0.01 |
|
45 |
Navinchandra Mafatlal Charity Trust No 14 |
786 |
0.01 |
|
46 |
Navinchandra Mafatlal Charity Trust No 5 |
786 |
0.01 |
|
47 |
Shri Arvind N Mafatlal Public Charitable Trust No.3 |
786 |
0.01 |
|
48 |
Shri Padmanabh Arvind Mafatlal Public Charitable Trust No.4 |
786 |
0.01 |
|
49 |
Shri Padmanabh Arvind Mafatlal Public Charitable Trust No.5 |
786 |
0.01 |
|
50 |
Navinchandra Mafatlal Charity Trust No 9 |
786 |
0.01 |
|
51 |
Sheth Mafatlal Gagalbhai Foundation Trust No 12 |
786 |
0.01 |
|
52 |
Sheth Mafatlal Gagalbhai Foundation Trust No 13 |
786 |
0.01 |
|
53 |
Sheth Mafatlal Gagalbhai Foundation Trust No 6 |
786 |
0.01 |
|
54 |
Shri Hrishikesh Arvind Mafatlal Public Charitable No.2 |
786 |
0.01 |
|
55 |
Sheth Mafatlal Gagalbhai Foundation Trust No 8 |
786 |
0.01 |
|
56 |
Shri Hrishikesh Arvind Mafatlal Public Charitable Trust No.3 |
786 |
0.01 |
|
57 |
Shri Hrishikesh Arvind Mafatlal Public Charitable Trust No.4 |
786 |
0.01 |
|
58 |
Shri Hrishikesh Arvind Mafatlal Public Charitable Trust No.5 |
786 |
0.01 |
|
59 |
Seth Mafatlal Gagalbhai Foundation Trust No 11 |
786 |
0.01 |
|
60 |
Shri Arvind N Mafatlal Public Charitable Trust No.4 |
786 |
0.01 |
|
61 |
Shri Arvind N Mafatlal Public Charitable Trust No.5 |
786 |
0.01 |
|
62 |
Shri Arvind N Mafatlal Public Charitable Trust No.6 |
786 |
0.01 |
|
63 |
Shri Pransukhlal Charity Trust No 5 |
786 |
0.01 |
|
64 |
Shri Pransukhlal Charity Trust No 4 |
786 |
0.01 |
|
65 |
Shri Hrishikesh Arvind Mafatlal Public Charitable Trust No.6 |
786 |
0.01 |
|
66 |
Seth Mafatlal Gagalbhai Foundation Trust N0.4 |
786 |
0.01 |
|
67 |
Navinchandra Mafatlal Charity Trust N0 8 |
786 |
0.01 |
|
68 |
Navinchandra Mafatlal Charity Trust N0 10 |
786 |
0.01 |
|
69 |
Shri Arvind N Mafatlal Public Charitable Trust No.7 |
786 |
0.01 |
|
70 |
Seth Mafatlal Gagalbhai Foundation Trust N0 14 |
786 |
0.01 |
|
71 |
Seth Mafatlal Gagalbhai Foundation Trust N0 17 |
786 |
0.01 |
|
72 |
Seth Mafatlal Gagalbhai Foundation Trust N0 16 |
786 |
0.01 |
|
73 |
Shri Arvind N Mafatlal Public Charitable Trust No.8 |
786 |
0.01 |
|
74 |
Sheth Mafatlal Gagalbhai Foundation Trust No.19 |
786 |
0.01 |
|
75 |
Shri Pransukhlal Charity Trust No 6 |
786 |
0.01 |
|
76 |
Sheth Mafatlal Gagalbhai Foundation Trust No 21 |
786 |
0.01 |
|
77 |
Sheth Mafatlal Gagalbhai Foundation Trust No 15 |
786 |
0.01 |
|
78 |
Shri Pransukhlal Charity Trust |
786 |
0.01 |
|
79 |
Shri Padmanabh Arvind Mafatlal Public Chartiable Trust No.6 |
786 |
0.01 |
|
80 |
Sheth Mafatlal Gagalbhai Foundation Trust No 18 |
786 |
0.01 |
|
81 |
Mrs Sushila Arvind Mafatlal Public Charitable Trust No.1 |
624 |
0.01 |
|
82 |
Mrs Sushila Arvind Mafatlal Public Charitable Trust No.2 |
624 |
0.01 |
|
83 |
Mrs Sushila Arvind Mafatlal Public Charitable Trust No.3 |
624 |
0.01 |
|
84 |
Vishad Padmanabh Mafatlal Public Charitable Trust No.1 |
624 |
0.01 |
|
85 |
Mrs Rekha Hrishikesh Mafatlal Public Charitable Trust No.1 |
624 |
0.01 |
|
86 |
Mrs Rekha Hrishikesh Mafatlal Public Charitable Trust No.2 |
624 |
0.01 |
|
87 |
Mrs Rekha Hrishikesh Mafatlal Public Charitable Trust No.3 |
624 |
0.01 |
|
88 |
Mrs Rekha Hrishikesh Mafatlal Public Charitable Trust No.4 |
624 |
0.01 |
|
89 |
Mrs Rekha Hrishikesh Mafatlal Public Charitable Trust No.5 |
624 |
0.01 |
|
90 |
Mrs Sushila Arvind Mafatlal Public Charitable Trust No.4 |
624 |
0.01 |
|
91 |
Mrs.Sushila Arvind Mafatlal Public Charitable Trust No.5 |
624 |
0.01 |
|
92 |
Mrs Miloni Padmanabh Mafatlal Public Charitable Trust No.1 |
624 |
0.01 |
|
93 |
Mrs Miloni Padmanabh Mafatlal Public Charitable Trust No.2 |
624 |
0.01 |
|
94 |
Mrs Miloni Padmanabh Mafatlal Public Charitable Trust No.3 |
624 |
0.01 |
|
95 |
Vishad P Mafatlal Public Charitable Trust N0.4 |
624 |
0.01 |
|
96 |
Mrs Miloni Padmanabh Mafatlal Public Charitable Trust No.4 |
624 |
0.01 |
|
97 |
Vishad Padmanbh Mafatlal Public Charitable Trust N0.3 |
624 |
0.01 |
|
98 |
Vishad Padmanbh Mafatlal Public Charitable Trust N0.2 |
624 |
0.01 |
|
99 |
Shri Padmakesh Public Charity Trust No 4 |
542 |
0.01 |
|
100 |
Shri Padmakesh Public Charity Trust No 3 |
542 |
0.01 |
|
101 |
Shri Padmakesh Public Charity Trust No 2 |
542 |
0.01 |
|
102 |
Shri Padmakesh Public Charity Trust No 1 |
542 |
0.01 |
|
103 |
Shri Rishipad Public Charity Trust N0 3 |
542 |
0.01 |
|
104 |
Shri Rishipad Public Charity Trust N0 2 |
542 |
0.01 |
|
105 |
Shri Rishipad Public Charity Trust N0 4 |
542 |
0.01 |
|
106 |
Shri Rishipad Public Charity Trust N0.1 |
542 |
0.01 |
|
107 |
Mrs.Vijayalaxmi Navinchandra Mafatlal Public Charit Trust No.16 |
393 |
0.00 |
|
108 |
Mrs Vijayalaxmi Navinchandra Mafatlal Public Charity Trust No.19 |
393 |
0.00 |
|
109 |
Mrs Vijayalaxmi Navinchandra Mafatlal Public Charitable Trust No.20 |
393 |
0.00 |
|
110 |
Maithiliben N Desai |
256 |
0.00 |
|
111 |
Mrs Miloni Padmanabh Mafatlal Public Charitable Trust No.5 |
196 |
0.00 |
|
112 |
Arvind N Mafatlal |
1,49,420 |
1.53 |
|
113 |
A.N. Mafatlal Karta Of A.N.M. Huf 4 Mafatlal |
11,170 |
0.11 |
|
114 |
Aarti Hrishikesh Mafatlal |
5,024 |
0.05 |
|
115 |
Hrishikesh Arvind Mafatlal |
4,490 |
0.05 |
|
116 |
Rekha Hrishikesh Mafatlal |
3,772 |
0.04 |
|
117 |
Maithili N Desai |
3,303 |
0.03 |
|
118 |
P.A.Mafatlal As Karta Of P.A.M. Huf 1 Mafatlal |
2,910 |
0.03 |
|
119 |
Anjali Hrishikesh Mafatlal |
1,998 |
0.02 |
|
120 |
Aarti Manish Chadha |
1,830 |
0.02 |
|
121 |
Anjali Kunal Agarwal |
1,830 |
0.02 |
|
122 |
Priyavrat Hrishikesh Mafatlal |
1,829 |
0.02 |
|
123 |
Sushilaben Arvind Prasad Mafatlal |
594 |
0.01 |
|
124 |
Chetna Padmanabh Mafatlal |
203 |
0.00 |
|
125 |
Priyavrat Hrishikesh Mafatlal |
188 |
0.00 |
|
|
Total |
37,90,494 |
38.83 |
Shareholding of
securities (including shares, warrants, convertible securities) of persons
belonging to the category Public and holding more than 1% of the total number
of shares
|
Sl. No. |
Name of the
Shareholder |
No. of Shares held |
Shares as % |
|
|
1 |
Atyant Capital Management Limited A/ Atyant |
405751 |
4.16 |
|
|
2 |
Reliance Capital Trustee Company -A/C |
279651 |
2.86 |
|
|
3 |
Ajay Shivnarain Upadhyaya |
200000 |
2.05 |
|
|
4 |
Bluebell Clothing Pvt Ltd |
154070 |
1.58 |
|
|
5 |
Ghi Ltp Ltd |
127370 |
1.30 |
|
|
|
Total |
1166842 |
11.95 |
|
BUSINESS DETAILS
|
Line of Business : |
Manufacturing and Selling of Chemicals. |
PRODUCTION STATUS AS ON 31.03.2011
|
Particulars |
Unit |
Actual
Production |
|
Synthetic Cryolite, Aluminium Flooride and Fluorocarbon
Gases |
MT |
8823 |
|
Miscellaneous Fluorides |
MT |
20244 |
|
Total |
|
29067 |
GENERAL INFORMATION
|
No. of Employees : |
Information declined by management |
|||||||||||||||
|
|
|
|||||||||||||||
|
Bankers : |
· State Bank of Hyderabad · AXIS Bank Limited ·
HDFC Bank Limited |
|||||||||||||||
|
|
|
|||||||||||||||
|
Facilities : |
NOTE Cash credit and buyers’ credit from banks are secured by
hypothecation of certain stocks and book debts of the Company, both present
and future and second charge created / to be created on all the fixed assets
of the company situated at Bhestan and certain fixed assets at Dewas. |
|
Banking
Relations : |
-- |
|
|
|
|
Auditors : |
|
|
Name : |
Deloitte Haskins and Sells Chartered Accountants |
|
Address : |
Mumbai, Maharashtra, India |
|
|
|
|
Solicitors: |
Vigil Juris |
|
|
|
|
Enterprises over which
key management personnel and their relatives are able to exercise significant
influence: |
· Mafatlal Industries Limited · Mafatlal Fabrics Private Limited · NOCIL Limited · Seth Navinchandra Mafatlal Foundation Trust · Sri Sadguru Seva Sangh Trust |
|
|
|
|
Associate: |
Mafatlal Denim Limited |
CAPITAL STRUCTURE
As on 31.03.2013
Authorised Capital :
|
No. of Shares |
Type |
Value |
Amount |
|
|
|
|
|
|
35,000,000 |
Equity Shares |
Rs.10/- each |
Rs. 350.000 Millions |
|
|
|
|
|
Issued, Subscribed & Paid-up Capital :
|
No. of Shares |
Type |
Value |
Amount |
|
|
|
|
|
|
9,761,097 |
Equity Shares |
Rs.10/- each |
Rs. 97.611
Millions |
|
|
Less: Call in arrears |
|
Rs. 0.039
Million |
|
|
|
|
|
|
|
TOTAL |
|
Rs. 97.572 Millions |
NOTE
a.
Reconciliation of
the shares outstanding at the beginning and at the end of the reporting period
|
Particulars |
Opening Balance |
Buy Back |
Closing Balance |
|
Equity shares with voting rights |
|
|
|
|
Year ended 31st
March, 2013 |
|
|
|
|
– Number of
shares |
9761097 |
-- |
9761097 |
|
– Amount (Rs. in
Millions) |
97.611 |
-- |
97.611 |
b. Terms / rights
attached to equity shares:
The Company has only one class of equity shares having a par value of Rs. 10/- per share. Each equity shareholder is entitled to one vote per share. The Company declares and pays dividends in Indian rupees. The dividend proposed by the Board of directors is subject to the approval of the shareholders in the ensuing Annual General Meeting.
During the year ended 31 March, 2013, the amount of dividend, per share, recognized as distributions to equity shareholders is Rs. 15/- (year ended 31 March, 2012, Rs. 75/-)
c. Details of
shareholders holding more than 5% shares in the company:
|
Equity shares of
Rs. 10/- each fully paid |
31st March, 2013 |
|
|
Name |
Nos. |
% Holding |
|
Mafatlal Impex Private Limited |
1,085,193 |
11.12 |
|
Suremi Trading Private Limited |
646,081 |
6.62 |
|
NOCIL Limited |
566,340 |
5.80 |
d. For details of
shares reserved for issue under the employee stock option (ESOP) plan of the
company
e. During the period
of five years immediately preceding the reporting date:
|
Particulars |
As at 31 March, 2013 |
As at 31 March, 2012 |
As at 31 March, 2011 |
As at 31 March, 2010 |
As at 31 March, 2009 |
|
Equity shares bought back by the company |
-- |
-- |
338,792 |
-- |
-- |
Pursuant to the decision of the Board of Directors of the Company taken in its meeting dated 24 September, 2010, the Company bought back 338,792 equity shares of nominal value of Rs. 10/- each at a price of Rs. 400/- per share for an aggregate value of Rs. 135.517 Millions during 2010-11 under Section 77A of the Companies Act, 1956 through tender offer by utilising the Share premium account to the extent of Rs. 1,321.29 lacs. The Capital redemption reserve was created out of General reserve for Rs. 3.388 Millions being the nominal value of shares thus bought back. All the equity shares bought back were extinguished by 5 March, 2011.
f. Calls unpaid (by
other than officers and directors)
|
Particulars |
As at 31 March, 2013 |
|
7,891 (previous year 8,307) equity shares of Rs. 10/- each, Rs. 5/- called up but unpaid |
0.039 |
g. Out of the rights issue made in 2004-05, 109 equity shares could not be offered on rights basis due to the non-availability of details of beneficial holders from depositories. The same are kept in abeyance.
FINANCIAL DATA
[all figures are
in Rupees Millions]
ABRIDGED BALANCE
SHEET
|
SOURCES OF FUNDS |
31.03.2013 |
31.03.2012 |
31.03.2011 |
|
I.
EQUITY
AND LIABILITIES |
|
|
|
|
(1)Shareholders'
Funds |
|
|
|
|
(a) Share Capital |
97.572 |
97.569 |
97.568 |
|
(b) Reserves & Surplus |
4,997.060 |
4,736.151 |
3,220.468 |
|
(c) Money
received against share warrants |
0.000 |
0.000 |
0.000 |
|
|
|
|
|
|
(2)
Share Application money pending allotment |
0.000 |
0.000 |
0.000 |
|
Total Shareholders’
Funds (1) + (2) |
5,094.632 |
4,833.720 |
3,318.036 |
|
|
|
|
|
|
(3) Non-Current
Liabilities |
|
|
|
|
(a) long-term borrowings |
0.000 |
0.000 |
0.000 |
|
(b) Deferred tax liabilities (Net) |
325.646 |
286.392 |
191.397 |
|
(c) Other long term
liabilities |
204.959 |
201.405 |
276.785 |
|
(d) long-term
provisions |
33.958 |
28.351 |
22.425 |
|
Total Non-current
Liabilities (3) |
564.563 |
516.148 |
490.607 |
|
|
|
|
|
|
(4) Current Liabilities |
|
|
|
|
(a) Short term
borrowings |
832.392 |
933.439 |
490.740 |
|
(b) Trade
payables |
501.488 |
451.537 |
552.364 |
|
(c) Other
current liabilities |
123.886 |
101.832 |
130.040 |
|
(d) Short-term
provisions |
97.294 |
765.329 |
154.915 |
|
Total Current
Liabilities (4) |
1,555.060 |
2,252.137 |
1,328.059 |
|
|
|
|
|
|
TOTAL |
7,214.255 |
7,602.005 |
5,136.702 |
|
|
|
|
|
|
II.
ASSETS |
|
|
|
|
(1) Non-current assets |
|
|
|
|
(a) Fixed
Assets |
|
|
|
|
(i)
Tangible assets |
2,295.665 |
2,354.598 |
1,717.754 |
|
(ii)
Intangible Assets |
9.076 |
9.913 |
8.998 |
|
(iii)
Capital work-in-progress |
87.064 |
52.304 |
322.369 |
|
(iv)
Intangible assets under development |
0.000 |
0.000 |
0.000 |
|
(b) Non-current Investments |
1,651.789 |
1,859.420 |
477.606 |
|
(c) Deferred tax assets (net) |
0.000 |
0.000 |
0.000 |
|
(d) Long-term Loan and Advances |
518.109 |
459.168 |
1,029.863 |
|
(e) Other
Non-current assets |
0.000 |
0.000 |
0.000 |
|
Total Non-Current
Assets |
4,561.703 |
4,735.403 |
3,556.590 |
|
|
|
|
|
|
(2) Current assets |
|
|
|
|
(a)
Current investments |
814.618 |
190.000 |
0.000 |
|
(b)
Inventories |
719.322 |
840.161 |
551.020 |
|
(c) Trade
receivables |
708.455 |
623.935 |
577.950 |
|
(d) Cash
and cash equivalents |
274.656 |
1,050.218 |
174.117 |
|
(e)
Short-term loans and advances |
124.117 |
112.140 |
261.374 |
|
(f) Other
current assets |
11.384 |
50.148 |
15.651 |
|
Total
Current Assets |
2,652.552 |
2,866.602 |
1,580.112 |
|
|
|
|
|
|
TOTAL |
7,214.255 |
7,602.005 |
5,136.702 |
PROFIT & LOSS
ACCOUNT
|
|
PARTICULARS |
31.03.2013 |
31.03.2012 |
31.03.2011 |
|
|
|
SALES |
|
|
|
|
|
|
|
Income |
5,246.937 |
7,038.585 |
4,307.404 |
|
|
|
Other Income |
138.525 |
910.053 |
103.874 |
|
|
|
TOTAL (A) |
5,385.462 |
7,948.638 |
4,411.278 |
|
|
|
|
|
|
|
|
Less |
EXPENSES |
|
|
|
|
|
|
|
Cost of Materials Consumed |
2,478.866 |
2,519.651 |
1,703.284 |
|
|
|
Purchases of Stock-in-Trade |
61.986 |
55.709 |
32.182 |
|
|
|
Changes in inventories of finished goods, work-in-progress
and Stock-in-Trade |
(1.476) |
(107.379) |
(19.326) |
|
|
|
Employees benefits expense |
441.619 |
408.757 |
297.891 |
|
|
|
Other expenses |
1,461.599 |
1,664.788 |
1,165.992 |
|
|
|
TOTAL (B) |
4,442.594 |
4,541.526 |
3,180.023 |
|
|
|
|
|
|
|
|
|
PROFIT/
(LOSS) BEFORE INTEREST, TAX,
DEPRECIATION AND AMORTISATION (A-B) (C) |
942.868 |
3,407.112 |
1,231.255 |
|
|
|
|
|
|
|
|
|
Less |
FINANCIAL
EXPENSES (D) |
60.974 |
35.419 |
35.958 |
|
|
|
|
|
|
|
|
|
|
PROFIT
/ (LOSS) BEFORE TAX, DEPRECIATION AND AMORTISATION (C-D) (E) |
881.894 |
3,371.693 |
1,195.297 |
|
|
|
|
|
|
|
|
|
Less/ Add |
DEPRECIATION/
AMORTISATION (F) |
196.117 |
177.342 |
135.445 |
|
|
|
|
|
|
|
|
|
|
PROFIT/
(LOSS) BEFORE TAX (E-F)
(G) |
685.777 |
3,194.351 |
1,059.852 |
|
|
|
|
|
|
|
|
|
Less |
TAX (H) |
254.144 |
881.995 |
343.414 |
|
|
|
|
|
|
|
|
|
|
PROFIT/
(LOSS) AFTER TAX (G-H) (I) |
431.633 |
2,312.356 |
716.438 |
|
|
|
|
|
|
|
|
|
Add |
PREVIOUS
YEARS’ BALANCE BROUGHT FORWARD |
2551.820 |
1322.309 |
850.210 |
|
|
|
|
|
|
|
|
|
Less |
APPROPRIATIONS |
|
|
|
|
|
|
|
Transfer to General Reserve |
43.200 |
232.000 |
71.650 |
|
|
|
Interim Dividend |
73.208 |
82.969 |
65.649 |
|
|
|
Proposed Final Dividend |
73.208 |
63.447 |
82.969 |
|
|
|
Proposed Special Dividend |
0.000 |
585.666 |
0.000 |
|
|
|
Corporate Dividend Tax |
24.318 |
118.763 |
24.071 |
|
|
BALANCE CARRIED TO
THE B/S |
2769.519 |
2551.820 |
1322.309 |
|
|
|
|
|
|
|
|
|
|
EARNINGS IN
FOREIGN CURRENCY |
|
|
|
|
|
|
|
Export Earnings |
1357.110 |
1616.231 |
1305.103 |
|
|
|
Carbon Credits |
571.054 |
2519.001 |
783.289 |
|
|
|
Contract Research Income |
136.834 |
18.647 |
2.128 |
|
|
TOTAL EARNINGS |
2064.998 |
4153.879 |
2090.520 |
|
|
|
|
|
|
|
|
|
|
IMPORTS |
|
|
|
|
|
|
|
Raw Materials |
1459.903 |
1879.698 |
1072.059 |
|
|
|
Stores & Spares |
7.203 |
7.788 |
1.530 |
|
|
|
Capital Goods |
3.690 |
31.698 |
9.466 |
|
|
TOTAL IMPORTS |
1470.796 |
1919.184 |
1083.055 |
|
|
|
|
|
|
|
|
|
|
Earnings /
(Loss) Per Share (Rs.) |
44.22 |
236.90 |
71.11 |
|
QUARTERLY RESULTS
|
PARTICULARS |
30.06.2013 |
30.09.2013 |
31.12.2013 |
|
Type |
1st
Quarter |
2nd
Quarter |
3rd
Quarter |
|
Net Sales |
1148.500 |
998.700 |
1100.500 |
|
Total Expenditure |
969.800 |
835.200 |
969.800 |
|
PBIDT (Excl OI) |
178.700 |
163.600 |
130.700 |
|
Other Income |
63.400 |
68.000 |
30.300 |
|
Operating Profit |
242.000 |
231.600 |
161.000 |
|
Interest |
12.000 |
11.000 |
14.100 |
|
Exceptional Items |
0.000 |
0.000 |
0.000 |
|
PBDT |
230.100 |
220.500 |
146.900 |
|
Depreciation |
50.600 |
52.400 |
50.900 |
|
Profit Before Tax |
179.500 |
168.200 |
95.900 |
|
Tax |
45.500 |
45.300 |
27.500 |
|
Provisions and contingencies |
0.000 |
0.000 |
0.000 |
|
Profit After Tax |
134.000 |
122.900 |
68.400 |
|
Extraordinary Items |
0.000 |
0.000 |
0.000 |
|
Prior Period Expenses |
0.000 |
0.000 |
0.000 |
|
Other Adjustments |
0.000 |
0.000 |
0.000 |
|
Net Profit |
134.000 |
122.900 |
68.400 |
KEY RATIOS
|
PARTICULARS |
|
31.03.2013 |
31.03.2012 |
31.03.2011 |
|
PAT / Total Income |
(%) |
8.01
|
29.09
|
16.24 |
|
|
|
|
|
|
|
Net Profit Margin (PBT/Sales) |
(%) |
13.07
|
45.38
|
24.61 |
|
|
|
|
|
|
|
Return on Total Assets (PBT/Total Assets} |
(%) |
12.52
|
56.14
|
24.44 |
|
|
|
|
|
|
|
Return on Investment (ROI) (PBT/Networth) |
|
0.13
|
0.66
|
0.32 |
|
|
|
|
|
|
|
Debt Equity Ratio (Total Debt/Networth) |
|
0.16
|
0.19
|
0.15 |
|
|
|
|
|
|
|
Current Ratio (Current Asset/Current Liability) |
|
1.71
|
1.27
|
1.19 |
FINANCIAL ANALYSIS
[all figures are
in Rupees Millions]
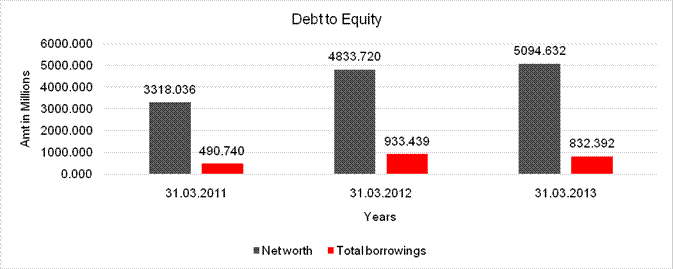
DEBT EQUITY RATIO
|
Particular |
31.03.2011 |
31.03.2012 |
31.03.2013 |
|
|
(Rs.
In Millions) |
(Rs.
In Millions) |
(Rs.
In Millions) |
|
Share Capital |
97.568 |
97.569 |
97.572 |
|
Reserves & Surplus |
3220.468 |
4736.151 |
4997.060 |
|
Net
worth |
3318.036 |
4833.720 |
5094.632 |
|
|
|
|
|
|
Long-term borrowings |
0.000 |
0.000 |
0.000 |
|
Short term borrowings |
490.740 |
933.439 |
832.392 |
|
Total
borrowings |
490.740 |
933.439 |
832.392 |
|
Debt/Equity
ratio |
0.148 |
0.193 |
0.163 |
YEAR-ON-YEAR GROWTH
|
Year
on Year Growth |
31.03.2011 |
31.03.2012 |
31.03.2013 |
|
|
(Rs.
In Millions) |
(Rs.
In Millions) |
(Rs.
In Millions) |
|
Sales |
4307.404 |
7038.585 |
5246.937 |
|
|
|
63.407 |
-25.455 |

NET PROFIT MARGIN
|
Net
Profit Margin |
31.03.2011 |
31.03.2012 |
31.03.2013 |
|
|
(Rs.
In Millions) |
(Rs.
In Millions) |
(Rs.
In Millions) |
|
Sales |
4307.404 |
7038.585 |
5246.937 |
|
Profit |
716.438 |
2312.356 |
431.633 |
|
|
16.63% |
32.85% |
8.23% |

LOCAL AGENCY FURTHER INFORMATION
CURRENT MATURITIES OF LONG TERM DEBTS
|
Particulars |
31.03.2013 (Rs.
In Millions) |
31.03.2012 (Rs.
In Millions) |
31.03.2011 (Rs.
In Millions) |
|
|
|
0.000 |
14.000 |
|
Redeemable at par Non-Convertible Debentures of Rs. 100/- each |
|
|
|
|
Unpaid dividend |
|
9.698 |
7.251 |
|
Unpaid money on buy-back of shares |
|
0.447 |
0.447 |
|
Other payables |
|
|
|
|
Statutory dues payable |
|
17.498 |
15.891 |
|
Trade / security deposits |
|
51.547 |
45.769 |
|
Advance from customers |
|
17.732 |
16.168 |
|
Provision for gratuity |
|
4.910 |
11.347 |
|
Other liabilities (secured by pledge of investments of a group company) |
|
0.000 |
19.167 |
|
Total |
NA
|
101.832 |
130.040 |
NOTE
* Zero Coupon Non-Convertible Debentures have been redeemed on 6th August 2011. (They were secured by first mortgage on the Company's immovable property at first floor of Kalpataru Point, Sion, Mumbai.)
|
Sr. No. |
Check List by Info Agents |
Available in
Report (Yes / No) |
|
1] |
Year of Establishment |
Yes |
|
2] |
Locality of the firm |
Yes |
|
3] |
Constitutions of the firm |
Yes |
|
4] |
Premises details |
No |
|
5] |
Type of Business |
Yes |
|
6] |
Line of Business |
Yes |
|
7] |
Promoter's background |
Yes |
|
8] |
No. of employees |
No |
|
9] |
Name of person contacted |
No |
|
10] |
Designation of contact
person |
No |
|
11] |
Turnover of firm for last
three years |
Yes |
|
12] |
Profitability for last
three years |
Yes |
|
13] |
Reasons for variation
<> 20% |
----- |
|
14] |
Estimation for coming
financial year |
No |
|
15] |
Capital in the business |
Yes |
|
16] |
Details of sister
concerns |
Yes |
|
17] |
Major suppliers |
No |
|
18] |
Major customers |
No |
|
19] |
Payments terms |
No |
|
20] |
Export / Import details
(if applicable) |
No |
|
21] |
Market information |
----- |
|
22] |
Litigations that the firm
/ promoter involved in |
----- |
|
23] |
Banking Details |
Yes |
|
24] |
Banking facility details |
Yes |
|
25] |
Conduct of the banking
account |
----- |
|
26] |
Buyer visit details |
----- |
|
27] |
Financials, if provided |
Yes |
|
28] |
Incorporation details, if
applicable |
Yes |
|
29] |
Last accounts filed at
ROC |
Yes |
|
30] |
Major Shareholders, if
available |
Yes |
|
31] |
Date of Birth of
Proprietor/Partner/Director, if available |
Yes |
|
32] |
PAN of
Proprietor/Partner/Director, if available |
No |
|
33] |
Voter ID No of Proprietor/Partner/Director,
if available |
No |
|
34] |
External Agency Rating,
if available |
Yes |
INDEX OF CHARGES
|
S.NO. |
CHARGE ID |
DATE OF CHARGE
CREATION/MODIFICATION |
CHARGE AMOUNT
SECURED |
CHARGE HOLDER |
ADDRESS |
SERVICE REQUEST NUMBER
(SRN) |
|
1 |
10085926 |
09/05/2012 * |
750,000,000.00 |
HDFC BANK LIMITED |
HDFC BANK HOUSESENAPATI BAPAT MARG, LOWER PAREL (WEST), MUMBAI, MAHARASHTRA - 400013, INDIA |
B39932413 |
|
2 |
10029585 |
14/06/2012 * |
750,000,000.00 |
HDFC BANK LIMITED |
HDFC BANK HOUSESENAPATI BAPAT MARG, LOWER PAREL (WEST), MUMBAI, MAHARASHTRA - 400013, INDIA |
B45328804 |
|
3 |
80016822 |
13/02/2013 * |
500,000,000.00 |
AXIS BANK LIMITED |
UNIVERSAL INSURANCE BUILDING, GRD. FLOOR., SIR P M ROAD, FORT, MUMBAI - 400001, MAHARASHTRA, INDIA |
B69781938 |
|
4 |
90145649 |
09/05/2012 * |
900,000,000.00 |
STATE BANK OF HYDERABAD |
OVERSEAS BRANCH,1204, ASHOK MAHAL, TULLOCH ROAD, COLABA, MUMBAI - 400039, MAHARASHTRA, INDIA |
B39872213 |
* Date of charge modification
UNSECURED LOANS
|
PARTICULAR |
31.03.2013 (Rs.
In Millions) |
31.03.2012 (Rs.
In Millions) |
|
SHORT TERM
BORROWINGS |
|
|
|
Commercial paper |
198.329 |
0.000 |
|
Total |
198.329 |
0.000 |
CORPORATE INFORMATION
The Company is a public limited company domiciled in India and incorporated under the provisions of the Companies Act, 1956. Its shares are listed on the Bombay, Ahmedabad and National stock exchanges. The Company belongs to the reputed Arvind Mafatlal Group in India. Established in 1967, it has the largest integrated fluorochemicals complex in India. The Company primarily focuses on fluorine chemistry, producing refrigeration gases, some basic building block fluorides and specialty organofluorines. Its manufacturing facilities are located at Surat, Gujarat and Dewas, Madhya Pradesh.
YEAR IN RETROSPECT
Revenue from operations declined by 25% from Rs. 7038.600 Millions to Rs. 5246.900 Millions during the year. Though the Specialty business grew by 13% over the previous year and the Contract Research and Manufacturing (CRAMS) business grew by six times over the previous year, they were not enough to offset the decline in income from carbon credits from Rs. 2519.000 Millions to Rs. 571.100 Millions. Due to lower income from carbon credit and reversal of provision with regard to non-current investment in the previous year of Rs. 749.300 Millions, profit before tax declined by 79% from Rs. 3194.400 Millions to Rs. 685.800 Millions and profit after tax declined by 81% from Rs. 2312.400 Millions to Rs. 431.600 Millions as compared to the previous year.
During the year there has been a dramatic change in the economic and regulatory environment within the European Union which was the primary market for the carbon credits generated by the company. Henceforth, carbon credits generated from destruction of Hydro fluorocarbons are not allowed to be used as a carbon offset instrument within the European Union. Further, as a consequence of lower economic activity within the European Union, the demand for carbon credits sharply declined bringing the value down to a near zero. The weakening of the rupee against the US Dollar continued to put inflationary pressures on the economy for the second consecutive year. From a level of Rs. 49 to a US dollar in 2012, it weakened to a level of Rs. 54/55 during the last half of the current fiscal year. Inflation also remained at a fairly high level during the year. The compounded effect resulted in stagnation of govt. spends, low capex and the depressed consumer demand resulting into weakening of overall demand pull for the products of the Company.
As you are aware, the company decided to get into the global Contract Research and Manufacturing Services (CRAMS) space three years back and some initial investments were made to that end. During the year these investments have started bearing their first fruits and the revenues from this business has come along the lines of the business plan. The Contract Research Organisation (CRO) built in Surat has supported the contract manufacturing operations at Dewas as per the business plan. Manchester Organics Limited (MOL), their subsidiary in the U.K. has been an integral part of the overall CRAMS strategy of the Company. The CRO at Surat, the Contract Manufacturing Operations (CMO) at Dewas and MOL has been able to work in a well co-ordinated manner to deliver the desired objectives. During the year the company partnered with several global pharma majors in their respective R&D initiatives. In the coming years a significant growth is expected from this vertical both by improving capacity utilization and through additional capex spends.
Five new products have been introduced in the Bulk and Specialty businesses during the year for seeding the markets. They expect good potential upsides from these products in the coming years.
The Refrigerant Gases business has been under severe price pressures. This has been further accentuated by the mismatch in the movement of inputs cost and prevailing market prices of the finished products. The Bulk Fluorides business retained a steady performance along with the lines of the previous year.
As you are aware, the prices of some of the major raw materials of the Company e.g. fluorspar and chloroform increased substantially during the second half of the last fiscal and part of the inventories were carried forward into the current fiscal. This, along with weakening of the Rupee against the USD for the second consecutive year, impacted the margins of the Company adversely. As a matter of procurement strategy, now the Company has decided to reduce the inventory levels and move on to contracting smaller parcel sizes with its major suppliers.
The Rupee depreciation also resulted into higher fuel cost. There has been a more than 20% rise in the price of natural gas which travelled farther to depress the margins. Part of this negative has been made up by reducing the overall cost of power by participation in power trading, thereby moving on to sources which are cheaper than the local grid power.
The company maintained a good financial health with a sizeable treasury income. The Basel II rating of the Company is maintained at ‘CARE AA-’ (indicating high degree of safety regarding timely servicing of financial obligations and very low credit risk) for borrowings with a tenure of more than one year and fund-based facilities. The rating for short-term facilities (less than one year) has been maintained at ‘CARE A1+’ (indicating very strong degree of safety regarding timely servicing of financial obligations and lowest credit risk) for its non-fund based facilities.
The Company is fully committed to its responsibilities in health, safety and environmental (HSE) management and has continued to make sizable investments in HSE during the year.
During the year, the Company embarked on the “Responsible Care” an internationally acclaimed comprehensive Health, Safety and Environment (HSE) initiative which once implemented will take the Company to an elite club of community, climate and nature conscious organizations.
The Company is conscious about its social responsibilities and during the year, it started a mobile medical facility for the neighbouring areas in Surat. During the year, it also participated in supporting and upgrading a school for physically challenged children in Surat.
MANAGEMENT DISCUSSION
AND ANALYSIS
ECONOMIC OVERVIEW
The growth in the Indian economy slowed for the second year in succession to 5% in 2012-13 against 6.2% in 2011-12, the lowest in the last decade as a result of policy uncertainty resulting into weak growth in manufacturing, agriculture and service sectors. The Central Statistics Organisation’s advance estimate lowered growth in agriculture and allied activities to 1.8% in 2012-13 against 3.6% in 2011-12; manufacturing growth dropped to an estimated 1.9% in 2012-13 from 2.7% in 2011-12 while the services sector grew at 8.6% in 2012-13 against 11.7% in the previous fiscal.
In 2012-13, the industrial sector was plagued by a slowdown in investment and consumption, driven by policy slowdown. The manufacturing sector was impacted by declining private consumption, corporate investment and export demand. Overall, India’s GDP growth is expected to climb to 6-6.5% in 2013-14 (CRISIL estimates) due to a consumption revival. With advanced economies expected to record only a slight improvement in growth and depleted domestic investment pipeline, India’s GDP growth in 2013-14 will be largely dependent on the revival of
private consumption growth. Other factors expected to shape India’s growth prospects in 2013-14 could comprise a pick-up in agriculture, normal monsoon, lower interest rates, higher government spending and increased private consumption.
INDUSTRY OVERVIEW
The global fluorochemicals market remained volatile on account of various international agreements, including the Kyoto and Montreal Protocols, as well as uncertainties around newer generation climate friendly alternatives. Internationally the HCFC 22 market also remained depressed due to demandsupply and capacity imbalances. Even feed-stock demand was at an all time low.
The HFCs, which replaced HCFCs in the developing world and grew at a considerable pace until FY2011 is suffering from a policy limbo as there is no clear scientific and regulatory direction in terms of deciding on a basket of newer generation climate friendly alternatives.
OUTLOOK
The global demand for fluoro-chemicals is forecast to rise 3.9% per year to 3.5 million metric tons by 2016, valued at USD 19.7 billion. Gains will be fuelled by increasing production of refrigeration and cooling equipment worldwide, as well as by acceleration in primary aluminium output. Among other fluorochemicals products, fluoropolymers are expected to witness the most rapid gains in demand, driven by expanding opportunities for high-performance materials in motor vehicles, chemical processing, electronics and coatings markets. Demand for inorganic and specialty fluorochemicals will rise at a pace close to the overall average through 2016.
However, fluoro-chemicals suppliers will face a number of challenges including fluorspar availability as exports from China (world’s leading producer) have increasingly come under restrictions. The other challenge will be to deal with the evershifting regulatory environment for fluorocarbons benefitting from strong growth in global aluminium production.
GROWTH DRIVERS
Pharmaceuticals and healthcare: Potentially the Indian pharmaceutical industry is poised to grow rapidly. Currently, it ranks third in the world by drug volume (10% of global share) and fourteenth by value (about 3% of global sales). The top ten Indian pharma companies cater to 1.1% of the global spending (about USD 11 billion) on health care. The Indian pharma industry grew 16% year-on-year in 2012 to Rs 629 billion, representing one of the fastest growth rates in the world. Global spending on medicines is estimated to grow at 4.5% CAGR during the period driven by higher generic spending. In terms of geographies, pharmerging (emerging pharmaceutical markets) countries will be the key drivers with market share estimated to increase to 30% by CY16.
Automobiles, air-conditioners and refrigerators market: Though the Indian automotive industry faced one of its slowest growth rates in a decade, the long-term prospects for the sector remain optimistic, considering India’s low car penetration. According to estimates by JD Power and Ernst and Young, the Indian automobile market is tipped to become the third largest by 2020. India’s share of the global passenger vehicle market could jump from 4% in 2010-11 to 8% in 2020.
As per a study titled Demand of AC Industry: An Analysis, released by The Associated Chambers of Commerce and Industry in India, about 4.2 million units of room air-conditioners were sold in India in 2011. According to a TechSci Research report, the country’s air-conditioner market is forecast to grow at 13.6% CAGR for five years fuelled by a rapid increase in middle-class households from 31.4 million to 53.4 million by 2015 (NCAER report) and a deeper penetration of room air-conditioners in the middle class Indian households.
The Indian refrigerator market is estimated in excess of 8 mn units per year, with the market growing at almost twice the rate of the overall growth of the country’s consumer durables sector.
Agrochemicals: India is the fourth largest producer of agrochemicals, after United States, Japan and China whereas, India’s agrochemicals consumption is one of the lowest with per hectare consumption of just 0.58 Kg compared to US (4.5 Kg/ ha) and Japan (11 Kg/ha). Given the thin base, the consumption in this sector can also be expected to grow rapidly.
CRAM / CRO: A business conceived two years back, is now coming of age. By leveraging its existing relationships with global pharma and agro majors and presence in Europe through Manchester Organics, this vertical is slated to double its revenues over the near future.
PRODUCT
REFRIGERANTS
SEGMENT REVENUE IN
2012-13: Rs. 1760.000 MILLIONS
Navin Fluorine pioneered the manufacture of refrigerant gases in India in 1967. Its Mafron brand is a generic name for refrigerant gases in the country, a preferred choice for original equipment manufacturers, service technicians and equipment owners. The product facilitates safe, reliable and efficient refrigeration and air-conditioning solutions. The product is distributed through a strong distribution network of over 120 dealers in India and overseas. The Company’s refrigerant products are exported to South Asia, Southeast Asia, the Middle East and Turkey.
In 2012-13, the Company derived 32% of its refrigerant revenues from international markets (40% in 2011-12) while the rest was marketed within India. Though volumes for HCFC22 declined over the previous year, the segment derived higher contributions mostly on account of raw material and packaging value engineering. The division also engaged in HFC134A trading, whose prices remained stable through most of the year.
As informed earlier the division’s CER income ceased with effect from 31 December, 2012.
PRODUCT
SPECIALTY CHEMICALS
SEGMENT REVENUE IN
2012-13: Rs. 1780.000 MILLIONS
The Company’s specialty segment manufactures fluorine-based molecules with niche applications in the pharmaceutical and agrochemical segments.
The division has a rich fluorine chemistry competence backed by a robust research set-up. Almost 46% of sales have come from international business.
During the year the division introduced six new fluorinated compounds with growing applications in the pharmaceutical and agrochemical sectors. The Company expects to work closely with customers, creating cost-efficient processes to widen its customer base.
PRODUCT
BULK FLUORIDES
SEGMENT REVENUE IN
2012-13: Rs. 990.000 MILLIONS
Bulk fluorides cater mainly to the steel sector with dominant applications in the glass, pharmaceutical and agrochemical industries. The division launched two new products during the year with sizable potential upside to be harnessed in the coming years.
The division plans to introduce specific compounds for the glass industry and increase its export reach on the back of efficient cost levers.
STATEMENT OF UNAUDITED STANDALONE RESULTS FOR THE QUARTER AND NINE
MONTHS ENDED 31ST DECEMBER, 2013
PART I
(Rs. in Millions)
|
Sr. No. |
Particulars |
Three
months ended 31.12.2013 |
Three
months ended 30.09.2013 |
Year to Date figures for current
period ended 31.12.2013 |
|
|
|
(Unaudited) |
(Unaudited) |
(Unaudited) |
|
1 |
Income from Operations Net sales/ Income from operations (Net of excise duty) Other operating income |
1096.964
3.552 |
992.299 6.438 |
3233.661 14.044 |
|
|
Total Income
from Operations (Net) |
1100.516 |
998.737 |
3247.705 |
|
2 |
Expenses (a)
Cost of materials consumed (b)
Purchase of stock-in-trade (c)
Changes in inventories of
finished Goods, work-in-progress and stock-in- (d)
Employee benefits expense (e)
Depreciation and amortisation
expense (f)
Net loss on foreign currency
transactions and translations (g) Other
expenses |
526.230 8.664 (28.326) 119.674 50.933 1.706 341.882 |
474.755 3.401 (38.362) 115.611 52.385 (0.818) 279.738 |
1520.192 32.439 (41.541) 367.062 153.909 0.982 894.779
|
|
|
Total expenses |
1020.763 |
886.710 |
2927.822 |
|
|
|
|
|
|
|
3 |
Profit from Operations before Other Income and
Finance costs (1 - 2) |
79.753 |
112.027 |
319.883 |
|
4 |
Other Income |
30.265 |
67.167 |
160.779 |
|
5 |
Profit from ordinary activities before Finance
costs (3 + 4) |
110.018 |
179.194 |
480.662 |
|
6 |
Finance costs |
14.079 |
11.044 |
37.094 |
|
7 |
Profit from ordinary activities before tax (5 -
6) |
95.939 |
168.150 |
443.568 |
|
8 |
Tax expense |
27.495 |
45.275 |
118.235 |
|
9 |
Net Profit after taxes (7 - 8) |
68.444 |
122.875 |
325.333 |
|
10 11 12 |
Paid-up equity share capital (Face value of Rs.
10/- per share) Reserve excluding revaluation reserves as per
balance sheet at year end Earning per share (of Rs. 10/- each) (not
annualised) * - Basic and diluted EPS for the period/ year |
97.572 7.01 |
97.572 12.59 |
97.572 33.33 |
*Stock options issued to certain executives, not being dilutive have not been considered for the purpose of computing earnings per share.
PART
II
SELECT INFORMATION FOR THE QUARTER AND NINE MONTHS ENDED 31ST DECEMBER,
2013
|
Sr. No. |
Particulars |
Three months ended 31.12.2013 |
Three months ended 30.09.2013 |
Year to Date figures for current period ended 31.12.2013 |
|
|
|
(Unaudited) |
(Unaudited) |
(Unaudited) |
|
(A) 1 2 |
PARTICULARS OF SHAREHOLDING Public Shareholding - Number of shares - Percentage of shareholding Promoters and promoter Group Shareholding a) Pledged /
Encumbered - Number of shares - Percentage of shares (as a % of the total shareholding of promoter and promoter group) - Percentage of shares (as a % of the total share capital of the company) b) Non -
encumbered - Number of shares - Percentage of shares (as a % of the total shareholding of promoter and promoter group) - Percentage of shares (as a % of the total share capital of the company) |
5,970,603 61.17%
588,728
15.53% 6.03% 3,201,766
84.47% 32.80% |
5,970,603 61.17% 588,728 15.53% 6.03%
3,201,766 84.47% 32.80% |
5,970,603 61.17%
947,728 25.00% 9.71%
2,842,766 75.00% 29.12% |
|
|
Particulars |
Three months ended 31.12.2013 |
|
(B) |
INVESTOR COMPLAINTS
(Nos.) Pending at the beginning of the quarter Received during the quarter Disposed of during the quarter Remaining unresolved at the end of the quarter |
- - - - |
NOTES
1) The results of the quarter/ period ended 31st December, 2013 were reviewed by the Audit Committee and approved by the Board of Directors at its meeting held on 27th January, 2014. They have been subjected to limited review by the statutory auditors.
2) There has been no income from sale of Certified Emission Reductions (Carbon Credits) during the quarter/period. The corresponding figures for the quarter and period ended 31st December, 2012 were Rs. 112.722 Millions and Rs. 541.739 Millions respectively.
3) The Company paid interim dividend of Rs. 7.50 per share on 97,61,097 equity shares of nominal value of Rs.10/- each, aggregating Rs. 73.208 Millions (corresponding quarter previous year; Rs 73.208 Millions on 97,61,097 equity shares of nominal value of Rs.10/- each) during the quarter ended 31st December, 2013.
4) The Company operates solely in the chemical business segment.
5) Previous period’s/ year’s figures have been regrouped, wherever necessary, to correspond with those of the current period.
CONTINGENT
LIABILITIES:
|
PARTICULARS |
31.03.2013 (Rs.
In Millions) |
31.03.2012 (Rs.
In Millions) |
|
a) Excise matters disputed in appeal |
|
|
|
These relate to MODVAT on capital purchases (pending before the
Assistant Commissioner) and permit fee on purchase of alcohol (pending before
the High Court) |
15.820 |
15.820 |
|
b) Claims against the Company not acknowledged as debts |
|
|
|
Labour matters involving issues like regularization of employment,
termination of employment, compensation against severance, etc. |
2.265 |
2.265 |
|
c) Sales-tax matters disputed in appeal |
|
|
|
These relate to classification of goods and consequent dispute on the
rates of sales-tax (pending at various stages from Assistant Commissioner to
High Court) |
19.949 |
20.196 |
|
d) Income tax matters disputed in appeal |
80.561 |
62.917 |
Note
In all the above matters, the Company is hopeful of succeeding and as
such does not expect any significant liability to crystallize.
FIXED ASSETS
v
Tangible
Assets
· Freehold Land
· Leasehold Land
· Buildings
· Plant and Machinery
· Furniture and Fixtures
· Vehicles
· Office Equipment
v
Intangible
Assets
· Computer Software
CMT REPORT (Corruption, Money Laundering & Terrorism]
The Public Notice information has been collected from various sources
including but not limited to: The Courts,
1] INFORMATION ON
DESIGNATED PARTY
No exist designating subject or any of its beneficial owners,
controlling shareholders or senior officers as terrorist or terrorist
organization or whom notice had been received that all financial transactions
involving their assets have been blocked or convicted, found guilty or against
whom a judgement or order had been entered in a proceedings for violating
money-laundering, anti-corruption or bribery or international economic or
anti-terrorism sanction laws or whose assets were seized, blocked, frozen or
ordered forfeited for violation of money laundering or international
anti-terrorism laws.
2] Court Declaration :
No exist to suggest that subject is or was
the subject of any formal or informal allegations, prosecutions or other
official proceeding for making any prohibited payments or other improper
payments to government officials for engaging in prohibited transactions or
with designated parties.
3] Asset Declaration :
No records exist to suggest that the property or assets of the subject
are derived from criminal conduct or a prohibited transaction.
4] Record on Financial
Crime :
Charges or conviction
registered against subject: None
5] Records on Violation of
Anti-Corruption Laws :
Charges or
investigation registered against subject: None
6] Records on Int’l
Anti-Money Laundering Laws/Standards :
Charges or
investigation registered against subject: None
7] Criminal Records
No available
information exist that suggest that subject or any of its principals have been
formally charged or convicted by a competent governmental authority for any
financial crime or under any formal investigation by a competent government
authority for any violation of anti-corruption laws or international anti-money
laundering laws or standard.
8] Affiliation with
Government :
No record
exists to suggest that any director or indirect owners, controlling
shareholders, director, officer or employee of the company is a government
official or a family member or close business associate of a Government
official.
9] Compensation Package :
Our market
survey revealed that the amount of compensation sought by the subject is fair
and reasonable and comparable to compensation paid to others for similar
services.
10] Press Report :
No press reports / filings exists on
the subject.
CORPORATE GOVERNANCE
MIRA INFORM as part of its Due Diligence do provide comments on
Corporate Governance to identify management and governance. These factors often
have been predictive and in some cases have created vulnerabilities to credit
deterioration.
Our Governance Assessment focuses principally on the interactions between
a company’s management, its Board of Directors, Shareholders and other
financial stakeholders.
CONTRAVENTION
Subject is not known to have contravened any existing local laws,
regulations or policies that prohibit, restrict or otherwise affect the terms
and conditions that could be included in the agreement with the subject.
FOREIGN EXCHANGE RATES
|
Currency |
Unit
|
Indian Rupees |
|
US Dollar |
1 |
Rs.60.23 |
|
|
1 |
Rs.100.79 |
|
Euro |
1 |
Rs.83.29 |
INFORMATION DETAILS
|
Information
Gathered by : |
SVA |
|
|
|
|
Analysis Done by
: |
KAR |
|
|
|
|
Report Prepared
by : |
MRI |
SCORE & RATING EXPLANATIONS
|
SCORE FACTORS |
RANGE |
POINTS |
|
HISTORY |
1~10 |
7 |
|
PAID-UP CAPITAL |
1~10 |
7 |
|
OPERATING SCALE |
1~10 |
7 |
|
FINANCIAL CONDITION |
|
|
|
--BUSINESS SCALE |
1~10 |
7 |
|
--PROFITABILIRY |
1~10 |
5 |
|
--LIQUIDITY |
1~10 |
7 |
|
--LEVERAGE |
1~10 |
7 |
|
--RESERVES |
1~10 |
6 |
|
--CREDIT LINES |
1~10 |
7 |
|
--MARGINS |
-5~5 |
-- |
|
DEMERIT POINTS |
|
|
|
--BANK CHARGES |
YES/NO |
YES |
|
--LITIGATION |
YES/NO |
NO |
|
--OTHER ADVERSE INFORMATION |
YES/NO |
NO |
|
MERIT POINTS |
|
|
|
--SOLE DISTRIBUTORSHIP |
YES/NO |
NO |
|
--EXPORT ACTIVITIES |
YES/NO |
NO |
|
--AFFILIATION |
YES/NO |
YES |
|
--LISTED |
YES/NO |
YES |
|
--OTHER MERIT FACTORS |
YES/NO |
YES |
|
DEFAULTER |
|
|
|
--RBI |
YES/NO |
NO |
|
--EPF |
YES/NO |
NO |
|
TOTAL |
|
60 |
This score serves as a reference to assess
SC’s credit risk and to set the amount of credit to be extended. It is calculated
from a composite of weighted scores obtained from each of the major sections of
this report. The assessed factors and their relative weights (as indicated
through %) are as follows:
Financial
condition (40%) Ownership
background (20%) Payment record
(10%)
Credit history
(10%) Market trend (10%) Operational size
(10%)
RATING EXPLANATIONS
|
RATING |
STATUS |
PROPOSED CREDIT LINE |
|
|
>86 |
Aaa |
Possesses an extremely sound financial base with the strongest capability
for timely payment of interest and principal sums |
Unlimited |
|
71-85 |
Aa |
Possesses adequate working capital. No caution needed for credit
transaction. It has above average (strong) capability for payment of interest
and principal sums |
Large |
|
56-70 |
A |
Financial & operational base are regarded healthy. General
unfavourable factors will not cause fatal effect. Satisfactory capability for
payment of interest and principal sums |
Fairly Large |
|
41-55 |
Ba |
Overall operation is considered normal. Capable to meet normal
commitments. |
Satisfactory |
|
26-40 |
B |
Capability to overcome financial difficulties seems comparatively
below average. |
Small |
|
11-25 |
Ca |
Adverse factors are apparent. Repayment of interest and principal sums
in default or expected to be in default upon maturity |
Limited with
full security |
|
<10 |
C |
Absolute credit risk exists. Caution needed to be exercised |
Credit not
recommended |
|
-- |
NB |
New Business |
-- |
This report is issued at your request without any
risk and responsibility on the part of MIRA INFORM PRIVATE LIMITED (MIPL)
or its officials.