MIRA INFORM REPORT
|
Report Date : |
19.04.2014 |
IDENTIFICATION DETAILS
|
Name : |
STERLITE TECHNOLOGIES LIMITED (w.e.f. 14.07.2007) |
|
|
|
|
Formerly Known
As : |
STERLITE OPTICAL TECHNOLOGIES LIMITED |
|
|
|
|
Registered
Office : |
Survey No. 68 / 1, Rakholi Village, Madhuban Dam Road, Silvassa – 396 230, Dadra and Nagar Haveli |
|
|
|
|
Country : |
|
|
|
|
|
Financials (as
on) : |
31.03.2013 |
|
|
|
|
Date of
Incorporation : |
24.03.2000 |
|
|
|
|
Com. Reg. No.: |
54-000340 |
|
|
|
|
Capital
Investment / Paid-up Capital : |
Rs.786.900 Millions |
|
|
|
|
CIN No.: [Company Identification
No.] |
L31300DN2000PLC000340 |
|
|
|
|
TAN No.: [Tax Deduction &
Collection Account No.] |
SRTS01199C |
|
|
|
|
PAN No.: [Permanent Account No.] |
AAECS8719B |
|
|
|
|
Legal Form : |
A Public Limited Liability Company. The Company’s Shares are Listed on
the Stock Exchanges. |
|
|
|
|
Line of Business
: |
Manufacture of Power and Telecom Products and Solutions. |
|
|
|
|
No. of Employees
: |
1000 (Approximately) |
RATING & COMMENTS
|
MIRA’s Rating : |
Ba (54) |
|
RATING |
STATUS |
PROPOSED CREDIT LINE |
|
|
41-55 |
Ba |
Overall operation is considered normal. Capable to meet normal
commitments. |
Satisfactory |
|
Maximum Credit Limit : |
USD 47310000 |
|
|
|
|
Status : |
Good |
|
|
|
|
Payment Behaviour : |
Regular |
|
|
|
|
Litigation : |
Clear |
|
|
|
|
Comments : |
Subject is well established company having a fine track record. The rating reflects leadership position in the power transmission
conductors and telecommunications cable segments marked by healthy operating
capabilities and fair general financial position of the company. Trade relations are reported as fair. Business is active. Payment are
reported to be regular and as per commitments. The company can be considered good for normal business dealing at
usual trade terms and conditions. |
NOTES :
Any query related to this report can be made
on e-mail : infodept@mirainform.com
while quoting report number, name and date.
ECGC Country Risk Classification List – March 31, 2014
|
Country Name |
Previous Rating (31.12.2013) |
Current Rating (31.03.2014) |
|
India |
A1 |
A1 |
|
Risk Category |
ECGC
Classification |
|
Insignificant |
A1 |
|
Low |
A2 |
|
Moderate |
B1 |
|
High |
B2 |
|
Very High |
C1 |
|
Restricted |
C2 |
|
Off-credit |
D |
INDIAN ECONOMIC OVERVIEW
US investment bank
Goldman Sachs has upgraded its outlook on Indian markets as it expects
positive impact of the election cycle.
India’s economy may
grow 4.7 % in the current financial year, lower than the official estimate of
4.9 %, Fitch Rating said. The global rating agency expects the economy to pick
up in the next two financial years.
Global ratings
agency Standard & Poor said increasing focus by India Inc on lowering debt
is likely to improve their credit profiles.
Singapore (1.1 million
Indian tourists in 2012), Thailand (one million), the United Arab Emirates
().98 million) and Malaysia ().82 million) emerged as the preferred holidays
hotspots for Indians. The total figure is expected to increase to 1.93 million
by 2017, according to the latest Eurmonitor international report.
There is a $29.34 bn
outward foreign direct investment by domestic companies between April and
January of 2013/14 which has seen some signs of recovery according to a Care
Ratings report.
There are 264 number
of new companies being set up every day on average during 2014. Most of them
are registered in Mumbai. India had 1.38 million registered companies at the
end of January, 2014.
Twitter like
messaging service Weibo Corporation has filed to raise $ 500 million via a US
initial public offering. Alibaba, which owns a stake in Weibo is expected to
raise about $ 15 billion New York this year in the highest profile Internet IPO
since Facebook’s in 2012.
Bharti Airtel has
raised Rs.2,453.2 crore (350 million Swiss Francs) by selling six-year bonds at
a coupon rate of three per cent and maturing in 2020. This is the largest ever
bond offering by an Indian company in Swiss Francs. Bharat Petroleum
Corporation raised 175 million Swiss Francs by selling five year bonds at 2.98
% coupon rate in February.
Indian Oil
Corporation plans to invest Rs 7650 crore in setting up a petrochemical complex
at its almost complete Paradip refinery in Odhisha in three to four years. The
company board is set to consider the setting up of a 700000 tonne per annum
polypropylene plant at an estimated cost at Rs.3150 crore.
Global chief
information officers at gathering in Bangalore in April to meet Indian startups
at an event called Tech50 Watchout for Little Eye Labs-Facebook type deals in
the making.
EXTERNAL AGENCY RATING
|
Rating Agency Name |
CRISIL |
|
Rating |
Long Term Rating = A+ |
|
Rating Explanation |
Adequate degree of safety and low credit risk |
|
Date |
03.10.2013 |
|
Rating Agency Name |
CRISIL |
|
Rating |
Short Term Rating = A1 |
|
Rating Explanation |
Very strong degree of safety and lowest credit risk. |
|
Date |
03.10.2013 |
RBI DEFAULTERS’ LIST STATUS
Subject’s name is not enlisted as a defaulter
in the publicly available RBI Defaulters’ list.
EPF (Employee Provident Fund) DEFAULTERS’ LIST STATUS
Subject’s name is not enlisted as a defaulter
in the publicly available EPF (Employee Provident Fund) Defaulters’ list as of
31-03-2012.
INFORMATION PARTED BY
|
Name : |
Mr. Ajit |
|
Designation : |
Accounts Department |
|
Contact No.: |
91-20-66235700 |
LOCATIONS
|
Registered Office/Factory 1 : |
Survey No. 68 / 1, Rakholi Village, Madhuban Dam Road, Silvassa – 396 230, Dadra and Nagar Haveli, India |
|
Tel. No.: |
91-260-6612000 |
|
Fax No.: |
91-260-6612013 |
|
E-Mail : |
|
|
Website : |
|
|
Location : |
Owned |
|
|
|
|
Corporate Office : |
4th Floor Godrej Millenium 9, |
|
Tel. No.: |
91-20-30514000/ 66235700 |
|
Fax No.: |
91-20-26138083 |
|
E-Mail : |
|
|
|
|
|
Factory 2 : |
Optical Fiber, E2, E3, MIDC, Waluj, Aurangabad-431136, |
|
Tel. No.: |
91-240-2564599 |
|
Fax No.: |
91-240-2564598 |
|
|
|
|
Factory 3 : |
Optical Fiber, AL-23, Shendra MIDC SEZ, |
|
Tel. No.: |
91-240-2622020 |
|
Fax No.: |
91-240-2564598 |
|
|
|
|
Factory 4 : |
Copper Telecom Cables and Structured Data Cables, Survey No. 33 / 1 /
1, |
|
Tel. No.: |
91-260-6452959 |
|
Fax No.: |
91-260-6612122 |
|
|
|
|
Factory 5 : |
Power Transmission Conductors, Survey No. 99, Rakholi Village, Madhuban
Dam Road, Silvassa – 396230, Union Territory of Dadra and Nagar Haveli, India |
|
Tel. No.: |
91-260-6612200 |
|
Fax No.: |
91-260-6612260 |
|
|
|
|
Factory 6: |
Plot 2D, Sector 10, IIE SIDCUL, Haridwar – 249403, |
|
Tel. No.: |
91-1334-239463 |
|
Fax No.: |
91-1334-239375 |
|
|
|
|
Factory 7: |
Burkhamunda, Jharsuguda - 768 202, |
|
|
|
|
Factory 8 : |
Power Cables, No. 5, Vardhaman Industrial Estate, Haridwar – 249 402, |
|
|
|
|
Sales Office : |
Unit No 202, 2nd Floor, Pentagon Tower 2 Magarpatta
Township, Hadapsar, Pune – 410028, Maharashtra, India |
|
|
|
|
Sales, Marketing and Representative Offices: |
Located at: ·
· India ·
·
·
·
·
·
·
·
Vietnam |
DIRECTORS
AS ON 31.03.2013
|
Name : |
Mr. Anil Agarwal |
|
Designation : |
Non - Executive Chairman |
|
Date of Birth/Age : |
16.06.1957 |
|
|
|
|
Name : |
Mr. Arun Todarwal |
|
Designation : |
Non – Executive and Independent Director |
|
|
|
|
Name : |
Mr. A. R. Narayanaswamy |
|
Designation : |
Non – Executive and Independent Director |
|
Date of Birth/Age : |
22.12.1951 |
|
|
|
|
Name : |
Mr. Haigreve Khaitan |
|
Designation : |
Non – Executive and Independent Director |
|
|
|
|
Name : |
Mr. Pravin Agarwal |
|
Designation : |
Whole Time Director |
|
|
16.10.1954 |
|
|
|
|
Name : |
Mr. Anand Agarwal |
|
Designation : |
Chief Executive Officer and Whole Time Director |
|
Date of Birth/Age : |
07.08.1967 |
|
|
|
|
Name : |
Mr.
C V Krishnan |
|
Designation : |
Director
|
|
|
|
|
Name : |
Mr.
Pratik Agarwal |
|
Designation : |
Director
|
|
|
|
|
Name : |
Mr. Pravin
Agarwal |
|
Designation : |
Whole-time
Director |
KEY EXECUTIVES
|
Name : |
Mr. Anupam Jindal |
|
Designation : |
Chief Financial Officer |
|
|
|
|
Name : |
Mr. Sandeep Deshmukh |
|
Designation : |
Company Secretary |
|
|
|
|
Name : |
Mr. K. S. Rao |
|
Designation : |
Chief Operating Officer (Telecom) |
|
|
|
|
Name : |
Mr. Rajendra Mishra |
|
Designation : |
Vice President – Strategic Business Initiatives and Head
Power Cables Business |
|
|
|
|
Name : |
Mr. Vijay Jain |
|
Designation : |
Chief Operating Officer – Networks Business |
|
|
|
|
Name : |
Mr. Pratik Agarwal |
|
Designation : |
Head – Infrastructure Business |
|
|
|
|
Name : |
Mr. Prasanth Puliakottu |
|
Designation : |
Chief Information Officer |
|
|
|
|
Name : |
Mr. Pankaj Priyadarshi |
|
Designation : |
CCO |
|
|
|
|
Name : |
Mr. Ajay Bhardwaj |
|
Designation : |
Chief Operating Officer – Grid Business |
|
|
|
|
Name : |
Mr. Kamal Sehgal |
|
Designation : |
Leader – Business Excellence |
|
|
|
|
Name : |
Mr. Vimal Malhotra |
|
Designation : |
Head – Human Resources |
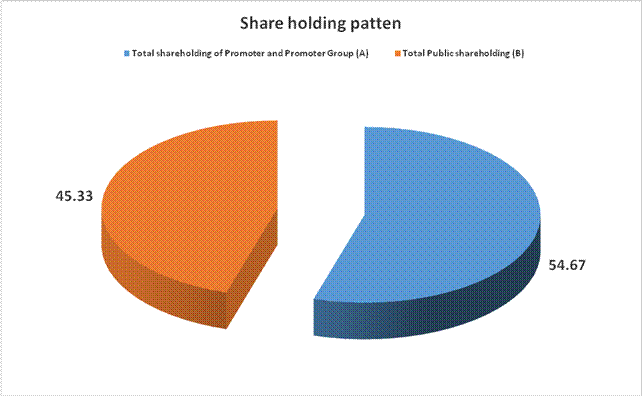
SHAREHOLDING PATTERN
AS ON 31.12.2013
|
Category of Shareholder |
No. of Shares |
% of No. of Shares |
|
(A) Shareholding of Promoter and Promoter Group |
||
|
|
|
|
|
|
1051611 |
0.27 |
|
|
4764295 |
1.21 |
|
|
5815906 |
1.48 |
|
|
|
|
|
|
209402750 |
53.19 |
|
|
209402750 |
53.19 |
|
Total shareholding of Promoter and Promoter Group (A) |
215218656 |
54.67 |
|
(B) Public Shareholding |
||
|
|
|
|
|
|
10979631 |
2.79 |
|
|
21783339 |
5.53 |
|
|
500 |
0.00 |
|
|
914737 |
0.23 |
|
|
4515063 |
1.15 |
|
|
38193270 |
9.70 |
|
|
|
|
|
|
21562943 |
5.48 |
|
|
|
|
|
|
90299295 |
22.94 |
|
|
22812735 |
5.80 |
|
|
5570950 |
1.42 |
|
|
4566375 |
1.16 |
|
|
200 |
0.00 |
|
|
6705 |
0.00 |
|
|
623005 |
0.16 |
|
|
85550 |
0.02 |
|
|
189765 |
0.05 |
|
|
99350 |
0.03 |
|
|
140245923 |
35.63 |
|
Total Public shareholding (B) |
178439193 |
45.33 |
|
Total (A)+(B) |
393657849 |
100.00 |
|
(C) Shares held by Custodians and against which Depository
Receipts have been issued |
0 |
0.00 |
|
|
0 |
0.00 |
|
|
0 |
0.00 |
|
|
0 |
0.00 |
|
Total (A)+(B)+(C) |
393657849 |
0.00 |
BUSINESS DETAILS
|
Line of Business : |
Manufacture of Power and Telecom Products and Solutions. |
||||||||||||
|
|
|
||||||||||||
|
Products : |
|
PRODUCTION STATUS (AS ON 31.03.2011)
|
Particulars |
Unit |
Licensed
Capacity |
Installed
Capacity |
|
Power Transmission Line –
Distribution Conductor ** |
MT |
N.A. |
160000 |
|
Copper Telecom Cables |
CKM |
9500000 |
2828400 |
|
Fiber Optic cables* |
FKM |
5309059 |
4500000 |
|
Optical Fiber |
KM |
12000000 |
12000000 |
|
Broadband Access Networks |
NOS. |
1500000 |
1000000 |
* Based on Average Fibre KM.
** N.A. – Delicenced vide notification no. 477 (E)
Dated 27th July, 1991.
|
Particulars (including for captive
consumption) |
Unit |
Actual
Production |
|
Copper Telecom Cables |
CKM |
720524 |
|
Fiber Optic cables |
FKM |
3775878 |
|
Optical Fibre* |
KM |
9130523 |
|
Power Transmission Line –
Distribution Conductor (AAC/ACSR) ** |
MT |
125530 |
* It includes 3,742,671 KM (2,906,150 KM) produced for
captive consumption
** Current Year 140,952 KM (129,036 KM)
GENERAL INFORMATION
|
No. of Employees : |
1000 (Approximately) |
||||||||||||||||||||||||||||||
|
|
|
||||||||||||||||||||||||||||||
|
Bankers : |
|
||||||||||||||||||||||||||||||
|
|
|
||||||||||||||||||||||||||||||
|
Facilities : |
|
||||||||||||||||||||||||||||||
|
|
|
|
Banking
Relations : |
-- |
|
|
|
|
Auditors : |
|
|
Name : |
S. R. Batliboi and Company LLP Chartered Accountants |
|
|
|
|
Holding Company : |
|
|
|
|
|
Ultimate Holding Company : |
|
|
|
|
|
Subsidiaries : |
|
|
|
|
|
Other Related Parties : |
|
CAPITAL STRUCTURE
AS ON 31.03.2013
Authorised Capital :
|
No. of Shares |
Type |
Value |
Amount |
|
|
|
|
|
|
750000000 |
Equity Shares |
Rs.2/- each |
Rs. 1500.000 Millions |
|
|
|
|
|
Issued, Subscribed & Paid-up Capital :
|
No. of Shares |
Type |
Value |
Amount |
|
|
|
|
|
|
393439135 |
Equity Shares |
Rs.2/- each |
Rs. 786.900
Millions |
|
|
|
|
|
FINANCIAL DATA
[all figures are
in Rupees Millions]
ABRIDGED BALANCE
SHEET
|
SOURCES OF FUNDS |
31.03.2013 |
31.03.2012 |
31.03.2011 |
|
I.
EQUITY
AND LIABILITIES |
|
|
|
|
(1)Shareholders' Funds |
|
|
|
|
(a) Share Capital |
786.900 |
786.500 |
712.800 |
|
(b) Reserves & Surplus |
11043.000 |
10702.300 |
9375.000 |
|
(c) Money
received against share warrants |
0.000 |
0.000 |
271.000 |
|
|
|
|
|
|
(2) Share Application money pending
allotment |
0.000 |
0.000 |
0.200 |
|
Total
Shareholders’ Funds (1) + (2) |
11829.900 |
11488.800 |
10359.000 |
|
|
|
|
|
|
(3)
Non-Current Liabilities |
|
|
|
|
(a) long-term borrowings |
2066.800 |
0.000 |
1.400 |
|
(b) Deferred tax liabilities (Net) |
872.100 |
735.200 |
660.100 |
|
(c) Trade Payables |
15.900 |
194.200 |
320.700 |
|
(d) long-term
provisions |
153.100 |
397.100 |
133.500 |
|
Total Non-current
Liabilities (3) |
3107.900 |
1326.500 |
1115.700 |
|
|
|
|
|
|
(4)
Current Liabilities |
|
|
|
|
(a) Short
term borrowings |
8323.500 |
6643.700 |
6195.800 |
|
(b) Trade payables |
6192.500 |
5211.700 |
4248.900 |
|
(c) Other
current liabilities |
3238.400 |
3142.700 |
2988.800 |
|
(d) Short-term
provisions |
172.300 |
151.700 |
232.300 |
|
Total Current
Liabilities (4) |
17926.700 |
15149.800 |
13665.800 |
|
|
|
|
|
|
TOTAL |
32864.500 |
27965.100 |
25140.500 |
|
|
|
|
|
|
II.
ASSETS |
|
|
|
|
(1)
Non-current assets |
|
|
|
|
(a) Fixed
Assets |
|
|
|
|
(i)
Tangible assets |
9934.900 |
9530.100 |
6981.800 |
|
(ii) Intangible
Assets |
77.600 |
59.500 |
79.900 |
|
(iii)
Capital work-in-progress |
289.700 |
410.800 |
1299.600 |
|
(iv)
Fixed Assets Held for Sale |
0.000 |
80.500 |
0.000 |
|
(b) Non-current Investments |
1891.000 |
1763.400 |
88.400 |
|
(c) Deferred tax assets (net) |
0.000 |
0.000 |
0.000 |
|
(d)
Long-term Loan and Advances |
6764.500 |
2251.500 |
2050.300 |
|
(e) Other
Non-current assets |
0.000 |
0.000 |
809.800 |
|
(f) Trade
receivables |
691.200 |
1172.200 |
198.800 |
|
Total Non-Current
Assets |
19648.900 |
15268.000 |
11508.600 |
|
|
|
|
|
|
(2)
Current assets |
|
|
|
|
(a)
Current investments |
0.000 |
0.000 |
1000.000 |
|
(b)
Inventories |
2915.400 |
2727.000 |
1913.800 |
|
(c) Trade receivables |
6403.700 |
6667.500 |
8466.200 |
|
(d) Cash
and cash equivalents |
1957.500 |
1847.700 |
490.800 |
|
(e)
Short-term loans and advances |
1930.900 |
1371.400 |
1761.000 |
|
(f) Other
current assets |
8.100 |
83.500 |
0.100 |
|
Total
Current Assets |
13215.600 |
12697.100 |
13631.900 |
|
|
|
|
|
|
TOTAL |
32864.500 |
27965.100 |
25140.500 |
PROFIT & LOSS
ACCOUNT
|
|
PARTICULARS |
31.03.2013 |
31.03.2012 |
31.03.2011 |
|
|
|
SALES |
|
|
|
|
|
|
|
Income |
33537.100 |
27274.700 |
22625.500 |
|
|
|
Other Income |
145.400 |
236.700 |
159.700 |
|
|
|
TOTAL (A) |
33682.500 |
27511.400 |
22785.200 |
|
|
|
|
|
|
|
|
Less |
EXPENSES |
|
|
|
|
|
|
|
Cost of raw material and components consumed |
22737.400 |
19050.000 |
15712.000 |
|
|
|
Purchase of traded goods |
708.300 |
545.700 |
141.300 |
|
|
|
Employee benefits expense |
1177.000 |
987.000 |
825.600 |
|
|
|
Other expenses |
6396.200 |
5256.600 |
3599.500 |
|
|
|
(Increase) /
decrease in inventories of finished goods work-in-progress and traded goods |
60.300 |
(560.200) |
(309.300) |
|
|
|
TOTAL (B) |
31079.200 |
25279.100 |
19969.100 |
|
|
|
|
|
|
|
|
Less |
PROFIT
/ (LOSS) BEFORE INTEREST, TAX, DEPRECIATION AND AMORTISATION (A-B) (C) |
2603.300 |
2232.300 |
2816.100 |
|
|
|
|
|
|
|
|
|
Less |
FINANCIAL
EXPENSES (D) |
1055.700 |
951.000 |
474.100 |
|
|
|
|
|
|
|
|
|
|
PROFIT
/ (LOSS) BEFORE TAX, DEPRECIATION AND AMORTISATION (C-D) (E) |
1547.600 |
1281.300 |
2342.000 |
|
|
|
|
|
|
|
|
|
Less/ Add |
DEPRECIATION/
AMORTISATION (F) |
859.500 |
713.600 |
560.100 |
|
|
|
|
|
|
|
|
|
|
PROFIT / (LOSS)
BEFORE TAX (E-F) (G) |
688.100 |
567.700 |
1781.900 |
|
|
|
|
|
|
|
|
|
Less |
TAX (H) |
213.500 |
129.300 |
376.600 |
|
|
|
|
|
|
|
|
|
|
PROFIT / (LOSS)
AFTER TAX (G-H) (I) |
474.600 |
438.400 |
1405.300 |
|
|
|
|
|
|
|
|
|
|
EARNINGS IN FOREIGN
CURRENCY |
|
|
|
|
|
|
|
FOB Value of Exports |
9529.900 |
8132.500 |
6998.500 |
|
|
|
FOB Value of Deemed Exports |
1436.700 |
2051.400 |
928.500 |
|
|
TOTAL EARNINGS |
10966.600 |
10183.900 |
7927.000 |
|
|
|
|
|
|
|
|
|
|
IMPORTS |
|
|
|
|
|
|
|
Raw Materials |
7008.800 |
5406.700 |
3728.500 |
|
|
|
Stores Spares and
Consumables |
137.700 |
120.000 |
122.900 |
|
|
|
Capital Goods |
469.200 |
255.800 |
785.000 |
|
|
TOTAL IMPORTS |
7615.700 |
5782.500 |
4636.400 |
|
|
|
|
|
|
|
|
|
|
Earnings /
(Loss) Per Share (Rs.) |
|
|
|
|
|
|
Basic |
1.21 |
1.12 |
3.95 |
|
|
|
Diluted |
1.20 |
1.11 |
3.72 |
|
KEY RATIOS
|
PARTICULARS |
|
31.03.2013 |
31.03.2012 |
31.03.2011 |
|
PAT / Total Income |
(%) |
1.41
|
1.59 |
6.17 |
|
|
|
|
|
|
|
Net Profit Margin (PBT/Sales) |
(%) |
2.05
|
2.08 |
7.87 |
|
|
|
|
|
|
|
Return on Total Assets (PBT/Total Assets} |
(%) |
2.24
|
2.42 |
8.21 |
|
|
|
|
|
|
|
Return on Investment (ROI) (PBT/Networth) |
|
0.06
|
0.05 |
0.17 |
|
|
|
|
|
|
|
Debt Equity Ratio (Total Debt /Networth) |
|
0.88
|
0.58 |
0.60 |
|
|
|
|
|
|
|
Current Ratio (Current Asset/Current Liability) |
|
0.74
|
0.84 |
1.00 |
FINANCIAL ANALYSIS
[all figures are
in Rupees Millions]
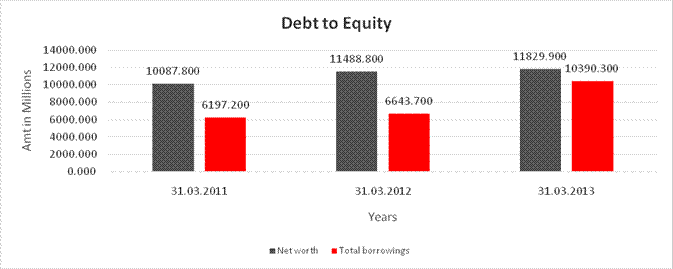
DEBT EQUITY RATIO
|
Particular |
31.03.2011 |
31.03.2012 |
31.03.2013 |
|
|
(Rs.
In Millions) |
(Rs.
In Millions) |
(Rs.
In Millions) |
|
Share Capital |
712.800 |
786.500 |
786.900 |
|
Reserves & Surplus |
9375.000 |
10702.300 |
11043.000 |
|
Net
worth |
10087.800 |
11488.800 |
11829.900 |
|
|
|
|
|
|
long-term borrowings |
1.400 |
0.000 |
2066.800 |
|
Short term borrowings |
6195.800 |
6643.700 |
8323.500 |
|
Total
borrowings |
6197.200 |
6643.700 |
10390.300 |
|
Debt/Equity
ratio |
0.614 |
0.578 |
0.878 |
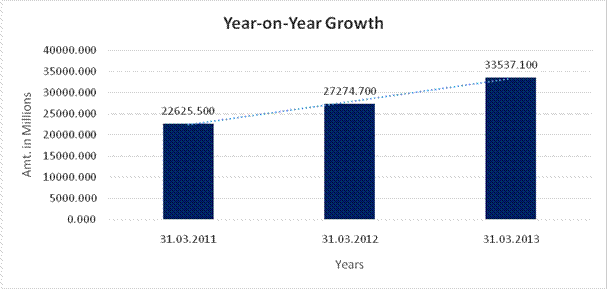
YEAR-ON-YEAR GROWTH
|
Year
on Year Growth |
31.03.2011 |
31.03.2012 |
31.03.2013 |
|
|
(Rs.
In Millions) |
(Rs.
In Millions) |
(Rs.
In Millions) |
|
Sales |
22625.500 |
27274.700 |
33537.100 |
|
|
|
20.548 |
22.960 |
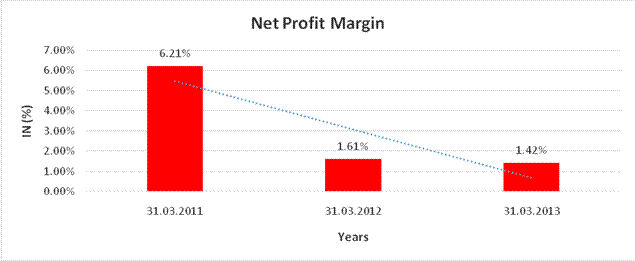
NET PROFIT MARGIN
|
Net
Profit Margin |
31.03.2011 |
31.03.2012 |
31.03.2013 |
|
|
(Rs.
In Millions) |
(Rs.
In Millions) |
(Rs.
In Millions) |
|
Sales |
22625.500 |
27274.700 |
33537.100 |
|
Profit |
1405.300 |
438.400 |
474.600 |
|
|
6.21% |
1.61% |
1.42% |
LOCAL AGENCY FURTHER INFORMATION
|
Sr. No. |
Check List by Info Agents |
Available in
Report (Yes / No) |
|
1] |
Year of Establishment |
Yes |
|
2] |
Locality of the firm |
Yes |
|
3] |
Constitutions of the firm |
Yes |
|
4] |
Premises details |
No |
|
5] |
Type of Business |
Yes |
|
6] |
Line of Business |
Yes |
|
7] |
Promoter's background |
No |
|
8] |
No. of employees |
No |
|
9] |
Name of person contacted |
Yes |
|
10] |
Designation of contact
person |
Yes |
|
11] |
Turnover of firm for last
three years |
Yes |
|
12] |
Profitability for last
three years |
Yes |
|
13] |
Reasons for variation
<> 20% |
----- |
|
14] |
Estimation for coming
financial year |
No |
|
15] |
Capital in the business |
Yes |
|
16] |
Details of sister
concerns |
Yes |
|
17] |
Major suppliers |
No |
|
18] |
Major customers |
No |
|
19] |
Payments terms |
No |
|
20] |
Export / Import details
(if applicable) |
No |
|
21] |
Market information |
----- |
|
22] |
Litigations that the firm
/ promoter involved in |
----- |
|
23] |
Banking Details |
Yes |
|
24] |
Banking facility details |
Yes |
|
25] |
Conduct of the banking
account |
----- |
|
26] |
Buyer visit details |
----- |
|
27] |
Financials, if provided |
Yes |
|
28] |
Incorporation details, if
applicable |
Yes |
|
29] |
Last accounts filed at
ROC |
Yes |
|
30] |
Major Shareholders, if
available |
No |
|
31] |
Date of Birth of
Proprietor/Partner/Director, if available |
No |
|
32] |
PAN of Proprietor/Partner/Director,
if available |
No |
|
33] |
Voter ID No of
Proprietor/Partner/Director, if available |
No |
|
34] |
External Agency Rating,
if available |
No |
|
Unsecured Loan |
Rs.
In Millions 31.03.2013 |
Rs.
In Millions 31.03.2012 |
|
Long-Term Borrowings |
|
|
|
Deferred payment liabilities |
|
|
|
Sales tax loan (interest free) |
0.500 |
0.000 |
|
Short-Term Borrowings |
|
|
|
Other loan from banks |
6997.600 |
5832.300 |
|
|
|
|
|
TOTAL |
6998.100 |
5832.300 |
|
NOTES SHORT-TERM BORROWINGS Other loans from
banks include buyer’s credit arrangements and export bill discounting. They
are repaid / rolled over after a period of six months and carry interest
@0.95-2% (excluding hedging premium). |
||
VIEW INDEX OF CHARGES
|
S.
No. |
Charge
ID |
Date
of Charge Creation/Modification |
Charge
amount secured |
Charge Holder |
Address
|
Service
Request Number (SRN) |
|
1 |
10401862
|
22/01/2013
|
2,500,000,000.00
|
STATE BANK OF INDIA |
STATE BANK BHAVAN, MADAME CAMA
ROAD, MUMBAI, MAHARASHTRA - 400021, INDIA |
B67457549
|
|
2 |
10402643
|
22/01/2013
|
1,500,000,000.00
|
EXPORT-IMPORT BANK OF INDIA |
CENTRE ONE BUILDING, 21ST FLOOR,
WORLD TRADE CENTRE, CUFFE PARADE, MUMBAI, MAHARASHTRA - 400005, INDIA |
B67905901
|
|
3 |
10403684
|
22/01/2013
|
5,730,000,000.00
|
STATE BANK OF INDIA |
NEVILLE HOUSE, J.N. HEREDIA
MARG, BALLARD ESTATE, MUMBAI, MAHARASHTRA - 400001, INDIA |
B68308972
|
|
4 |
10403874
|
22/01/2013
|
1,750,000,000.00
|
YES BANK LIMITED |
9TH FLOOR, NEHRU CENTRE,
DISCOVERY OF INDIA, DR. ANNIE BESANT ROAD, WORLI, MUMBAI, MAHARASHTRA-400018,
INDIA |
B68452630
|
|
5 |
10403942
|
22/01/2013
|
1,500,000,000.00
|
KOTAK MAHINDRA BANK LIMITED |
36-38A, NARIMAN BHAVAN, 227,D,
NARIMAN POINT, MUMBAI, MAHARASHTRA - 400021, INDIA |
B68489483
|
|
6 |
10405909
|
22/01/2013
|
3,000,000,000.00
|
CORPORATION BANK |
CORPORATE BANKING BRANCH, 104 BHARAT
HOUSE, M S MARG, FORT, MUMBAI, MAHARASHTRA - 400023, INDIA |
B68634260
|
|
7 |
10405941
|
22/01/2013
|
8,920,000,000.00
|
ICICI BANK LIMITED |
LANDMARKRACE COURCE CIRCLE,
ALKAPURI, BARODA, GUJARAT - 390015, INDIA |
B68594027
|
|
8 |
10406455
|
22/01/2013
|
4,250,000,000.00
|
BANK OF MAHARASHTRA |
LOKMANGAL, 1501, SHIVAJINAGAR,
PUNE, MAHARASHTRA- 411005, INDIA |
B68926468
|
|
9 |
10406463
|
22/01/2013
|
3,930,000,000.00
|
BANK OF BARODA |
CORPORATE FINANCIAL SERVICES BRANCH,
MANTRI COURT, 1ST FLOOR, 39 RAMABAI AMBEDKAR ROAD, PUNE, MAHARASHTRA -
411001, INDIA |
B68906957
|
|
10 |
10406828
|
22/01/2013
|
3,000,000,000.00
|
AXIS BANK LIMITED |
TRISHUL 3RD FLOOR OPP
SAMARTHESHWAR TEMPLE, LAW G |
B69045763
|
|
11 |
10406831 |
22/01/2013 |
750,000,000.00 |
CITI BANK N.A. |
CITIGROUP CENTRE, 7TH FLOOR,
BANDRA -KURLA COMPLEX, BANDRA (EAST), MUMBAI, MAHARASHTRA - 400051, INDIA |
B69079408 |
|
12 |
10406841 |
22/01/2013 |
2,000,000,000.00 |
EXPORT-IMPORT BANK OF INDIA |
CENTRE ONE BUILDING, 21ST
FLOOR, WORLD TRADE CENTRE, CUFFE PARADE, MUMBAI, MAHARASHTRA - 400005, INDIA |
B69101673 |
|
13 |
10406848 |
22/01/2013 |
1,500,000,000.00 |
HDFC BANK LIMITED |
HDFC BANK HOUSESENAPATI BAPAT
MARG, LOWER PAREL W, MUMBAI, MAHARASHTRA - 400013, INDIA |
B69045904 |
|
14 |
10406868 |
22/01/2013 |
6,750,000,000.00 |
ORIENTAL BANK OF COMMERCE |
F.C. ROAD,, 917-20/20A, OBC
TOWER, PUNE, MAHARASHTRA - 411004, INDIA |
B69045854 |
|
15 |
10406870 |
22/01/2013 |
2,750,000,000.00 |
UNION BANK OF INDIA LIMITED |
UNION BANK BHAVAN, 239, VIDHAN
BHAVAN MARG, MUMBAI, MAHARASHTRA - 400021, INDIA |
B69078129 |
|
16 |
90141388 |
09/11/2004 |
2,240,500,000.00 |
HOUSING DEVELOPMENT FINANCE
CORPORATION LIMITED |
RAMAN HOUSE; H.T PARAKH MARG,
BACKBAY RECLAMATION; CHURCHGATE, MUMBAI, MAHARASHTRA - 400020, INDIA |
- |
|
17 |
90144133 |
19/10/2002 |
457,700,000.00 |
IL AND FS TRUST COMPANY
LIMITED |
IL AND FS CENTRE, C-22;BLOCK
G;BANDRA KURLA, MUMBAI, MAHARASHTRA - 400051, INDIA |
- |
CORPORATE
INFORMATION
Subject is a
public company domiciled in India and incorporated under the provisions of the
Companies Act, 1956. Its shares are listed on two stock exchanges in India. The
company is primarily engaged in the manufacture and sale of Power and Telecom
products and solutions. Telecom products and solutions mainly include
integrated optical fiber, other Telecom products such as fiber optical cables,
copper Telecom cables, structured data cables, access equipments, fiber
connectivity and system integration solution offerings for Telecom networks and
other service providers. Power products and solutions mainly includes power
transmission conductors and cables.
PERFOR MANCE
Fiscal year
2012-13 closed with Revenues of Rs. 33540.000 Millions, EBITDA of Rs. 2600.000
Millions, PAT of Rs. 470.000 Millions and EBITDA margins of 8%. The Telecom
business had revenues of Rs. 10560.000 Millions at an EBITDA margin of 15.74%
and the power business had revenues of Rs. 22300.000 Millions at an EBITDA
margin of 4.22%.
SUBSIDIARY COMPANIES AND JOINT VENTURES
At the end of the year,
the Company has nine Subsidiary Companies and two Joint Ventures, the details
of which are given below:
- STERLITE GRID LIMITED (SGL)
SGL is a wholly
owned subsidiary of the Company incorporated to undertake power transmission
(IPTC) projects. SGL is currently executing multi-Million dollar power
transmission system projects, Pan-India via its wholly-owned subsidiary
companies, awarded on a ‘Build, Own, Operate and Maintain’ (BOOM) basis. In
accordance with this, transmission lines would be commissioned and the Company
would operate and maintain the same for a minimum tenure of 35 years through
project SPVs acquired through competitive bidding process.
- EAST-NORTH INTERCONNECTION COMPANY
LIMITED (ENICL)
ENICL project
involves establishment of two 400 kV Double Circuit transmission lines that
would respectively connect the Indian states of Assam with West Bengal and
Bihar. This project has 18 identified beneficiaries (mainly SEBs in the states
of Rajasthan, Punjab, Haryana, Uttaranchal and the city of Delhi), who would be
directly benefitted by this project. Out of the two lines, one line will be
operational in the first quarter of the FY 2013-14, while the second line will
be operational in the third quarter of the FY 2013-14.
- BHOPAL DHULE TRANSMISSION COMPANY
LIMITED (BDTCL)
BDTCL project
involves establishment of four 765 kV Single Circuit and two 400 kV Double
Circuit transmission lines that would strengthen the transmission system in the
Indian states of Madhya Pradesh, Maharashtra and Gujarat. The project is
expected to be completed before the end of March 2014.
- JABALPUR TRANSMISSION COMPANY LIMITED
(JTCL)
JTCL project
involves establishment of a 765 kV Double Circuit and a 765 kV Single Circuit
transmission line each, that would strengthen the transmission system in the
Indian states of Chhattisgarh and Madhya Pradesh. The project is expected to be
completed before March 2014. The Company achieved financial closure during the
year.
- JIANGSU STERLITE TONGGUANG FIBER
COMPANY LIMITED (JSTFCL)
The Company is a
Joint Venture with Tongguang Group of China to set up an Optical Fiber
Manufacturing Facility in China. During the year, JSTFCL commenced the
production of optical fiber at their new facility located at Haimen, Jiangsu
Province, China.
- STERLITE DISPLAY TECHNOLOGIES PRIVATE
LIMITED (SDTPL )
The Company is
currently exploring various growth opportunities including liquid crystal
displays (LCD s) glass manufacturing and other related products.
- STERLITE NETWORKS LIMITED (SNL)
SNL is providing shared
last mile infrastructure for Broadband connectivity, dark fiber and duct space
leasing, tower fiber connectivity, backhaul connectivity, wifi –hot spots, DAS
/ IBS etc. Under the FiON™ brand, SNL has
created FTTX
infrastructure in 6 major cities pan-India, connecting over 70,000 homes,
serving 6500 subscribers from all major Telecom Service Providers like Airtel,
Tata, Spectranet, etc.
SNL, in less than
2 years of its existence, has filed 14 domestic and 5 international
applications for patents. Several other Intellectual Property applications are
in pipeline.
- MAHARASHTRA TRANSMISSION COMMUNICATION INFRASTRUCTURE LIMITED
(MTCIL)
MTCIL,
incorporated in August 2012, is a Joint Venture (JV) between Maharashtra State
Electricity Transmission Company Limited (MSETCL). MTCIL which is held 51% by
the Company, was formed with the objective of establishing an OPGW-based
communication network over MSETCL’s EHV transmission infrastructure in the
state of Maharashtra.
- STERLITE GLOBAL VENTURES (MAURITIUS) LIMITED (SGVML)
SGVML holds
downstream investment of the Company made in Jiangsu Sterlite Tongguang Fiber
Company Limited.
- STERLITE TECHNOLOGIES AMERICAS, LL C (STA )
STA is a limited
liability company set up in USA to carry the business operations in USA.
- STERLITE TECHNOLOGIES EUROPE VENTURES LIMITED - CYPRUS (STEVL)
STEVL,
incorporated in Cyprus is a wholly owned subsidiary of the Company, with an
objective to carry on business operations in the European Union.
NETWORK FOR SPECTRUM (NFS)
Another mega fiber
rollout is being undertaken in India, owing to spectrum shortage arising due to
scarcity of this
critical wireless
resource. The Telecom Regulatory Authority of India (TRAI) estimates that to
meet the growing needs of 2G and 3G services in India will require around 500
to 800MHz of spectrum in the next 5 years. The Department of Telecom (DoT) and
the country’s Defense forces have come together to make available this
spectrum.
The defense forces
are vacating 80 Mhz for commercial use in lieu of alternative backbone network
i.e. Network For Spectrum (NFS) also known as ‘Nationwide Communication
Network’, being built by state-owned telcos. The groundwork for this project to
lay 57,000 kms of optical fiber cable is already underway.
All these
developments concur with their belief that the demand for optical fiber across
the globe is there to stay with the ever increasing IP traffic. Today fiber is
the only medium which can enable this data traffic complementing wireless and
legacy copper networks. Sterlite’s extensive portfolio of fiber solutions helps
service
providers and
utilities in creating efficient and future proof networks to enable the
explosion of data across networks globally. Another segment that Sterlite
caters is the power segment, enabling transmission infrastructure to meet the
growing electricity needs of the people across the world.
CAPACITY ADDITIONS
TO MEET THE RISING DEMAND
Globally,
generation capacity additions by all sources would be needed to keep pace with
rising demand and to replace capacity that will be retired (1980 MW) over
2012-2035. It is expected that the gross capacity additions from 2012-2035 will
be about 5,891 GW. Further, over 37% of the cumulative capacity addition will
be in China and India alone, as these countries seek greater access to
electricity.
Modern Renewable
Energy (RE) sources such as wind and solar PV have cemented their positions in
the energy mix after years of mainstreaming. It is projected that wind will
achieve about 20% of penetration in the European Union (EU) in next two
decades. Strong growth in markets like the US, China and India is projected,
thus underpinning the government support. Also, wind power capacity is set to
reach 1,098 GW by 2035 growing at a CAGR of 6.6% from the levels of 2011, as
per IEA estimates. Solar sector has witnessed a sky-rocketing growth in recent
years on account of substantial falls in solar PV costs. Globally, the solar PV
sector is expected to add another 662 GW by 2035 large capacity additions expected
in EU, the US, China, India and Japan.
In 2012, the
United Nations launched a global initiative – “Sustainable Energy for All” ,
which aims to double RE share in global energy mix by 2030, double the global
rate of improvement in energy efficiency and to ensure universal access to
modern energy services. Energy sustainability – based on these three core
dimensions – is inextricably interwoven such that reaching these goals by 2035
would mean RE’s contribution of 31% of total electricity, second only to coal.
Essentially, subsidies offered to make the RE proposition attractive, fueled
the growth of RE sources. World Energy Outlook 2012 reports that the subsidies
will rise from US$88 Billion globally in 2011 to US$240 Billion in 2035.
Two consecutive
grid blackouts raised fundamental questions about the aptness of the
regulations, the government’s investment strategy in transmission system,
technological uptake philosophy and system operating practices governing
transmission system security. However, amidst inadequate infrastructure, a
crippling power shortage, fuel shortage, bleeding DISCO Ms and yawning absence
of state-governmental action, Power Industry’s response to the blackout and
short-to-long-term solution-finding efforts are likely to provide the leadership
and drive needed to avoid unduly exposing transmission systems to the risk of
further substantial power failures. Central agencies are initiating steps to
enhance the ability of a power transmission system to withstand the unexpected
loss of key components.
Development and
deployment of new and existing technologies ranging from high temperature low
sag conductors to power monitoring devices to Ultra high voltage lines to
Automatic Control Systems are envisaged. Investment into expansion of transmission
line capacity to alleviate transmission congestion has also been planned.
INDIA’S TRANSMISSION SECTOR
In India, strategy
of transmission development is commensurate with generation and load growth,
creation of highways leading to strengthening of National Grid and conservation
of Right-of-Way. Government policies also point to a huge thrust on
transmission sector in terms of capacity buildup and planned expenditures for
the 12th Plan.
A total of about
1,07,440 ckm of transmission lines; 2,70,000 MVA of AC transformer capacity and
12,750 MW of
HVDC systems are
estimated as needed during the 12th Plan.
The 12th
five-year-plan is expected to register maximum growth in terms of capacity addition
through 400 kV lines - backbone of transmission infrastructure in India.
Historically, the
focus of the power sector in the country has primarily been on addition of
generation capacities. There is also a clear trend in terms of shift of focus
on transmission. The share of investment in transmission for the 12th Plan and
the 13th Plan is substantially higher than it was for the previous
five-year-plans.
While cost
uncertainties due to volatility in metal prices and Forex are other deterrents,
commodity present value as pass through will help in risk sharing, transmission
project funding should be made available at lower cost a priority to PFC and
REC.
Bulk Power
Companies (BPCs) put a strict control on the technical specification as they
micro-specify various technical and commercial aspects. This results in long
bidding process and restricted uptake of new technologies and practices.
Engaging private sector in specification development and policy making will
allow new technology adoptions and provide a level playing field for entry of
competitive and reliable players.
In order to
accelerate the contribution of private players in transmission sector, the
degree of involvement of developer in the planning and development process can
and should be elevated from just being a Quasi-EPC to a stakeholder. Renewable
energy has been an important component of India’s energy planning process.
Since the 9th Plan period, the share of renewable capacity has increased from
2% to 12% of the total installed capacity of 223, 870 MW as on today, a 6-fold
increase. Electricity generation due to renewable source has also increased to
about 6% in overall electricity generation mix as on today. With such
multi-fold growth, penetration of renewable power in the Indian grid has
increased. Presently, about 28,000 MW grid interactive RE generation capacity
is available. Out of this about 70% grid interactive capacity is contributed by
the wind alone.
India would take
its new and renewable capacities to 55,000 MW by 2017, the terminal year of the
12th five-yearplan. The projected change in the mix of generation by fuel
supply by the end of 2030 is tilting in favour of RE. The share of renewable
energy in electricity generated is expected to rise from around 6% in 2012 to
9% in 2017 and 16% in 2030.
GREEN ENERGY
CORRIDORS: AN ELECTRIFYING EXAMPLE IN THE TRANSMISSION SECTOR
While fossil-fuel
generation resources have some flexibility in terms of close proximity of the
site to existing transmission grid, integration of RE poses a special challenge
as the site of renewable resources is largely dictated by nature. Intermittent
availability as well as variability of energy and lesser grid support during
system disturbance and exigencies stymie growth of power evacuation/grid facilities
and transmission planning. Further, the transmission investments needed to meet
these challenges have not kept pace with the rapid growth of renewable energy
capacity in the past few years.
In order to
facilitate the development of transmission system as well as other
infrastructure facilities as a part of the renewable capacity addition
programme in the 12th Plan, the estimated investment for the transmission
development plan for integration of renewable energy by Central Transmission
Utility (CTU) and the identified State Transmission Utility (STU) under PGCIL’s
study is Rs. 425570.000 Millions.
ROAD TO THE
FUTURE: TRANSMISSION FOR 2030
Considering the
huge thrust on realizing wind and solar potential as well as the impetus given
on development of other RE technologies, a perspective transmission plan for
renewable energy, that serves as a road map, has been chalked out for the year
2030 in PGCIL study. In line with this, broad contours of transmission plan for
2030 has been prepared with the following approach:
i. Development of
Hybrid EHV AC/ HVDC Transmission system for flexibility of controls
ii.
Interconnection of RE rich regions as well as with major load centers as touch
points
iii. Establishment
of transmission corridors passing through conventional generation complexes
including Andhra Pradesh (gas), Odisha (coal) and Jharkhand (coal) as well as
new transmission corridors from hydro-rich areas to achieve supply balance.
Nine new ultra-high
capacity transmission corridors have been proposed. These corridors will not
only dispatch the energy generated from proposed renewable energy capacity to
high-demand centres across the country, but will also complement the parallel
transmission system of conventional generation projects/grid strengthening
schemes, for transfer of power as well as help maintain the grid parameters.
NEED TO SPRING IN
NEWER TECHNOLOGY PARADIGMS
Transmission
system build out was historically planned to link large stationary power plants
to nearby demand centers. However, traditional approach to transmission
planning is rendered ineffective, if not completely obsolete, in the context of
changing energy mix, RoW issues, open access in transmission and need to add certain
degree of redundancies in the case of eventualities and future proofing
contingencies. Technology will be crucial in bringing about this
transformation.
The technological
strides which India seeks to take in the near future includes high capacity transmission
corridors comprising 765 kV AC lines, expansion of 1200 kV AC system, Gas
Insulated Substations (GIS) and high temperature low sag conductor line.
Going forward, it
is imperative for the company to expand energy supplies and transmission
capacity in a way that
is sustainable.
Moreover, sustainable development mandates emphasis on new policies and
planning approaches, investment mechanism and new technologies. Thus,
transmission sector is poised for high growth and renders unique opportunities
for private players.
Sterlite
Technologies is the leading provider for power conductors in India today, and
with an extensive portfolio of high performance conductors, enabling the
utilities in the country and abroad to build efficient and sustainable power transmission
lines
FIXED ASSETS
- Freehold land
- Leasehold land
- Buildings
- Plant and machinery
- Furniture and fixtures
- Data processing equipment
- Office equipment
- Electric fittings
- Vehicles
STANDALONE FINANCIAL RESULTS
FOR THE QUARTER AND NINE MONTH ENDED DECEMBER31, 2013
Rs. In Millions
|
Particulars |
Quarter ended |
Nine Month ended |
||
|
31.12.2013 |
30.09.2013 |
31.12.2013 |
||
|
Unaudited |
Unaudited |
Unaudited |
||
|
1 |
Income from Operations |
|
|
|
|
|
(a) Net sates/income from operations (Net
of excise duty) |
6662.300 |
6288.100 |
20398.200 |
|
|
(b) Other Operating Income |
135.600 |
136.800 |
407.800 |
|
|
Total income from operations (net) |
6797.900 |
6424.900 |
20806.000 |
|
2 |
Expenses |
|
|
|
|
|
(a) Cost of materials consumed |
4433.700 |
6524.700 |
13994.200 |
|
|
(b) Purchases of stock-in trade |
13.100 |
68.500 |
163.700 |
|
|
(c) Changes in inventories of finished
goods. work-in-progress and stock in trade |
339.200 |
(456.900) |
(333.600) |
|
|
(d) Employees Cost |
295.600 |
363.200 |
1003.700 |
|
|
(e) Depreciation and Anmortisation Expenses |
256.300 |
254.100 |
747.600 |
|
|
(f) Other Expenses |
1210.300 |
1387.600 |
4112.600 |
|
|
Total expenses |
6548.200 |
6141.200 |
19688.200 |
|
3 |
Profit/ (Loss) from operations before other
Income, finance costs and exceptional Items (1-2) |
249.700 |
283.700 |
1117.800 |
|
4 |
Other Income |
37.500 |
44.600 |
114.700 |
|
5 |
Profit/ (Loss) from operations before other
income, finance costs and exceptional items (3+4) |
287.200 |
328.300 |
1232.500 |
|
6 |
Finance Costs |
226.600 |
164.300 |
669.100 |
|
7 |
Profit before tax (5-6) |
60.600 |
164.000 |
563.400 |
|
8 |
Tax expenses |
6.400 |
43.700 |
162.900 |
|
9 |
Net Profit after tax (7+8) |
54.200 |
120.300 |
400.500 |
|
10 |
Paid up equity share capital (Face Value of
Rs.2/- each) |
787.300 |
787.300 |
787.300 |
|
11 |
Reserve excluding Revaluation Reserve as per
Balance Sheet of previous accounting year |
-- |
-- |
-- |
|
12 |
Earnings per share (Rs.) - Basic |
0.14 |
0.31 |
1.02 |
|
13 |
Earnings per share (Rs.) - Diluted |
0.14 |
0.31 |
1.02 |
|
|
|
|
|
|
|
A |
PARTICULARS OF SHAREHOLDING |
|
|
|
|
1 |
Public Shareholding |
|
|
|
|
|
- Number of shares |
178,439,193 |
178,439,193 |
178,439,193 |
|
|
- Percentage of shareholding |
45.33% |
45.33% |
45.33% |
|
2 |
Promoters and Promoter group shareholding |
|
|
|
|
|
a) Pledged / Encumbered |
|
|
|
|
|
- Number of shares |
-- |
-- |
-- |
|
|
- Percentage of shares (as a % of the total
shareholding of Promoter & Promoter group) |
-- |
-- |
-- |
|
|
- Percentage of shares (as a % of the total
Share Capital of the Company) |
-- |
-- |
-- |
|
|
b) Non Encumbered |
|
|
|
|
|
- Number of shares |
215,218,656 |
215,218,656 |
215,218,656 |
|
|
- Percentage of shares (as a % of the total
shareholding of Promoter & Promoter group) |
100% |
100% |
100% |
|
|
- Percentage of shares (as a % of the total
Share Capital of the Company) |
54.67% |
54.67% |
54.67% |
Rs. In Millions
|
Particulars |
Quarter ended |
Nine Month ended |
||
|
31.12.2013 |
30.09.2013 |
31.12.2013 |
||
|
Unaudited |
Unaudited |
Unaudited |
||
|
1 |
Segment Revenue |
|
|
|
|
|
|
|
|
|
|
|
Power Project and Solutions |
3827.700 |
4201.800 |
12562.900 |
|
|
Telecom Products and Solutions |
2834.600 |
2086.300 |
7835.300 |
|
|
Total |
6662.300 |
6288.100 |
20398.200 |
|
|
|
|
|
|
|
|
Profit Before
Interest, Depreciation and Tax |
|
|
|
|
|
Power Project and Solutions |
168.100 |
256.900 |
668.100 |
|
|
Telecom Products and Solutions |
375.400 |
325.500 |
1312.000 |
|
|
Total |
543.500 |
582.400 |
1980.100 |
|
|
|
|
|
|
|
|
Profit Before
Interest and Tax |
|
|
|
|
|
Power Project and Solutions |
95.900 |
182.000 |
450.300 |
|
|
Telecom Products and Solutions |
191.300 |
146.300 |
782.200 |
|
|
Total |
287.200 |
328.300 |
1232.500 |
|
|
|
|
|
|
|
|
Interest Cost |
226.600 |
164.300 |
669.100 |
|
|
|
|
|
|
|
|
Profit Before
Tax |
60.600 |
164.300 |
563.400 |
|
|
|
|
|
|
|
|
Capital Employed
(Segment Assets – Segment Liabilities) |
|
|
|
|
|
Power Project and Solutions |
3843.300 |
3930.400 |
3843.300 |
|
|
Telecom Products and Solutions |
11870.700 |
11592.500 |
11870.700 |
|
|
Unallocable |
8598.400 |
7751.500 |
8598.400 |
|
|
Total |
24312.400 |
23274.500 |
24312.400 |
NOTES
- In terms of clause
41 of the listing agreement, details of number of inventor complaints for
the quarter ended December 31, 2013: Beginning – 0, Received -86, Disposed
off – 86, Pending 0.
- The above
results have been reviewed by the Audit Committee. The Board of directors
at its meeting held on January 30, 2014 approved the above results.
- During the
year 2005-06, the CESTAT had upheld a demand of Rs. 1880.000 Millions
(including penalties thereon and excluding interest) in the pending excise
matter. The auditors have expressed their qualification on this matter.
The company is contesting this case and the matter is pending the decision
of the Honb’le Supreme Court.
- Previous
period figures have been regrouped / rearranged wherever considered
necessary.
WEBSITE DETAILS
NEWS
STERLITE GRID WINS
TWO MORE POWER TRANSMISSION PROJECTS
... Projects valued at Rs 650 Crore
... The RAPP-Unit 7, 8 transmission project involves establishment of 400 kV double circuit line; to further strengthen power transfer capability from Northern Grid to Western Grid
... The ERRS-7 project will transmit power using two 400 kV double circuit lines as well as 400 kV Multi-circuit towers a first in private sector in India
... Forms a part of the transmission systems strengthening project awarded to Sterlite Grid Limited on a 'Build, Own, Operate and Maintain' (BOOM) basis
...Transmission lines to be commissioned in 28 months; Sterlite Grid Limited Company would thereafter operate and maintain the same for a minimum tenure of 35 years thereafter.
Pune, India – September 20, 2013: Sterlite Grid Limited, a subsidiary of Sterlite Technologies Limited, has secured two major projects with a total project outlay of about Rs 6500.000 Millions. Both the transmission projects will be developed on BOOM basis, and has been awarded by Power Finance Corporation of India – the nodal agency.
The first project – Rajasthan Atomic Power Project “RAPP-Unit 7, 8” transmission project – will transfer power from the atomic power plant near Kota in Rajasthan to Shujalpur in Madhya Pradesh. The transmission systems will evacuate and transmit power through a network of about 200 km long 400 kV double circuit line. This line, when commissioned, will further strengthen power transfer capability from Northern Grid to Western Grid.
The second project, namely “ERRS-7” will include establishment of two 400 kV double circuit lines between Ranchi and Chaibasa in Jharkhand; besides Kharagpur and Purulia in West Bengal. The total line length is around 450 km and the project will include 400 kV Multi-circuit towers near Ranchi substation. This is considered to be the first of its kind private sector transmission projects in India. The project will further strengthen Sterlite’s presence in the Eastern region after the recent commissioning of the Purnia-Bihar Sharif line in Bihar
“These projects strengthen our presence in Eastern and Western regions and will also mark our entry into the states of Rajasthan and Jharkhand. Further, in terms of growth potential in the transmission sector, these states have significant growth potential and fit well in our future growth plans,” said Pravin Agarwal, Director, Sterlite Technologies Limited.
About Sterlite
Technologies Limited
Sterlite Technologies Limited (“Sterlite”) [BSE: 532374, NSE: STRTECH], is a leading global provider of transmission solutions for the power and telecom industries. Equipped with a product portfolio that includes power conductors, optical power ground wire, EHV/HV power cables, optical fibers, telecommunication cables and a comprehensive telecom systems / solutions portfolio, Sterlite's vision is to 'Connect every home on the planet'.
STERLITE TECHNOLOGIES
POSTS H1SALES OF RS 14000.000 MILLIONS
... Commences Q3 FY14 with confirmed orders of about Rs 25000.000 Millions
Pune, India – October 25, 2013: Sterlite Technologies Limited [BSE: 532374, NSE: STRTECH], a leading global provider of transmission solutions for the telecom and power industries, today announced its second quarter and half year results for Financial Year 2014.
Financial highlights:
• Sterlite closed H1 of FY 14 with EBITDA of Rs 1440.000 Millions over revenues of Rs 14010.000 Millions translating into a profitability margin of 10%
• Net Income for the company has Rs 230.000 Millions in H1 FY 13 to Rs 350.000 Millions in H1, FY14 improved by 120 basis points from
• The company had a healthy flow of orders in the quarter and starts the Q3, FY 14 with a strong open order book of Rs 25000.000 Millions.
• Q2 FY 14 accounted for International revenues of Rs. 2700.000 Millions (42% of total revenues)
Business Highlights
In the Telecom
Segment
• Launch of 3 new products in the Bend-insensitive, BOW-LITE family of fiber, extending the telecom portfolio catering to FTTx applications.
• Global footprints expanded with orders from one of the fastest growing telecom companies in Africa.
• Received one of largest cable orders in the last 3 years from a leading domestic operator which will be using Sterlite’s enhanced fiber.
In The Power segment
• Strengthened global presence with entry in to two new geographies with exports now contributing more than 50% of the open order book
• Secured the largest export order ever (~ 95 M USD) in the Latin America market.
In the Infrastructure
segment
• Successful completion of the first line (Purnia – Bihar Sharif) for the ENICL, India’s first Ultra mega transmission project in a record period of 26 months
• Two new projects won in this Quarter: RAPP 7, 8 and ERSS – 7, with total project outlay of Rs. 6500.000 Millions.
“We continue to see consistent demand visibility for optical fiber and power conductors across geographies driven by trends like National Broadband Plan, 4G and improving regulatory environment in power sector. In a challenging economic environment, we remain committed to our strategy and our customers, and we are encouraged by increasing customer interest in our end-to-end solutions offerings,” says Mr Pravin Agarwal, Whole-time
Director, Sterlite Technologies Limited
STERLITE TECHNOLOGIES
SALES OF RS.6800.000 MILLIONS IN Q3
...Commences Q4 FY14 with order book of Rs. 26000.000 Millions
Pune, India – January 30, 2014: Sterlite Technologies Limited [BSE: 532374, NSE: STRTECH], a leading global provider of transmission solutions for the telecom and power industries, today announced its third quarter results for Financial Year 2014
Financial highlights
for Q3 FY14
Sterlite closed Q3FY14 with total revenue of Rs. 6800.000 Millions and EBITDA of Rs. 540.000 Millions, translating in a profitability margin of 8%
The EBITDA margin for 9M FY 14 at 9.5% shows improvement compared to same period last year
Exports account for 35% of total revenues in Q3 FY14, with addition of six new key customer accounts
Open order book at end of the Q3 FY14 at Rs. 26000.000 Millions with exports constituting close to 50%
Segment Review:
Telecom Segment
• Highest ever sales volumes in a quarter for optical fiber cable at 1.6 million fiber km
• Secured largest share for supply of Optical fiber cables and accessories in the prestigious National Optical Fiber Network (NOFN) project to connect 2,50,000 village panchayat
Power Segment
• Healthy flow of orders supported by addition of new strategic customer accounts in the European and African region. Open order book at end of the Q3 FY14 at Rs. 24000.000 Millions with an exports accounting to around 55%
• Received a certificate of appreciation for best product by an Indian exhibitor at ELECRAMA 2014 for registered product UltraEFF®, low loss power cable that reduces energy loss by 10%.
CMT REPORT (Corruption, Money Laundering & Terrorism]
The Public Notice information has been collected from various sources
including but not limited to: The Courts,
1] INFORMATION ON
DESIGNATED PARTY
No exist designating subject or any of its beneficial owners,
controlling shareholders or senior officers as terrorist or terrorist
organization or whom notice had been received that all financial transactions
involving their assets have been blocked or convicted, found guilty or against
whom a judgement or order had been entered in a proceedings for violating
money-laundering, anti-corruption or bribery or international economic or
anti-terrorism sanction laws or whose assets were seized, blocked, frozen or
ordered forfeited for violation of money laundering or international
anti-terrorism laws.
2] Court Declaration :
No records exist to suggest that subject is or
was the subject of any formal or informal allegations, prosecutions or other
official proceeding for making any prohibited payments or other improper
payments to government officials for engaging in prohibited transactions or
with designated parties.
3] Asset Declaration :
No records exist to suggest that the property or assets of the subject
are derived from criminal conduct or a prohibited transaction.
4] Record on Financial
Crime :
Charges or conviction
registered against subject: None
5] Records on Violation of
Anti-Corruption Laws :
Charges or
investigation registered against subject: None
6] Records on Int’l
Anti-Money Laundering Laws/Standards :
Charges or
investigation registered against subject: None
7] Criminal Records
No available
information exist that suggest that subject or any of its principals have been
formally charged or convicted by a competent governmental authority for any
financial crime or under any formal investigation by a competent government
authority for any violation of anti-corruption laws or international anti-money
laundering laws or standard.
8] Affiliation with
Government :
No record
exists to suggest that any director or indirect owners, controlling shareholders,
director, officer or employee of the company is a government official or a
family member or close business associate of a Government official.
9] Compensation Package :
Our market
survey revealed that the amount of compensation sought by the subject is fair
and reasonable and comparable to compensation paid to others for similar
services.
10] Press Report :
No press reports / filings exists on
the subject.
CORPORATE GOVERNANCE
MIRA INFORM as part of its Due Diligence do provide comments on
Corporate Governance to identify management and governance. These factors often
have been predictive and in some cases have created vulnerabilities to credit
deterioration.
Our Governance Assessment focuses principally on the interactions
between a company’s management, its Board of Directors, Shareholders and other
financial stakeholders.
CONTRAVENTION
Subject is not known to have contravened any existing local laws,
regulations or policies that prohibit, restrict or otherwise affect the terms
and conditions that could be included in the agreement with the subject.
FOREIGN EXCHANGE RATES
|
Currency |
Unit
|
Indian Rupees |
|
US Dollar |
1 |
Rs.60.38 |
|
|
1 |
Rs.101.63 |
|
Euro |
1 |
Rs.83.57 |
INFORMATION DETAILS
|
Information
Gathered by : |
PLK |
|
|
|
|
Report Prepared
by : |
NTH |
SCORE & RATING EXPLANATIONS
|
SCORE FACTORS |
RANGE |
POINTS |
|
HISTORY |
1~10 |
6 |
|
PAID-UP CAPITAL |
1~10 |
6 |
|
OPERATING SCALE |
1~10 |
6 |
|
FINANCIAL CONDITION |
|
|
|
--BUSINESS SCALE |
1~10 |
6 |
|
--PROFITABILIRY |
1~10 |
6 |
|
--LIQUIDITY |
1~10 |
6 |
|
--LEVERAGE |
1~10 |
6 |
|
--RESERVES |
1~10 |
6 |
|
--CREDIT LINES |
1~10 |
6 |
|
--MARGINS |
-5~5 |
-- |
|
DEMERIT POINTS |
|
|
|
--BANK CHARGES |
YES/NO |
YES |
|
--LITIGATION |
YES/NO |
NO |
|
--OTHER ADVERSE INFORMATION |
YES/NO |
NO |
|
MERIT POINTS |
|
|
|
--SOLE DISTRIBUTORSHIP |
YES/NO |
NO |
|
--EXPORT ACTIVITIES |
YES/NO |
NO |
|
--AFFILIATION |
YES/NO |
YES |
|
--LISTED |
YES/NO |
YES |
|
--OTHER MERIT FACTORS |
YES/NO |
YES |
|
DEFAULTER |
|
|
|
--RBI |
YES/NO |
NO |
|
--EPF |
YES/NO |
NO |
|
TOTAL |
|
54 |
This score serves as a reference to assess
SC’s credit risk and to set the amount of credit to be extended. It is calculated
from a composite of weighted scores obtained from each of the major sections of
this report. The assessed factors and their relative weights (as indicated
through %) are as follows:
Financial
condition (40%) Ownership
background (20%) Payment record
(10%)
Credit history
(10%) Market trend (10%) Operational size
(10%)
RATING EXPLANATIONS
|
RATING |
STATUS |
PROPOSED CREDIT LINE |
|
|
>86 |
Aaa |
Possesses an extremely sound financial base with the strongest capability
for timely payment of interest and principal sums |
Unlimited |
|
71-85 |
Aa |
Possesses adequate working capital. No caution needed for credit
transaction. It has above average (strong) capability for payment of interest
and principal sums |
Large |
|
56-70 |
A |
Financial & operational base are regarded healthy. General
unfavourable factors will not cause fatal effect. Satisfactory capability for
payment of interest and principal sums |
Fairly Large |
|
41-55 |
Ba |
Overall operation is considered normal. Capable to meet normal
commitments. |
Satisfactory |
|
26-40 |
B |
Capability to overcome financial difficulties seems comparatively
below average. |
Small |
|
11-25 |
Ca |
Adverse factors are apparent. Repayment of interest and principal sums
in default or expected to be in default upon maturity |
Limited with
full security |
|
<10 |
C |
Absolute credit risk exists. Caution needed to be exercised |
Credit not
recommended |
|
-- |
NB |
New Business |
-- |
This report is issued at your request without any
risk and responsibility on the part of MIRA INFORM PRIVATE LIMITED (MIPL)
or its officials.