MIRA
INFORM REPORT
|
Report Date : |
04.08.2014 |
IDENTIFICATION DETAILS
|
Name : |
INDIAN SUCROSE LIMITED |
|
|
|
|
Formerly Known
As: |
OSWAL SUGARS LIMITED |
|
|
|
|
Registered
Office : |
|
|
|
|
|
Country : |
|
|
|
|
|
Financials (as
on) : |
30.09.2013 |
|
|
|
|
Date of
Incorporation : |
12.12.1990 |
|
|
|
|
Com. Reg. No.: |
55 - 010903 |
|
|
|
|
Capital Investment
/ Paid-up Capital : |
Rs. 224.183 Million |
|
|
|
|
CIN No.: [Company Identification
No.] |
L15424PB1990PLC010903 |
|
|
|
|
TAN No.: [Tax Deduction &
Collection Account No.] |
JLD100268C |
|
|
|
|
Legal Form : |
A Public Limited Liability Company. The Company’s Shares are Listed on
the Stock Exchanges. |
|
|
|
|
Line of Business
: |
Manufacturing of white |
|
|
|
|
No. of Employees
: |
204 (Approximately) |
RATING & COMMENTS
|
MIRA’s Rating : |
B (27) |
|
RATING |
STATUS |
PROPOSED CREDIT LINE |
|
|
26-40 |
B |
Capability to overcome financial difficulties seems comparatively
below average. |
Small |
|
Maximum Credit Limit : |
USD 220000 |
|
|
|
|
Status : |
Moderate |
|
|
|
|
Payment Behaviour : |
Slow But Correct |
|
|
|
|
Litigation : |
Clear |
|
|
|
|
Comments : |
Subject is an established company having a moderate track record. Profitability of the company seems to be low from the financial
statement ranging from 1.10.2013 – 31.03.2014 (6 months). However, trade relations are reported as fair. Business is active.
Payment terms are slow but correct. The company can be considered for business dealings with some caution. |
NOTES :
Any query related to this report can be made
on e-mail : infodept@mirainform.com
while quoting report number, name and date.
ECGC Country Risk Classification List – June 1, 2014
|
Country Name |
Previous Rating (31.03.2014) |
Current Rating (01.06.2014) |
|
India |
A1 |
A1 |
|
Risk Category |
ECGC
Classification |
|
Insignificant |
A1 |
|
Low |
A2 |
|
Moderate |
B1 |
|
High |
B2 |
|
Very High |
C1 |
|
Restricted |
C2 |
|
Off-credit |
D |
INDIAN ECONOMIC OVERVIEW
N E W S
As per the latest IMF study, the total weigh of emerging markets in the GDP
of the world on a purchasing power parity basis has seen a sizeable shift. It
highlights how as against 51 % in 2005, the emerging economies now account for
close to 56 % of the global purchasing power GDP as per the latest survey. And
with the emerging economies growing at a faster rate than their developed
counterparts, there are every possibility that the their share goes up further
in the coming years. China may surpass the US over the next few years.
Politics and economics are very intricately connected. They tend to
influence each other in ways that could be very complex and far-reaching. The
prospects of the India’s economy have been seriously compromised due to
political corruption. High inflation, poor standard of living are to a great
extent a result of rampant corruption in the country. China on the other hand,
seems to be facing diametrically opposite challenge. American hedge fund
manager Jim Chanos has been keenly following the political and economic
development in the dragon economy and has figured out something that is quite
worrying. He is of the view that the Chinese economy could be heading toward
trouble on account of new Chinese President Xi Jingping’s very aggressive
anti-corruption drive. Chanos believes tat many things such as apartment sales,
luxury products, etc. were largely bought with dirty money. And it is now
beginning to impact consumption. This may indeed be bad news for an economy
that is struggling to transition from an investment-driven export-oriented
economy to a domestic consumption-driven economy.
A study published by Firstpost has revealed that asset classes like real
estate and equities were the biggest beneficiaries of the liberalization
policies. A firm called Ciane Analytics studied returns from assets
including equities, gold, fixed deposits, G-Secs and real estate since 1991.
Real estate outperformed every other asset classes during the 23-year period
with an annualized return of 20 % ! Equities came in second with annualized
return of 15.5 % ! However, while these returns may seem mouthwatering, the
fact is that the return from equities adjusted for inflation came down to just
7.1 %.
Some brief news are as under
. R-Power to buy Jaypee’s hydro assets
. Investors await justice in NSEL case
. India seeks MFN status from Pakistan ahead of meeting
. Ukrain’s clashes with rebels hinder MH17 crash investigation
. India exploring merger of state-owned hydro PSUs
..Higher costs weigh down profit growth to slowest in 9 quarters
..Wal-Mart to expand wholesale business in India
. GMR group moves to strengthen balance sheet
. Central Bank to sell 4 % stake to Life Insurance Corporation
. Tata Chemicals plans to raise up to Rs 10000 mn.
EXTERNAL AGENCY RATING
|
Rating Agency Name |
CRISIL RATING |
|
Rating |
Long Term Rating – B |
|
Rating Explanation |
Have High Risk Of Default |
|
Date |
April 9, 2014 |
RBI DEFAULTERS’ LIST STATUS
Subject’s name is not enlisted as a defaulter
in the publicly available RBI Defaulters’ list.
EPF (Employee Provident Fund) DEFAULTERS’ LIST STATUS
Subject’s name is not enlisted as a defaulter
in the publicly available EPF (Employee Provident Fund) Defaulters’ list as of
31-03-2014.
INFORMATION PARTED BY
|
Name : |
Mr. Kunal |
|
Designation : |
Managing Director |
|
Contact No.: |
91-9999555000 |
|
Date : |
28.07.2014 |
LOCATIONS
|
Registered Office / Works : |
G T Road, Mukerian, District Hoshiarpur – 144211, Punjab, India |
|
Tel. No.: |
91-1883-2490025 / 249001 |
|
Mobile No.: |
91-9999555000 (Mr. Kunal) |
|
Fax No.: |
91-1883-244532/2490001 |
|
E-Mail : |
|
|
Website : |
|
|
Area : |
Owned |
|
|
|
|
Corporate Office : |
202 / 47, Thapar Arcade, Kalu Sarai, Hauz Khas |
|
|
|
DIRECTORS
As on 30.09.2013
|
Name : |
Mr. Kunal Yadav |
|
Designation : |
Chairman and Managing Director |
|
|
|
|
Name : |
Mr. Dharampal Singh |
|
Designation : |
Director |
|
|
|
|
Name : |
Mr. Jitender Singh |
|
Designation : |
Director |
|
|
|
|
Name : |
Mr. Pawan Dewan |
|
Designation : |
Director |
|
Address : |
|
|
|
|
|
Name : |
Mr. Sheoraj Singh Ahlawat |
|
Designation : |
Director |
|
|
|
|
Name : |
Mr. Prakash Chandra Gupta |
|
Designation : |
Director |
|
|
|
|
Name : |
Mr. Sanjay Singh |
|
Designation : |
Executive Director |
KEY EXECUTIVES
|
Name : |
Mr. Manish Kumar Dixit |
|
Designation : |
Company Secretary |
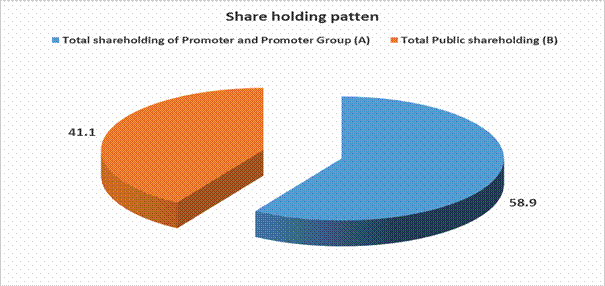
MAJOR SHAREHOLDERS / SHAREHOLDING PATTERN
As on 31.03.2014
|
Category
of Shareholders |
No. of Shares |
Percentage of holding |
|
(A)
Shareholding of Promoter and Promoter Group |
|
|
|
|
|
|
|
|
3084886 |
19.95 |
|
|
6022607 |
38.95 |
|
|
9107493 |
58.90 |
|
|
|
|
|
Total
shareholding of Promoter and Promoter Group (A) |
9107493 |
58.90 |
|
(B)
Public Shareholding |
|
|
|
|
|
|
|
Mutual
Funds / UTI |
9433 |
0.06 |
|
|
500 |
0.00 |
|
|
9933 |
0.06 |
|
|
|
|
|
|
731986 |
4.73 |
|
|
|
|
|
|
3831441 |
24.78 |
|
|
1026745 |
6.64 |
|
|
754209 |
4.88 |
|
|
1 |
0.00 |
|
Non Resident Indians |
754208 |
4.88 |
|
|
6344381 |
41.03 |
|
Total
Public shareholding (B) |
6354314 |
41.10 |
|
Total
(A)+(B) |
15461807 |
100.00 |
|
(C)
Shares held by Custodians and against which Depository Receipts have been
issued |
|
|
|
|
0 |
0.00 |
|
|
0 |
0.00 |
|
|
0 |
0.00 |
|
Total
(A)+(B)+(C) |
15461807 |
100.00 |
BUSINESS DETAILS
|
Line of Business : |
Manufacturing of white Crystal sugar and Cogeneration of power. |
||||||||
|
|
|
||||||||
|
Products : |
|
||||||||
|
|
|
PRODUCTION STATUS
|
Sr .no |
Particular |
Unit |
Quantity |
|
a) |
Licensed Capacity |
TCD |
5000 (5000) |
|
b) |
Installed
Capacity |
TCD |
5000 (5000) |
|
c) |
Production |
|
|
|
|
Sugar |
Qtls |
487572 (2724000) |
|
|
Molasses |
Qtls |
247229 (133658) |
|
|
Bagasse |
Qtls |
1350969 (842367) |
|
|
|
|
|
NOTE:
1 The installed
capacity is certified by management and has not verified by the auditors being
Technical matter
2 Production of Bagasse includes 1088787 (Previous Year 742279 Qtls)
consumed internally as fuel and boller
3 Company has purchased white sugar Nil Qtls From Cosmos Industries
Limited (Previous Year 11657.50)
GENERAL INFORMATION
|
No. of Employees : |
204 (Approximately) |
|||||||||||||||||||||||||||||||||||||||||||||||||||||||||||||||||||||||||||||||||||||
|
|
|
|||||||||||||||||||||||||||||||||||||||||||||||||||||||||||||||||||||||||||||||||||||
|
Bankers : |
Punjab National Bank, Mukerian Branch, Hosiarpur, Punjab, India |
|||||||||||||||||||||||||||||||||||||||||||||||||||||||||||||||||||||||||||||||||||||
|
|
|
|||||||||||||||||||||||||||||||||||||||||||||||||||||||||||||||||||||||||||||||||||||
|
Facilities : |
(Rs.
In Millions)
Long Term
Borrowing Securities
Clauses: 1.
Term loans from Punjab National bank are secured
against hypothecation of all the Plant and machinery of the company. 2.
Term loan taken from Punjab National Bank are further
secured by way of first charge on company’s immovable properties situated at
Mukerian, Distt Hoshiarpur, Punjab 3.
Term Loans are also secured by way of personal
guarantees of three directors of the company. 4.
The Vehicles loan from banks are secured against
vehicles financed by them. 5.
Term loan from Government of India, Sugar
development fund are secured by way of Bank guarantee given by the company. Rate
of Interest From Bank (T/L) 14.25% From SDF 4.00% From Bank (Vehicle loan) 11.75%
Short
Term Borrowing Terms
and Condition of Cash Credit Loan Security
Clause 1.
Cash credit limits is secured by way of pledge of
Sugar stocks and hypothecation of stocks of stores, Packing Material and of
Molasses. 2.
Cash credit limits taken from Punjab National
Bank are further secured by way of first charge on company’s immovable properties
situated at Mukerian, Distt Hoshiarpur Punjab. 3.
Cash credit limit are also secured by way of
personal guarantees of three directors of the company. |
|
|
|
|
Banking
Relations : |
--- |
|
|
|
|
Auditors : |
|
|
Name : |
Rakesh Grover and Company Chartered Accountants |
|
Address : |
1st Floor, Sohan Palace, Opp. Telephone Exchange, The Mall,
Ludhiana – 141001, India |
|
Tel. No: |
91-161-2772233 |
|
Fax No: |
91-161-5077233 |
|
Email: |
|
|
|
|
|
Parties where
control exists: |
Yadu Resorts (India) Limited |
|
|
|
|
Associates : |
Rangar Breweries Limited |
|
|
|
|
Enterprises significantly influenced by Directors : |
·
Cosmos Industries Limited ·
Yadu Sugar Limited ·
Scorpion News Communication Private Limited ·
Scorpion Media Private Limited ·
Top-Image Estate Private Limited ·
Yadu Corporation Private Limited ·
Yadu Resorts (India) Limited |
CAPITAL STRUCTURE
As on 30.09.2013
Authorised Capital :
|
No. of Shares |
Type |
Value |
Amount |
|
|
|
|
|
|
18000000 |
Equity Share |
Rs.10/- each |
Rs.180.000 Millions |
|
700000 |
Preference Share |
Rs.100/- each |
Rs. 70.000 Millions |
|
Total |
|
|
Rs. 250.000
Millions |
Issued, Subscribed & Paid-up Capital :
|
No. of Shares |
Type |
Value |
Amount |
|
|
|
|
|
|
15461807 |
Equity Share |
Rs.10/- each |
Rs 154.618
Millions |
|
|
Less call unpaid |
|
Rs. (0.435)
Millions |
|
700000 |
Preference Share |
Rs.100/- each |
Rs. 70.000
Millions |
|
Total |
|
|
Rs 224.183 Millions |
TERMS
AND CONDITION OF EQUITY SHARES
The company has one class of equity shares
having a per value of Rs.10/- each
Each Shareholder is eligible for one vote
per shares held.
The Dividend, if any, proposed by the board
of Director id subject to the approval of shareholders in the Annual General
Meeting except in case of interim dividend.
In the event of liquidation, the Equity
shareholders are eligible to receive the remaining assets of the company after
distribution of all preferential amounts, in proportion of their shareholding.
TERMS
OF PREFERENCE SHARE
Rate of dividend on these Preference Shares
is 6% p.a.
The Preference shares are Cumulative with
reference to the dividend.
The Preference Shares will be convertible
into equity shares of Rs. 10/- each at a premium of Rs. 4/- at any time the
expiry of 112 Months but not later than 60 Months from the date of issue,
subject to approval of shareholdrs meeting of the company.
The Preference Shareholders will have no
voting right except as provided in the companies Act, 1956.
There are Nil numbers of shares (Previous
Year Nil Respect of each class in the company held by its holding company or
its ultimate holding company including shares held by or by subsidiary or
associates of the holding company or the ultimate holding company in aggregate.
FINANCIAL DATA
[all figures are
in Rupees Millions]
ABRIDGED BALANCE
SHEET
|
SOURCES OF FUNDS |
|
30.09.2013 |
30.09.2012 |
|
I.
EQUITY
AND LIABILITIES |
|
|
|
|
(1)Shareholders' Funds |
|
|
|
|
(a) Share Capital |
|
224.183 |
224.183 |
|
(b) Reserves & Surplus |
|
328.866 |
260.636 |
|
(c) Money
received against share warrants |
|
0.000 |
0.000 |
|
|
|
|
|
|
(2) Share Application money pending allotment |
|
0.000 |
0.000 |
|
Total
Shareholders’ Funds (1) + (2) |
|
553.049 |
484.819 |
|
|
|
|
|
|
(3)
Non-Current Liabilities |
|
|
|
|
(a) long-term borrowings |
|
164.388 |
340.075 |
|
(b) Deferred tax liabilities (Net) |
|
67.757 |
82.103 |
|
(c) Other long term liabilities |
|
0.000 |
0.000 |
|
(d) long-term provisions |
|
17.512 |
17.117 |
|
Total Non-current Liabilities (3) |
|
249.657 |
439.295 |
|
|
|
|
|
|
(4) Current Liabilities |
|
|
|
|
(a) Short term borrowings |
|
563.500 |
748.515 |
|
(b) Trade payables |
|
23.161 |
3.242 |
|
(c) Other current
liabilities |
|
788.390 |
975.649 |
|
(d) Short-term provisions |
|
75.734 |
32.860 |
|
Total Current Liabilities (4) |
|
1450.785 |
1760.266 |
|
|
|
|
|
|
TOTAL |
|
2253.491 |
2684.380 |
|
|
|
|
|
|
II.
ASSETS |
|
|
|
|
(1) Non-current assets |
|
|
|
|
(a) Fixed Assets |
|
0.000 |
0.000 |
|
(i) Tangible assets |
|
676.879 |
674.447 |
|
(ii) Intangible Assets |
|
0.002 |
0.008 |
|
(iii) Capital
work-in-progress |
|
146.258 |
143.799 |
|
(iv)
Intangible assets under development |
|
0.000 |
0.000 |
|
(b) Non-current Investments |
|
18.973 |
18.973 |
|
(c) Deferred tax assets (net) |
|
0.000 |
0.000 |
|
(d) Long-term Loan and Advances |
|
26.663 |
43.338 |
|
(e) Other Non-current assets |
|
0.000 |
0.000 |
|
Total Non-Current Assets |
|
868.775 |
880.565 |
|
|
|
|
|
|
(2) Current assets |
|
|
|
|
(a) Current investments |
|
150.000 |
270.000 |
|
(b) Inventories |
|
595.888 |
418.406 |
|
(c) Trade receivables |
|
54.171 |
239.761 |
|
(d) Cash and cash
equivalents |
|
80.494 |
342.746 |
|
(e) Short-term loans and
advances |
|
504.163 |
532.902 |
|
(f) Other current assets |
|
0.000 |
0.000 |
|
Total Current Assets |
|
1384.716 |
1803.815 |
|
|
|
|
|
|
TOTAL |
|
2253.491 |
2684.380 |
|
SOURCES OF FUNDS |
|
|
31.03.2011 |
|
|
SHAREHOLDERS FUNDS |
|
|
|
|
|
1] Share Capital |
|
|
224.183 |
|
|
2] Share Application Money |
|
|
0.000 |
|
|
3] Reserves & Surplus |
|
|
260.254 |
|
|
4] (Accumulated Losses) |
|
|
0.000 |
|
|
NETWORTH |
|
|
484.437 |
|
|
LOAN FUNDS |
|
|
|
|
|
1] Secured Loans |
|
|
1535.293 |
|
|
2] Unsecured Loans |
|
|
100.109 |
|
|
TOTAL BORROWING |
|
|
1635.402 |
|
|
DEFERRED TAX LIABILITIES |
|
|
86.603 |
|
|
|
|
|
|
|
|
TOTAL |
|
|
2206.442 |
|
|
|
|
|
|
|
|
APPLICATION OF FUNDS |
|
|
|
|
|
|
|
|
|
|
|
FIXED ASSETS [Net Block] |
|
|
729.077 |
|
|
Capital work-in-progress |
|
|
137.396 |
|
|
|
|
|
|
|
|
INVESTMENT |
|
|
74.222 |
|
|
DEFERREX TAX ASSETS |
|
|
0.000 |
|
|
|
|
|
|
|
|
CURRENT ASSETS, LOANS & ADVANCES |
|
|
|
|
|
|
Inventories |
|
|
1080.717
|
|
|
Sundry Debtors |
|
|
84.357
|
|
|
Cash & Bank Balances |
|
|
20.516
|
|
|
Other Current Assets |
|
|
0.000
|
|
|
Loans & Advances |
|
|
802.570
|
|
Total
Current Assets |
|
|
1988.160
|
|
|
Less : CURRENT
LIABILITIES & PROVISIONS |
|
|
|
|
|
|
Sundry Creditor |
|
|
14.279
|
|
|
Other Current Liabilities |
|
|
693.080
|
|
|
Provisions |
|
|
15.054
|
|
Total
Current Liabilities |
|
|
722.413
|
|
|
Net Current Assets |
|
|
1265.747
|
|
|
|
|
|
|
|
|
MISCELLANEOUS EXPENSES |
|
|
0.000 |
|
|
|
|
|
|
|
|
TOTAL |
|
|
2206.442 |
|
PROFIT & LOSS
ACCOUNT
|
|
PARTICULARS |
30.09.2013 |
30.09.2012 |
31.03.2011 |
|
|
SALES |
|
|
|
|
|
Revenue from Operation |
2011.611 |
2692.157 |
1089.554 |
|
|
Other Income |
2.186 |
38.717 |
97.660 |
|
|
Other Operating Income |
0.000 |
0.000 |
0.000 |
|
|
TOTAL
(A) |
2013.797 |
2730.874 |
1187.214 |
|
|
|
|
|
|
|
Less |
EXPENSES |
|
|
|
|
|
Cost of Materials Consumed |
1508.664 |
1372.203 |
1281.172 |
|
|
Purchases of Stock-in-Trade |
0.000 |
3.693 |
(413.443) |
|
|
Changes in inventories of finished
goods, work-in-progress and Stock-in-Trade |
(148.238) |
647.309 |
0.00 |
|
|
Employees benefits expense |
63.080 |
84.338 |
50.711 |
|
|
Other expenses |
228.213 |
210.924 |
13.842 |
|
|
Prior Period Items |
0.316 |
0.125 |
0.020 |
|
|
Cost of goods Slod |
0.000 |
0.000 |
36.763 |
|
|
TOTAL
(B) |
1652.035 |
2318.592 |
969.065 |
|
|
|
|
|
|
|
Less |
PROFIT/
(LOSS) BEFORE INTEREST, TAX,
DEPRECIATION AND AMORTISATION (C) |
361.762 |
412.282 |
218.149 |
|
|
|
|
|
|
|
Less |
FINANCIAL
EXPENSES (D) |
206.422 |
303.710 |
161.481 |
|
|
|
|
|
|
|
|
PROFIT
/ (LOSS) BEFORE TAX, DEPRECIATION AND AMORTISATION (C-D) (E) |
155.340 |
108.572 |
56.668 |
|
|
|
|
|
|
|
Less/
Add |
DEPRECIATION/
AMORTISATION (F) |
58.285 |
82.090 |
52.474 |
|
|
|
|
|
|
|
|
PROFIT/
(LOSS) BEFORE TAX (E-F) (G) |
97.055 |
26.482 |
4.194 |
|
|
|
|
|
|
|
Less |
TAX
(I) |
28.825 |
26.100 |
(2.085) |
|
|
|
|
|
|
|
|
PROFIT/
(LOSS) AFTER TAX (G-I)
(J) |
68.230 |
0.382 |
6.2790 |
|
|
|
|
|
|
|
Add |
PREVIOUS
YEARS’ BALANCE BROUGHT FORWARD |
186.039 |
0.000 |
0.000 |
|
|
|
|
|
|
|
|
BALANCE CARRIED
TO THE B/S |
192.318 |
0.000 |
0.000 |
|
|
|
|
|
|
|
|
Earnings
/ (Loss) Per Share (Rs.) |
7.48 |
0.04 |
0.41 |
Expected Sales (September 2013 – September 2014 is Rs. 2000.000
Million)
KEY RATIOS
|
PARTICULARS |
|
30.09.2013 |
30.09.2012 |
31.03.2011 |
|
PAT / Total Income |
(%) |
3.39 |
0.01 |
0.52 |
|
|
|
|
|
|
|
Net Profit Margin (PBT/Sales) |
(%) |
4.82 |
0.98 |
0.38 |
|
|
|
|
|
|
|
Return on Total Assets (PBT/Total Assets} |
(%) |
4.65 |
1.05 |
0.33 |
|
|
|
|
|
|
|
Return on Investment (ROI) (PBT/Networth) |
|
0.18 |
0.05 |
0.86 |
|
|
|
|
|
|
|
Debt Equity Ratio (Total Debt /Networth) |
|
1.32 |
2.25 |
3.37 |
|
|
|
|
|
|
|
Current Ratio (Current Asset/Current Liability) |
|
0.95 |
1.02 |
1.57 |
FINANCIAL ANALYSIS
[all figures are
in Rupees Millions]
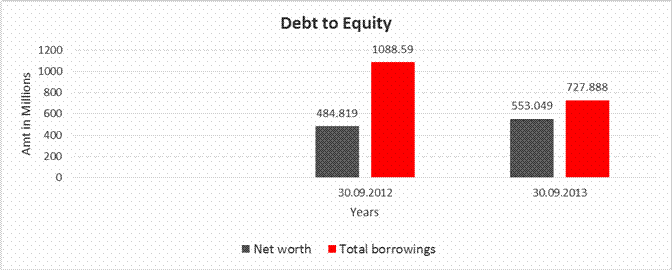
DEBT EQUITY RATIO
|
Particular |
|
30.09.2012 |
30.09.2013 |
|
|
|
(Rs.
In Millions) |
(Rs.
In Millions) |
|
Share Capital |
|
224.183 |
224.183 |
|
Reserves & Surplus |
|
260.636 |
328.866 |
|
Net
worth |
|
484.819 |
553.049 |
|
|
|
|
|
|
long-term borrowings |
|
340.075 |
164.388 |
|
Short term borrowings |
|
748.515 |
563.500 |
|
Total
borrowings |
|
1088.590 |
727.888 |
|
Debt/Equity
ratio |
|
2.245 |
1.316 |
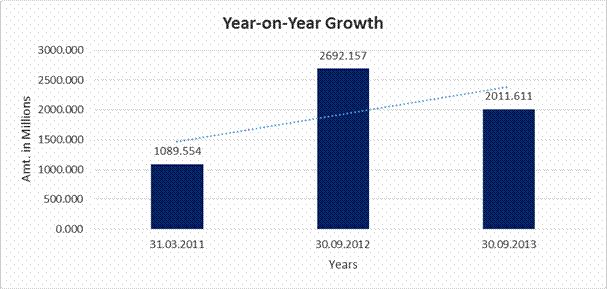
YEAR-ON-YEAR GROWTH
|
Year
on Year Growth |
31.03.2011 |
30.09.2012 |
30.09.2013 |
|
|
(Rs.
In Millions) |
(Rs.
In Millions) |
(Rs.
In Millions) |
|
Sales |
1089.554 |
2692.157 |
2011.611 |
|
|
|
147.088 |
(25.279) |
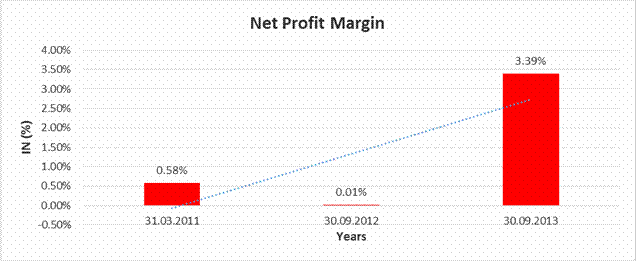
NET PROFIT MARGIN
|
Net
Profit Margin |
31.03.2011 |
30.09.2012 |
30.09.2013 |
|
|
(Rs.
In Millions) |
(Rs.
In Millions) |
(Rs.
In Millions) |
|
Sales |
1089.554 |
2692.157 |
2011.611 |
|
Profit |
6.279 |
0.382 |
68.229 |
|
|
0.58% |
0.01% |
3.39% |
LOCAL AGENCY FURTHER INFORMATION
|
Sr. No. |
Check List by Info
Agents |
Available in Report (Yes / No) |
|
1] |
Year of Establishment |
Yes |
|
2] |
Locality of the firm |
Yes |
|
3] |
Constitutions of the firm |
Yes |
|
4] |
Premises details |
No |
|
5] |
Type of Business |
Yes |
|
6] |
Line of Business |
Yes |
|
7] |
Promoter's background |
No |
|
8] |
No. of employees |
Yes |
|
9] |
Name of person contacted |
Yes |
|
10] |
Designation of contact person |
Yes |
|
11] |
Turnover of firm for last three years |
Yes |
|
12] |
Profitability for last three years |
Yes |
|
13] |
Reasons for variation <> 20% |
---------------------- |
|
14] |
Estimation for coming financial year |
Yes |
|
15] |
Capital in the business |
Yes |
|
16] |
Details of sister concerns |
Yes |
|
17] |
Major suppliers |
No |
|
18] |
Major customers |
No |
|
19] |
Payments terms |
No |
|
20] |
Export / Import details (if applicable) |
No |
|
21] |
Market information |
---------------------- |
|
22] |
Litigations that the firm / promoter involved in |
---------------------- |
|
23] |
Banking Details |
Yes |
|
24] |
Banking facility details |
Yes |
|
25] |
Conduct of the banking account |
---------------------- |
|
26] |
Buyer visit details |
---------------------- |
|
27] |
Financials, if provided |
Yes |
|
28] |
Incorporation details, if applicable |
Yes |
|
29] |
Last accounts filed at ROC |
Yes |
|
30] |
Major Shareholders, if available |
Yes |
|
31] |
Date of Birth of Proprietor/Partner/Director, if available |
No |
|
32] |
PAN of Proprietor/Partner/Director, if available |
No |
|
33] |
Voter ID No of Proprietor/Partner/Director, if available |
No |
|
34] |
External Agency Rating, if available |
Yes |
PERFORMANCE REVIEW :
The company maintains performance in the term of net profit in compare to last year. As compared to last year turnover of Rs. 2692.157 Millions the company achieved turnover of Rs. 2011.611 Million during the current year. Because of increase in cost of raw material, and financial charges the net operating profit before tax (PBT) has decreased to Rs68.229 Millions during the year as compared to Rs. 0.382 Millions during last year.
During the year, the Company has crushed 6118109.31 QTLS of Sugarcane and produced 600,063 QTLS of Sugar in 131 day crushing days, as compared to previous year crushing of 5,980,704QTLS of sugarcane and production of 594,091 BAGS of Sugar in 126 crushing days
The capacity utilization of the plant during the year was 93.94% and the average recovery was 9.79% as compared to capacity utilization of 94.94 % and average recovery of 9.93 % in the previous year.
MANAGEMENT ANALYSIS AND PERCEPTION
Industry Structure
& Development
Sugar:
The
Indian sugar sector is highly cyclical in nature and is sensitive to Government
policy and weather conditions. A typical sugar cycle lasts for 3–5 years –
lower sugarcane and sugar production results in an increase in sugar prices and
higher and prompt payments to farmers, which, in turn, leads to an increase in
area under cane cultivation. An increase in cane acreage then leads to higher
sugar production, decline in sugar prices, lower profitability for mills and
consequently delayed payments to farmers, which, in turn, results in area under
cane cultivation coming down. As sugar is consumed by every household and a
large number of farmers draw their livelihood from sugarcane cultivation, the
Central Government has always wanted to control prices in the open market,
while the States want to ensure higher and higher prices for sugarcane farmers.
The
year 2012–13 started on a positive note with the Government allowing export of
surplus sugar under OGL.
As
the year progressed, because of excess production of sugar in most sugar
producing countries, International prices of white sugar dropped from around
US$ 600 per MT to US$ 520 per MT, thus limiting the prospects for further
exports.
By
the third quarter and onwards, sugar prices came under pressure due to higher
release by the Government as well as import of raw sugar by coastal sugar
refineries for domestic consumption. The start of crushing by mills and the
rising trend of production, resulting in an even higher level of inventories,
put further pressure on prices. Presently, the prices are below 3200/ qtl.,
which is much lower than the cost of production.
During
the season 2012–13, domestic production is estimated at 24.5 Million MT as
against 26 Million MT last year. After considering import of raw sugar by
coastal refineries, and consumption at 22.5 Million MT, the season has added
considerably to the sugar surplus. To safeguard the Industry, representations
are being made to the Government to increase import duty on raw / white sugar
from present level of 10% to the bound rate of 60%.
Recently,
the Government of India has announced partial de–control of the sugar industry
based on the recommendation of the committee headed by Dr. C. Rangarajan,
Chairman, Economic Advisory Council. One of the decisions bringing relief to
the industry is the dismantling of the release mechanism. Under this mechanism,
the Government used to decide how much sugar mills can sell in the open market
and in what time frame (quarterly, in 2012/13). The scrapping of the release
mechanism is, therefore, a huge plus for the industry. One of the other
positive steps for both farmers and the industry is the removal of 10 per cent
'levy sugar', which deals with supply of sugar by the sugar industry to the
Public Distribution System (PDS). Levy sugar for the PDS will now be procured
by State Governments from the open market at prevailing market prices. So far,
the industry has been supplying levy sugar to the Government for PDS at 50–60
per cent of its cost of production. This decision will help the industry save
about 3,000 crore annually, which would also help in making cane payments on
time and reducing cane arrears. Another welcome move is that the Government has
not increased any excise duty to fund the Government's additional subsidy burden
arising out of its taking over the levy sugar burden from the industry.
The
next important step for the Government, both the Central and States, would be
to address sugarcane controls and rationalize the cane pricing in line with the
globally accepted and successful cane price–sugar price linkage formula, which
is also very strongly recommended by the Rangarajan Committee. This step would
help to reduce the cyclicality of sugar production and better enable the
industry to pay for the sugarcane supplied by farmers and consumers too would
benefit with more stable sugar prices.
Reforms
in the sugar sector will result in a win–win situation for the farmers,
consumer, Government and industry. In the long run, all stakeholders will
benefit with a less volatile and a more stable industry.
CO–GENERATION OF
POWER:
During
the last 15 years bagasse based co–generation power projects were commissioned
in various States in India. Electricity production through co–generation in
sugar mills in India is an important source of low–cost, non–conventional
power. Presently, India has around 206 co–generation units with a cumulative
installed capacity of 3123 MW. Further, India has a potential of generating
5000 MW of power through bagasse.
The
Central Government has announced various incentives schemes for sugar Companies
to set up cogeneration power projects and for acceleration of power
co–generation programme. The Company has sold 1, 33, 09,878 units of power
during the year.
OUTLOOK:
The
Indian sugar production in the past couple of years has gone through a volatile
phase, primarily on account of bad weather conditions in 2008–09 and 2009–10.
Sugar production in India fell from 28.63 million tonnes in 2007–08 to a low of
15.95 million tonnes in 2008– 09. Though, it has recorded gains in production
and was at 28.3 million tonnes in 2011–12, India's sugar output is set to
decline by 10–15 per cent in the 2012–13 crushing season due to lower cane
availability from drought–hit Maharashtra Districts. As the largest
sugar–producing State in India, Maharashtra contributes a third of India's
overall sugar output. This is set to translate into India's total sugar output
between 23–24 million tonnes during the 2013–14 crushing season, lower from 24.6
million tonnes estimated by the apex trade body, Indian Sugar Mills Association
(ISMA).
With
2013 closing stocks likely to be maintained at prior year levels, sugar would
also be available for exports, subject to global attractiveness to the
domestically produced sugar. It is believed that a comfortable global sugar
demand supply balance will result in weak international sugar prices.
UNSECURED
LOAN:
(Rs. In Millions)
|
Particulars |
As
on 30.09.2013 |
As
on 30.09.2012 |
|
LONG TERM BORROWING |
|
|
|
From related Party |
35.100 |
39.600 |
|
From Other |
35.158 |
47.174 |
|
|
|
|
|
Total |
70.258 |
86.874 |
Unsecured Loan Terms and Condition
1. There is no stipulation regarding repayment of term loan
2. Rate of Interest
On 15.000 8%
On 55.257 0%
INDEX OF CHARGES
|
S.No. |
Charge ID |
Date of Charge
Creation/Modification |
Charge amount
secured |
Charge Holder |
Address |
Service Request
Number (SRN) |
|
1 |
10488648 |
03/04/2014 |
100,000,000.00 |
PUNJAB NATIONAL BANK |
PUNJAB NATIONAL BANK, MUKERIAN, MUKERIAN, Punjab |
C02342913 |
|
2 |
10484940 |
05/03/2014 |
198,800,000.00 |
PUNJAB NATIONAL BANK |
MAIN BRANCH, MUKERIAN, MUKERIAN, Punjab - 144211, |
C00524801 |
|
3 |
10484935 |
12/02/2014 |
500,000.00 |
PUNJAB NATIONAL BANK |
MAIN BRANCH, MUKERIAN, MUKERIAN, Punjab - 144211, |
C00523928 |
|
4 |
10438260 |
27/06/2013 |
740,000.00 |
PUNJAB NATIONAL BANK |
MAIN BRANCH MUKERIAN, MUKERIAN, Punjab - 144211, I |
B79980728 |
|
5 |
10438261 |
27/06/2013 |
990,000.00 |
PUNJAB NATIONAL BANK |
MAIN BRANCH MUKERIAN, MUKERIAN, Punjab - 144211, I |
B79981106 |
|
6 |
10439310 |
17/06/2013 |
2,351,724.00 |
PUNJAB NATIONAL BANK |
MAIN BRANCH MUKERIAN, MUKERIAN, Punjab - 144211, I |
B79981650 |
|
7 |
10422155 |
28/02/2014 * |
1,500,000,000.00 |
PUNJAB NATIONAL BANK |
MAIN BRANCH, MUKERIAN, MUKERIAN, Punjab - 144211, |
C00530139 |
|
8 |
10417594 |
13/03/2013 |
100,000,000.00 |
PUNJAB NATIONAL BANK |
MAIN BRANCH, MUKERIAN, MUKERIAN, Punjab - 144211, |
B72548688 |
|
9 |
10411947 |
23/02/2013 |
50,000,000.00 |
PUNJAB NATIONAL BANK |
MAIN BRANCH, MUKERIAN, MUKERIAN, Punjab - 144211, |
B70805338 |
|
10 |
10395740 |
12/12/2012 |
1,300,000.00 |
PUNJAB NATIONAL BANK |
MUKERIAN, MUKERIAN, Punjab - 144211, INDIA |
B65420721 |
* Date of charge modification
AUDITED STANDLONE FINANCIAL RESULTS FOR THE YEAR ENDED
31ST MARCH 2014
|
Sr. No |
Particulars |
Standalone |
|||
|
Quarter Ended |
Year Ended |
||||
|
31.3.2014 |
31.12.2013 |
31.03.2014 |
|||
|
audited |
Unaudited |
audited |
|||
|
1 |
Income From
Operations |
|
|
|
|
|
|
a. Net Sales/ Income from Operations (Net of Excise Duty) |
707.194 |
348.929 |
1056.123 |
|
|
|
b. Other Operating Income |
49.510 |
8.419 |
57.929 |
|
|
|
Total Income from
Operations (Net) |
756.704 |
357.348 |
1114.052 |
|
|
2 |
Expenditure |
|
|
|
|
|
|
a. Cost of material Consumed |
1165.050 |
497.526 |
1662.576 |
|
|
|
b. Purchase of Stock-in trade |
0.00 |
|
|
|
|
|
c. Changes in inventory of finished Goods, work- in-progress and Stock-in-trade |
(568.109) |
(289.699) |
(857.808) |
|
|
|
d. Employees Benefit Expenses |
20.796 |
21.400 |
42.196 |
|
|
|
e. Depreciation and Amortisation Expenses |
15.357 |
14.723 |
30.080 |
|
|
|
f. Other expenses |
75.513 |
69.386 |
144.899 |
|
|
|
Total Expenses |
708.607 |
313.336 |
1021.943 |
|
|
3 |
Profit from
Operations before Other Income, Interest and Exceptional Items |
48.097 |
44.012 |
92.109 |
|
|
4 |
Other Income |
1.136 |
1.707 |
2.843 |
|
|
5 |
Profit from ordinary
activities before finance cost & exceptional items |
49.233 |
45.719 |
94.952 |
|
|
6 |
Finance Costs |
49.339 |
38.269 |
87.608 |
|
|
7 |
Profit from
ordinary activities after finance costs & exceptional items |
(0.106) |
7.450 |
7.344 |
|
|
8 |
Exceptional items |
2.268 |
0.000 |
2.268 |
|
|
9 |
Profit from
ordinary activities before tax |
(2.374) |
7.450 |
5.076 |
|
|
10 |
Tax Expense |
2.208 |
(0.366) |
1.842 |
|
|
|
- Income Tax |
|
|
|
|
|
|
- Deferred Tax |
|
|
|
|
|
11 |
Net Profit from ordinary
activity after tax |
(4.582) |
7.816 |
3.234 |
|
|
12 |
Extraordinary Items |
|
|
|
|
|
13 |
Net Profit After
Tax |
(4.582) |
7.816 |
3.234 |
|
|
14 |
Paid-up 6% Preference share capital (face value of Rs.100 per share) |
70.000 |
70.000 |
70.000 |
|
|
|
Paid-up equity share capital (face value of Rs.10 per share) |
154.183 |
154.183 |
154.183 |
|
|
15 |
Reserves excluding Revaluation Reserve as per balance sheet of previous accounting Year |
|
|
|
|
|
16 |
Earning Per Share (of Rs.10 each) (not annualized) |
|
|
|
|
|
|
Basic EPS |
(0.027) |
0.044 |
(0.006) |
|
|
|
Diluted EPS |
(0.022) |
(0.038) |
0.016 |
|
|
A |
PARTICULARS OF
SHAREHOLDING |
|
|
|
|
|
17 |
Public Shareholding |
|
|
|
|
|
|
- No. of shares |
6354314 |
6354314 |
6354314 |
|
|
|
- Percentage of shareholding |
41.1% |
41.1% |
41.1% |
|
|
18 |
Promoter &
Promoter Group Shareholding |
|
|
|
|
|
|
a)
Pledged/Encumbered |
|
|
|
|
|
|
- No. of shares |
985000 |
985000 |
985000 |
|
|
|
- Percentage of shareholding (as a % of the total shareholding of promoter and promoter group) |
10.82% |
10.82% |
10.82% |
|
|
|
- Percentage of shareholding (as a % of the total share capital of the company) |
6.37% |
6.37% |
6.37% |
|
|
|
b) Non-encumbered |
|
|
|
|
|
|
- No. of shares |
8122493 |
8122493 |
8122493 |
|
|
|
- Percentage of shareholding (as a % of the total shareholding of promoter and promoter group) |
89.18% |
89.18% |
89.18% |
|
|
|
- Percentage of shareholding (as a % of the total share capital of the company) |
52.53% |
52.53% |
52.53% |
|
|
STATEMENT OF
ASSETS AND LIBILITIES |
||
|
|
PARTICULARS |
As At |
|
|
|
31.03.2014 |
|
A |
EQUITY AND LIBILITIES |
(AUDITED) |
|
|
SHAREHOLDERS FUND |
|
|
|
(a) SHARE CAPITAL |
224.183 |
|
|
(b) RESERVES AND SURPLUS |
332.120 |
|
|
(c) MONEY REC. AGST. SHARE WARRANTS |
|
|
|
SUB TOTAL SHAREHOLDERS FUNDS |
556.303 |
|
|
SHARE APPLICATION MONEY PENDING ALLOTMENT |
|
|
|
|
|
|
2 |
NON-CURRENT LIBILITIES |
|
|
|
(a) LONG TERM BOROWING |
307.996 |
|
|
(b) DEFFERED TAX LIBILITIES (NET) |
72.154 |
|
|
(c )OTHER LONG TERM LIBILITIES |
- |
|
|
(d) LONG TERM BORROWING |
18.659 |
|
|
SUB TOTAL NON CURRENT LIBILITIES |
398.809 |
|
|
|
|
|
3 |
CURRENT LIBILITIES |
|
|
|
(a) SHORT TERM BORROWING |
1517.998 |
|
|
(b) TRADE PAYABLES |
353.487 |
|
|
(c) OTHER CURRENT LIBILITIES |
473.090 |
|
|
(d) SHORT TERM BORROWING |
83.848 |
|
|
SUB TOTAL CURRENT LIBILITIES |
2428.423 |
|
|
|
|
|
|
TOTAL – EQUITY AND LIBILITIES |
3383.535 |
|
|
|
|
|
B |
ASSETS |
|
|
|
|
|
|
1 |
NON – CURRENT ASSETS |
|
|
|
(a) FIXED ASSETS |
829.258 |
|
|
(b) NON –CURRENT INVESTMENT |
18.973 |
|
|
(c) DEFFERED TAX ASSETS (NET) |
- |
|
|
(d) LONG TERM LOANS AND ADVANCES |
48.548 |
|
|
(e) OTHER NON CURRENT ASSETS |
- |
|
|
SUB TOTAL NON CURRENT ASSETS |
896.779 |
|
|
|
|
|
|
CURRENT ASSETS |
|
|
|
(a) CURRENT INVESTMENT |
150.000 |
|
|
(b) INVENTORIES |
1475.732 |
|
|
(c) TRADE RECEIVABLES |
175.724 |
|
|
(d) CASH AND CASH EQUIVALENTS |
204.599 |
|
|
(e) SHORT TERM LOANS AND ADVANCES |
480.701 |
|
|
(f) OTHER CURRENT ASSETS |
- |
|
|
SUB TOTAL CURRENT ASSETS |
2486.756 |
|
|
|
|
|
|
TOTAL ASSETS |
3383.535 |
Notes:
1. The above results were reviewed by Audit Committee, considered and approved
by the board of directors of the company at its meeting held on 30.05.2014
2. The activities of the company relate to only one segment i.e Sugar
Manufacturing.
3. The figures of the last quarter for current and previous financial years
are the balancing figures between the audited figures in respect of the full
financial Years ended 30th September and published unaudited (with
limit reviewed) year to date figures upto the third quarter ended 30th
June of the respective financial years.
4. Previous Period Figures have been regrouped/reclassified where ever
necessary as per revised Schedule VI of the companies Act 1956.
FIXED ASSETS
· Freehold Land
· Trade Mark
· Building
· Plant and Machinery
· Furniture and Fixtures
· Office Equipment
·
Vehicles and Tractors
CMT REPORT (Corruption, Money Laundering & Terrorism]
The Public Notice information has been collected from various sources
including but not limited to: The Courts,
1] INFORMATION ON
DESIGNATED PARTY
No exist designating subject or any of its beneficial owners,
controlling shareholders or senior officers as terrorist or terrorist
organization or whom notice had been received that all financial transactions
involving their assets have been blocked or convicted, found guilty or against
whom a judgement or order had been entered in a proceedings for violating
money-laundering, anti-corruption or bribery or international economic or
anti-terrorism sanction laws or whose assets were seized, blocked, frozen or
ordered forfeited for violation of money laundering or international
anti-terrorism laws.
2] Court Declaration :
No exist to suggest that subject is or was
the subject of any formal or informal allegations, prosecutions or other
official proceeding for making any prohibited payments or other improper
payments to government officials for engaging in prohibited transactions or
with designated parties.
3] Asset Declaration :
No records exist to suggest that the property or assets of the subject are
derived from criminal conduct or a prohibited transaction.
4] Record on Financial
Crime :
Charges or conviction
registered against subject: None
5] Records on Violation of
Anti-Corruption Laws :
Charges or
investigation registered against subject: None
6] Records on Int’l
Anti-Money Laundering Laws/Standards :
Charges or
investigation registered against subject: None
7] Criminal Records
No
available information exist that suggest that subject or any of its principals
have been formally charged or convicted by a competent governmental authority
for any financial crime or under any formal investigation by a competent
government authority for any violation of anti-corruption laws or international
anti-money laundering laws or standard.
8] Affiliation with
Government :
No record
exists to suggest that any director or indirect owners, controlling
shareholders, director, officer or employee of the company is a government
official or a family member or close business associate of a Government
official.
9] Compensation Package :
Our market
survey revealed that the amount of compensation sought by the subject is fair
and reasonable and comparable to compensation paid to others for similar
services.
10] Press Report :
No press reports / filings exists on
the subject.
CORPORATE GOVERNANCE
MIRA INFORM as part of its Due Diligence do provide comments on
Corporate Governance to identify management and governance. These factors often
have been predictive and in some cases have created vulnerabilities to credit
deterioration.
Our Governance Assessment focuses principally on the interactions
between a company’s management, its Board of Directors, Shareholders and other
financial stakeholders.
CONTRAVENTION
Subject is not known to have contravened any existing local laws,
regulations or policies that prohibit, restrict or otherwise affect the terms
and conditions that could be included in the agreement with the subject.
FOREIGN EXCHANGE RATES
|
Currency |
Unit
|
Indian Rupees |
|
US Dollar |
1 |
Rs.60.14 |
|
|
1 |
Rs.101.92 |
|
Euro |
1 |
Rs.80.63 |
INFORMATION DETAILS
|
Information
Gathered by : |
SVA |
|
|
|
|
Analysis Done by
: |
RAS |
|
|
|
|
Report Prepared
by : |
ARI |
SCORE & RATING EXPLANATIONS
|
SCORE FACTORS |
RANGE |
POINTS |
|
HISTORY |
1~10 |
4 |
|
PAID-UP CAPITAL |
1~10 |
3 |
|
OPERATING SCALE |
1~10 |
3 |
|
FINANCIAL CONDITION |
|
|
|
--BUSINESS SCALE |
1~10 |
3 |
|
--PROFITABILIRY |
1~10 |
2 |
|
--LIQUIDITY |
1~10 |
3 |
|
--LEVERAGE |
1~10 |
3 |
|
--RESERVES |
1~10 |
3 |
|
--CREDIT LINES |
1~10 |
3 |
|
--MARGINS |
-5~5 |
-- |
|
DEMERIT POINTS |
|
|
|
--BANK CHARGES |
YES/NO |
YES |
|
--LITIGATION |
YES/NO |
NO |
|
--OTHER ADVERSE INFORMATION |
YES/NO |
NO |
|
MERIT POINTS |
|
|
|
--SOLE DISTRIBUTORSHIP |
YES/NO |
NO |
|
--EXPORT ACTIVITIES |
YES/NO |
YES |
|
--AFFILIATION |
YES/NO |
YES |
|
--LISTED |
YES/NO |
YES |
|
--OTHER MERIT FACTORS |
YES/NO |
YES |
|
DEFAULTER |
|
|
|
--RBI |
YES/NO |
NO |
|
--EPF |
YES/NO |
NO |
|
TOTAL |
|
27 |
This score serves as a reference to assess SC’s credit risk
and to set the amount of credit to be extended. It is calculated from a
composite of weighted scores obtained from each of the major sections of this
report. The assessed factors and their relative weights (as indicated through
%) are as follows:
Financial
condition (40%) Ownership
background (20%) Payment
record (10%)
Credit history (10%) Market trend (10%) Operational size
(10%)
RATING EXPLANATIONS
|
RATING |
STATUS |
PROPOSED CREDIT LINE |
|
|
>86 |
Aaa |
Possesses an extremely sound financial base with the strongest capability
for timely payment of interest and principal sums |
Unlimited |
|
71-85 |
Aa |
Possesses adequate working capital. No caution needed for credit
transaction. It has above average (strong) capability for payment of interest
and principal sums |
Large |
|
56-70 |
A |
Financial & operational base are regarded healthy. General
unfavourable factors will not cause fatal effect. Satisfactory capability for
payment of interest and principal sums |
Fairly Large |
|
41-55 |
Ba |
Overall operation is considered normal. Capable to meet normal
commitments. |
Satisfactory |
|
26-40 |
B |
Capability to overcome financial difficulties seems comparatively
below average. |
Small |
|
11-25 |
Ca |
Adverse factors are apparent. Repayment of interest and principal sums
in default or expected to be in default upon maturity |
Limited with
full security |
|
<10 |
C |
Absolute credit risk exists. Caution needed to be exercised |
Credit not
recommended |
|
-- |
NB |
New Business |
-- |
This report is issued at your request without any
risk and responsibility on the part of MIRA INFORM PRIVATE LIMITED (MIPL)
or its officials.