MIRA
INFORM REPORT
|
Report Date : |
04.08.2014 |
IDENTIFICATION DETAILS
|
Name : |
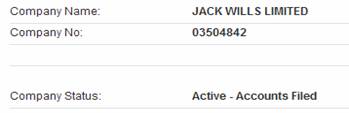
JACK WILLS LIMITED |
|
|
|
|
Formerly Known As : |
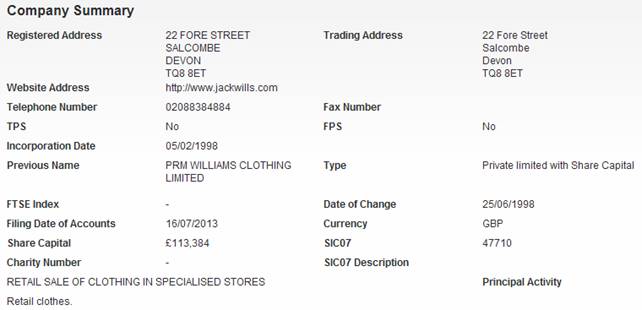
PRM WILLIAMS CLOTHING LIMITED |
|
|
|
|
Registered Office : |
|
|
|
|
|
Country : |
|
|
|
|
|
Financials (as on) : |
03.02.2013 |
|
|
|
|
Date of Incorporation : |
02.02.1998 |
|
|
|
|
Com. Reg. No.: |
03504842 |
|
|
|
|
Legal Form : |
Private limited with Share Capital |
|
|
|
|
Line of Business : |
Retails sale of clothing in specialized stores |
|
|
|
|
No of Employees : |
Not Available |
RATING & COMMENTS
|
MIRA’s Rating : |
B |
|
RATING |
STATUS |
PROPOSED CREDIT LINE |
|
|
26-40 |
B |
Capability to overcome financial difficulties seems comparatively
below average. |
Small |
|
Status : |
Moderate |
|
|
|
|
Payment Behaviour : |
Slow But Correct |
|
|
|
|
Litigation : |
Clear |
NOTES :
Any query related to this report can be made
on e-mail : infodept@mirainform.com
while quoting report number, name and date.
ECGC Country Risk Classification List – June 01, 2014
|
Country Name |
Previous Rating (31.03.2014) |
Current Rating (01.06.2014) |
|
United Kingdom |
A1 |
A1 |
|
Risk Category |
ECGC
Classification |
|
Insignificant |
A1 |
|
Low Risk |
A2 |
|
Moderate Low Risk |
B1 |
|
Moderate Risk |
B2 |
|
Moderate High Risk |
C1 |
|
High Risk |
C2 |
|
Very High Risk |
D |
UNITED KINGDOM ECONOMIC OVERVIEW
The UK, a leading trading power and financial center, is the third largest economy in Europe after Germany and France. Over the past two decades, the government has greatly reduced public ownership. Agriculture is intensive, highly mechanized, and efficient by European standards, producing about 60% of food needs with less than 2% of the labor force. The UK has large coal, natural gas, and oil resources, but its oil and natural gas reserves are declining and the UK became a net importer of energy in 2005. Services, particularly banking, insurance, and business services, are key drivers of British GDP growth. Manufacturing, meanwhile, has declined in importance but still accounts for about 10% of economic output. After emerging from recession in 1992, Britain's economy enjoyed the longest period of expansion on record during which time growth outpaced most of Western Europe. In 2008, however, the global financial crisis hit the economy particularly hard, due to the importance of its financial sector. Falling home prices, high consumer debt, and the global economic slowdown compounded Britain's economic problems, pushing the economy into recession in the latter half of 2008 and prompting the then BROWN (Labour) government to implement a number of measures to stimulate the economy and stabilize the financial markets; these included nationalizing parts of the banking system, temporarily cutting taxes, suspending public sector borrowing rules, and moving forward public spending on capital projects. Facing burgeoning public deficits and debt levels, in 2010 the CAMERON-led coalition government (between Conservatives and Liberal Democrats) initiated a five-year austerity program, which aimed to lower London's budget deficit from about 11% of GDP in 2010 to nearly 1% by 2015. In November 2011, Chancellor of the Exchequer George OSBORNE announced additional austerity measures through 2017 largely due to the euro-zone debt crisis. The CAMERON government raised the value added tax from 17.5% to 20% in 2011. It has pledged to reduce the corporation tax rate to 21% by 2014. The Bank of England (BoE) implemented an asset purchase program of £375 billion (approximately $605 billion) as of December 2013. During times of economic crisis, the BoE coordinates interest rate moves with the European Central Bank, but Britain remains outside the European Economic and Monetary Union (EMU). In 2012, weak consumer spending and subdued business investment weighed on the economy, however, in 2013 GDP grew 1.4%, accelerating unexpectedly in the second half of the year because of greater consumer spending and a recovering housing market. The budget deficit is falling but remains high at nearly 7% and public debt has continued to increase
|
Source
: CIA |
REGISTERED NAME & COMPANY
SUMMARY
DIRECTORS/MANAGEMENT
Current Directors
|
Name |
Date of Birth |
28/10/1968 |
|
|
Officers Title |
Mr |
Nationality |
British |
|
Present Appointments |
22 |
Function |
Director |
|
Appointment Date |
05/07/2007 |
|
|
|
Address |
Flat 5, 48 Chepstow
Villas, London, W11 2QY |
||
|
Name |
Date of Birth |
08/10/1973 |
|
|
Officers Title |
Mr |
Nationality |
British |
|
Present Appointments |
4 |
Function |
Director |
|
Appointment Date |
05/02/1998 |
|
|
|
Address |
Manor Farm House, East
Dean, Chichester, West Sussex, PO18 0JA |
||
|
Name |
Date of Birth |
22/10/1947 |
|
|
Officers Title |
Mr |
Nationality |
Canadian |
|
Present Appointments |
2 |
Function |
Director |
|
Appointment Date |
29/01/2009 |
|
|
|
Address |
4841 Keswick Way,
Naples, Florida 34105 |
||
|
Name |
Date of Birth |
12/06/1974 |
|
|
Officers Title |
Mr |
Nationality |
British |
|
Present Appointments |
2 |
Function |
Director |
|
Appointment Date |
05/02/1998 |
|
|
|
Address |
22 Fore Street,
Salcombe, Devon, TQ8 8ET |
||
|
Name |
Date of Birth |
02/11/1965 |
|
|
Officers Title |
Ms |
Nationality |
American |
|
Present Appointments |
2 |
Function |
Director |
|
Appointment Date |
04/09/2012 |
|
|
|
Address |
95 Victoria Road,
London, NW10 6DJ |
||
|
Name |
Date of Birth |
07/09/1974 |
|
|
Officers Title |
Ms |
Nationality |
British |
|
Present Appointments |
2 |
Function |
Director |
|
Appointment Date |
30/01/2014 |
|
|
|
Address |
95 Victoria Road,
London, NW10 6DJ |
||
Current Company Secretary
Previous Director/Company Secretaries
|
Name |
Current Directorships |
Previous Directorships |
|
4 |
1 |
|
|
0 |
3 |
|
|
0 |
3 |
|
|
0 |
1 |
|
|
2 |
1 |
|
|
0 |
1 |
|
|
0 |
1 |
|
|
50 |
36 |
|
|
1 |
1 |
|
|
24 |
27 |
|
|
2 |
1 |
|
|
1 |
2 |
|
|
1 |
2 |
NEGATIVE INFORMATION
CCJ
|
Total Number of Exact CCJs - |
Total Value of Exact CCJs - |
|
|
|
Total Number of Possible CCJs - |
Total Value of Possible CCJs - |
|
|
|
Total Number of Satisfied CCJs - |
Total Value of Satisfied CCJs - |
|
|
|
Total Number of Writs - |
- |
|
|
Exact CCJ Details
|
No CCJs found |
Possible CCJs Details
|
There are no possible
CCJ details |
Writ Details
|
No writs found |
SHARE & SHARE CAPITAL
INFORMATION
Top 20 Shareholders
|
Name |
Currency |
Share Count |
Share Type |
Nominal Value |
% of Total Share Count |
|
WILLS LIFESTYLE HOLDINGS
LTD |
GBP |
113,384 |
ORDINARY |
1 |
100 |
PAYMENT INFORMATION
Payment Trend
Improving
GROUP STRUCTURE & AFFILIATED
COMPANIES
Statistics
|
Group |
2 companies |
|
Linkages |
|
|
Countries |
Summary
|
Holding Company |
WILLS LIFESTYLE HOLDINGS
LIMITED |
|
Ownership Status |
Wholly Owned |
|
Ultimate Holding Company
|
WILLS LIFESTYLE HOLDINGS
LIMITED |
Group structure
|
Company Name |
|
Registered Number |
Latest Key Financials |
Consol. Accounts |
Turnover |
|
|
07121485 |
03.02.2013 |
Y |
£133,056,532 |
|
|
|
03504842 |
03.02.2013 |
N |
£122,123,130 |
FINANCIAL INFORMATION
Profit & Loss
|
Date Of Accounts |
03/02/13 |
(%) |
31/01/12 |
(%) |
31/01/11 |
(%) |
31/01/10 |
(%) |
31/01/09 |
|
Weeks |
53 |
(%) |
52 |
(%) |
52 |
(%) |
52 |
(%) |
52 |
|
Currency |
GBP |
(%) |
GBP |
(%) |
GBP |
(%) |
GBP |
(%) |
GBP |
|
Consolidated A/cs |
N |
(%) |
N |
(%) |
N |
(%) |
N |
(%) |
N |
|
Turnover |
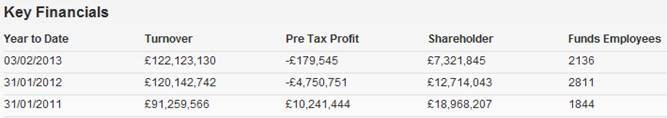
£122,123,130 |
1.6% |
£120,142,742 |
31.6% |
£91,259,566 |
40.9% |
£64,763,601 |
55% |
£41,777,842 |
|
Export |
- |
- |
- |
- |
£1,658,450 |
57.3% |
£1,054,341 |
176% |
£382,020 |
|
Cost of Sales |
£48,332,634 |
18.5% |
£40,773,523 |
41.6% |
£28,800,784 |
47% |
£19,596,948 |
52.8% |
£12,824,919 |
|
Gross Profit |
£73,790,496 |
-7% |
£79,369,219 |
27.1% |
£62,458,782 |
38.3% |
£45,166,653 |
56% |
£28,952,923 |
|
Wages & Salaries |
£25,889,122 |
17.4% |
£22,060,223 |
25% |
£17,655,055 |
25.3% |
£14,087,466 |
68% |
£8,383,543 |
|
Directors Emoluments |
£1,764,735 |
-10.8% |
£1,977,855 |
-0.3% |
£1,983,598 |
14.8% |
£1,727,340 |
64.7% |
£1,049,000 |
|
Operating Profit |
£578,719 |
113.7% |
-£4,231,804 |
-137.8% |
£11,203,590 |
63.6% |
£6,846,523 |
32.1% |
£5,183,099 |
|
Depreciation |
£5,855,745 |
2.4% |
£5,721,197 |
31% |
£4,367,367 |
32% |
£3,309,642 |
28.7% |
£2,572,130 |
|
Audit Fees |
£77,000 |
-30% |
£110,000 |
57.1% |
£70,000 |
104.7% |
£34,200 |
26.7% |
£27,000 |
|
Interest Payments |
£758,264 |
43% |
£530,260 |
295.7% |
£134,004 |
-11.3% |
£151,075 |
78.2% |
£84,762 |
|
Pre Tax Profit |
-£179,545 |
96.2% |
-£4,750,751 |
-146.4% |
£10,241,444 |
52.9% |
£6,698,856 |
31.3% |
£5,101,544 |
|
Taxation |
£1,632,467 |
208.6% |
-£1,503,413 |
54.9% |
-£3,334,319 |
-52.8% |
-£2,181,569 |
-31.5% |
-£1,658,989 |
|
Profit After Tax |
£1,452,922 |
123.2% |
-£6,254,164 |
-190.5% |
£6,907,125 |
52.9% |
£4,517,287 |
31.2% |
£3,442,555 |
|
Dividends Payable |
£6,845,120 |
- |
- |
- |
- |
- |
- |
- |
- |
|
Retained Profit |
-£5,392,198 |
13.8% |
-£6,254,164 |
-190.5% |
£6,907,125 |
52.9% |
£4,517,287 |
31.2% |
£3,442,555 |
Balance Sheet
|
Date Of Accounts |
03/02/13 |
(%) |
31/01/12 |
(%) |
31/01/11 |
(%) |
31/01/10 |
(%) |
31/01/09 |
|
Tangible Assets |
£14,360,341 |
-12.8% |
£16,469,459 |
20.6% |
£13,651,088 |
4.8% |
£13,024,674 |
49.4% |
£8,720,430 |
|
Intangible Assets |
£10,199,265 |
87.9% |
£5,429,038 |
472.6% |
£948,143 |
16.8% |
£811,746 |
- |
0 |
|
Total Fixed Assets |
£24,559,606 |
12.2% |
£21,898,497 |
50% |
£14,599,231 |
5.5% |
£13,836,420 |
58.7% |
£8,720,430 |
|
Stock |
£11,380,664 |
-18.6% |
£13,978,036 |
79.9% |
£7,770,491 |
-6% |
£8,269,794 |
105.1% |
£4,032,417 |
|
Trade Debtors |
£701,278 |
-27.2% |
£963,330 |
187.8% |
£334,678 |
134.5% |
£142,694 |
999.9% |
£892 |
|
Cash |
£4,973,744 |
24.9% |
£3,981,277 |
-75% |
£15,898,555 |
236.7% |
£4,722,198 |
6.9% |
£4,415,853 |
|
Other Debtors |
£7,849,236 |
100% |
£3,924,692 |
-29.3% |
£5,555,019 |
146.3% |
£2,255,649 |
-20.2% |
£2,826,785 |
|
Miscellaneous Current Assets |
0 |
- |
0 |
- |
0 |
- |
0 |
- |
0 |
|
Total Current Assets |
£24,904,922 |
9% |
£22,847,335 |
-22.7% |
£29,558,743 |
92.1% |
£15,390,335 |
36.5% |
£11,275,947 |
|
Trade Creditors |
£6,895,245 |
-24.4% |
£9,123,007 |
-1.7% |
£9,278,955 |
27.9% |
£7,254,088 |
-0.9% |
£7,317,481 |
|
Bank Loans &
Overdrafts |
0 |
- |
0 |
- |
0 |
- |
0 |
- |
0 |
|
Other Short Term Finance |
£4,100,922 |
31% |
£3,131,446 |
495.6% |
£525,784 |
-1.2% |
£532,074 |
- |
0 |
|
Miscellaneous Current
Liabilities |
£25,626,255 |
51.6% |
£16,902,889 |
10.7% |
£15,266,287 |
90.3% |
£8,020,799 |
75.3% |
£4,576,580 |
|
Total Current
Liabilities |
£36,622,422 |
25.6% |
£29,157,342 |
16.3% |
£25,071,026 |
58.6% |
£15,806,961 |
32.9% |
£11,894,061 |
|
Bank Loans &
Overdrafts and LTL |
£5,520,261 |
92% |
£2,874,447 |
999.9% |
£118,741 |
-86.9% |
£907,649 |
741.4% |
£107,872 |
|
Other Long Term Finance |
£5,520,261 |
92% |
£2,874,447 |
999.9% |
£118,741 |
-80.2% |
£598,655 |
- |
0 |
|
Total Long Term
Liabilities |
£5,520,261 |
92% |
£2,874,447 |
999.9% |
£118,741 |
-86.9% |
£907,649 |
741.4% |
£107,872 |
Capital & Reserves
|
Date Of Accounts |
03/02/13 |
(%) |
31/01/12 |
(%) |
31/01/11 |
(%) |
31/01/10 |
(%) |
31/01/09 |
|
Called Up Share Capital |
£113,384 |
- |
£113,384 |
- |
£113,384 |
1% |
£112,222 |
0.4% |
£111,808 |
|
P & L Account
Reserve |
£6,985,321 |
-43.6% |
£12,377,519 |
-33.6% |
£18,631,683 |
53% |
£12,176,783 |
59% |
£7,659,496 |
|
Revaluation Reserve |
- |
- |
- |
- |
- |
- |
- |
- |
- |
|
Sundry Reserves |
£223,140 |
- |
£223,140 |
- |
£223,140 |
- |
£223,140 |
- |
£223,140 |
|
Shareholder Funds |
£7,321,845 |
-42.4% |
£12,714,043 |
-33% |
£18,968,207 |
51.6% |
£12,512,145 |
56.5% |
£7,994,444 |
Other Financial Items
|
Date Of Accounts |
03/02/13 |
(%) |
31/01/12 |
(%) |
31/01/11 |
(%) |
31/01/10 |
(%) |
31/01/09 |
|
Net Worth |
-£2,877,420 |
-139.5% |
£7,285,005 |
-59.6% |
£18,020,064 |
54% |
£11,700,399 |
46.4% |
£7,994,444 |
|
Working Capital |
-£11,717,500 |
-85.7% |
-£6,310,007 |
-240.6% |
£4,487,717 |
999.9% |
-£416,626 |
32.6% |
-£618,114 |
|
Total Assets |
£49,464,528 |
10.5% |
£44,745,832 |
1.3% |
£44,157,974 |
51.1% |
£29,226,755 |
46.2% |
£19,996,377 |
|
Total Liabilities |
£42,142,683 |
31.6% |
£32,031,789 |
27.2% |
£25,189,767 |
50.7% |
£16,714,610 |
39.3% |
£12,001,933 |
|
Net Assets |
£7,321,845 |
-42.4% |
£12,714,043 |
-33% |
£18,968,207 |
51.6% |
£12,512,145 |
56.5% |
£7,994,444 |
Cash Flow
|
Date Of Accounts |
03/02/13 |
(%) |
31/01/12 |
(%) |
31/01/11 |
(%) |
31/01/10 |
(%) |
31/01/09 |
|
Net Cashflow from
Operations |
- |
- |
- |
- |
- |
- |
£9,663,168 |
-6.7% |
£10,357,251 |
|
Net Cashflow before
Financing |
- |
- |
- |
- |
- |
100% |
-£292,723 |
-120.3% |
£1,440,746 |
|
Net Cashflow from
Financing |
- |
- |
- |
- |
- |
- |
£599,068 |
999.9% |
£586 |
|
Increase in Cash |
- |
- |
- |
- |
- |
- |
£306,345 |
-78.7% |
£1,441,332 |
Miscellaneous
|
Date Of Accounts |
03/02/13 |
(%) |
31/01/12 |
(%) |
31/01/11 |
(%) |
31/01/10 |
(%) |
31/01/09 |
|
Contingent Liability |
NO |
- |
NO |
- |
NO |
- |
NO |
- |
NO |
|
Capital Employed |
£12,842,106 |
-17.6% |
£15,588,490 |
-18.3% |
£19,086,948 |
42.2% |
£13,419,794 |
65.6% |
£8,102,316 |
|
Number of Employees |
2136 |
-24% |
2811 |
52.4% |
1844 |
43.4% |
1286 |
13.7% |
1131 |
|
Auditors |
PRICEWATERHOUSECOOPERS
LLP |
||||||||
|
Auditor Comments |
The audit report
contains no adverse comments |
||||||||
|
Bankers |
|
||||||||
|
Bank Branch Code |
|
||||||||
Ratios
|
Date Of Accounts |
03/02/13 |
31/01/12 |
31/01/11 |
31/01/10 |
31/01/09 |
|
Pre-tax profit margin % |
-0.15 |
-3.95 |
11.22 |
10.34 |
12.21 |
|
Current ratio |
0.68 |
0.78 |
1.18 |
0.97 |
0.95 |
|
Sales/Net Working
Capital |
-10.42 |
-19.04 |
20.34 |
-155.45 |
-67.59 |
|
Gearing % |
75.40 |
22.60 |
0.60 |
7.30 |
1.30 |
|
Equity in % |
18.60 |
32.30 |
43.90 |
44 |
40 |
|
Creditor Days |
20.94 |
27.64 |
37.01 |
40.77 |
63.75 |
|
Debtor Days |
2.13 |
2.91 |
1.33 |
0.80 |
- |
|
Liquidity/Acid Test |
0.36 |
0.30 |
0.86 |
0.45 |
0.60 |
|
Return On Capital
Employed % |
-1.39 |
-30.47 |
53.65 |
49.91 |
62.96 |
|
Return On Total Assets
Employed % |
-0.36 |
-10.61 |
23.19 |
22.92 |
25.51 |
|
Current Debt Ratio |
5 |
2.29 |
1.32 |
1.26 |
1.48 |
|
Total Debt Ratio |
5.75 |
2.51 |
1.32 |
1.33 |
1.50 |
|
Stock Turnover Ratio % |
9.31 |
11.63 |
8.51 |
12.76 |
9.65 |
|
Return on Net Assets
Employed % |
-2.45 |
-37.36 |
53.99 |
53.53 |
63.81 |
FOREIGN EXCHANGE RATES
N-a
ADDITIONAL INFORMATION
Enquiries Trend
|
There have been 276
enquiries in the last 12 months. |
|
There are an average of
23 reports taken each month. |
Status History
|
No Status History found |
Event History
|
Date |
Description |
|
22/02/2014 |
Annual Returns |
|
10/02/2014 |
Ms S.J. Holme has left
the board |
|
10/02/2014 |
New Board Member Ms E.S.
Tate appointed |
|
25/07/2013 |
New Accounts Filed |
|
25/07/2013 |
New Accounts Filed |
|
07/06/2013 |
Mrs H.J. Feltham has
left the board |
|
31/05/2013 |
Mr T.M. Patten has left
the board |
|
31/05/2013 |
Mr G. Tinton has left
the board |
|
26/03/2013 |
Annual Returns |
|
06/02/2013 |
Mr P.A. Woolf has left
the board |
|
06/02/2013 |
Mr P.A. Woolf has
resigned as company secretary |
|
18/10/2012 |
New Accounts Filed |
|
18/10/2012 |
New Accounts Filed |
|
24/09/2012 |
New Board Member Ms W.M.
Becker appointed |
|
07/05/2012 |
Annual Returns |
Previous Company Names
|
Date |
Previous Name |
|
25/06/1998 |
PRM WILLIAMS CLOTHING
LIMITED |
|
Average Invoice Value |
£3904.49 |
|
Invoices available |
118 |
|
Paid |
92 |
|
Outstanding |
26 |
|
Trade Payment Data is information that we collect from
selected third party partners who send us information about their whole sales
ledger. |
|
|
Within Terms |
0-30 Days |
31-60 Days |
61-90 Days |
91+ Days |
|
Paid |
44 |
28 |
12 |
6 |
2 |
|
Outstanding |
5 |
8 |
5 |
6 |
2 |
NOTES & COMMENTS
Commentary
|
No exact match CCJs are
recorded against the company. |
|
|
Sales in the latest trading
period increased 1.6% on the previous trading period. |
|
|
Net Worth decreased by
139.5% during the latest trading period. |
|
|
A 10.5% growth in Total
Assets occurred during the latest trading period. |
|
|
Pre-tax profits increased
by 96.2% compared to the previous trading period. |
|
|
The company saw an
increase in their Cash Balance of 24.9% during the latest trading period. |
|
|
The audit report
contains no adverse comments. |
|
|
The company has undergone
recent changes in its directorships. |
|
|
The company is part of a
group. |
|
|
The company was
established over 16 years ago. |
|
FOREIGN EXCHANGE RATES
|
Currency |
Unit
|
Indian Rupees |
|
US Dollar |
1 |
Rs. 60.85 |
|
|
1 |
Rs. 102.68 |
|
Euro |
1 |
Rs. 81.46 |
INFORMATION DETAILS
|
Analysis Done by
: |
DIV |
|
|
|
|
Report Prepared
by : |
DPT |
RATING EXPLANATIONS
|
RATING |
STATUS |
PROPOSED CREDIT LINE |
|
|
>86 |
Aaa |
Possesses an extremely sound financial base with the strongest
capability for timely payment of interest and principal sums |
Unlimited |
|
71-85 |
Aa |
Possesses adequate working capital. No caution needed for credit
transaction. It has above average (strong) capability for payment of interest
and principal sums |
Large |
|
56-70 |
A |
Financial & operational base are regarded healthy. General
unfavourable factors will not cause fatal effect. Satisfactory capability for
payment of interest and principal sums |
Fairly Large |
|
41-55 |
Ba |
Overall operation is considered normal. Capable to meet normal
commitments. |
Satisfactory |
|
26-40 |
B |
Capability to overcome
financial difficulties seems comparatively below average. |
Small |
|
11-25 |
Ca |
Adverse factors are apparent. Repayment of interest and principal sums
in default or expected to be in default upon maturity |
Limited with
full security |
|
<10 |
C |
Absolute credit risk exists. Caution needed to be exercised |
Credit not
recommended |
|
-- |
NB |
New Business |
-- |
This score serves as a reference to assess SC’s credit risk and
to set the amount of credit to be extended. It is calculated from a composite
of weighted scores obtained from each of the major sections of this report. The
assessed factors and their relative weights (as indicated through %) are as
follows:
Financial
condition (40%) Ownership
background (20%) Payment
record (10%)
Credit history
(10%) Market trend
(10%) Operational
size (10%)
This report is issued at your request without any
risk and responsibility on the part of MIRA INFORM PRIVATE LIMITED (MIPL)
or its officials.