MIRA
INFORM REPORT
|
Report Date : |
04.08.2014 |
IDENTIFICATION DETAILS
|
Name : |
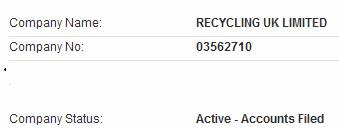
RECYCLING UK LIMITED |
|
|
|
|
Formerly Known As : |
FIBRE RECYCLING UK LIMITED |
|
|
|
|
Registered Office : |
|
|
|
|
|
Country : |
|
|
|
|
|
Financials (as on) : |
30.06.2013 |
|
|
|
|
Date of Incorporation : |
30.11.2004 |
|
|
|
|
Com. Reg. No.: |
03562710 |
|
|
|
|
Legal Form : |
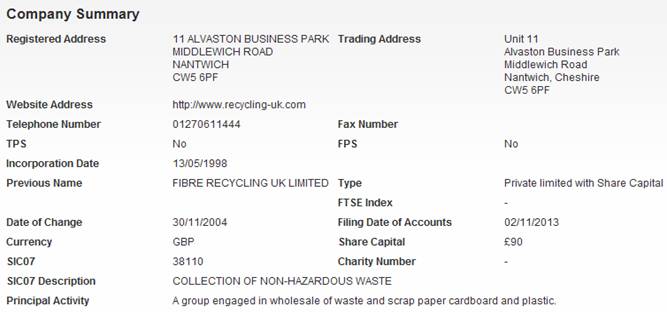
Private limited with Share Capital |
|
|
|
|
Line of Business : |
Subject is engaged in collection of non-hazardous waste |
|
|
|
|
No of Employees : |
28 |
RATING & COMMENTS
|
MIRA’s Rating : |
Ba |
|
RATING |
STATUS |
PROPOSED CREDIT LINE |
|
|
41-55 |
Ba |
Overall operation is considered normal. Capable to meet normal
commitments. |
Satisfactory |
|
Status : |
Satisfactory |
|
|
|
|
Payment Behaviour : |
Slow But Correct |
|
|
|
|
Litigation : |
Clear |
NOTES :
Any query related to this report can be made
on e-mail : infodept@mirainform.com
while quoting report number, name and date.
ECGC Country Risk Classification List – June 01, 2014
|
Country Name |
Previous Rating (31.03.2014) |
Current Rating (01.06.2014) |
|
|
A1 |
A1 |
|
Risk Category |
ECGC
Classification |
|
Insignificant |
A1 |
|
Low Risk |
A2 |
|
Moderate Low Risk |
B1 |
|
Moderate Risk |
B2 |
|
Moderate High Risk |
C1 |
|
High Risk |
C2 |
|
Very High Risk |
D |
The
|
Source
: CIA |
REGISTERED NAME & COMPANY
SUMMARY
DIRECTORS/MANAGEMENT
Current Directors
|
Name |
Neil Russell Clarke |
Date of Birth |
31/08/1955 |
|
Officers Title |
Mr |
Nationality |
British |
|
Present Appointments |
8 |
Function |
Director |
|
Appointment Date |
09/06/1998 |
|
|
|
Address |
The Forge 8 Manor Farm
Barns , Long Lane,, Wettenhall, Winsford, |
||
|
Name |
Anthony Simon Marsden |
Date of Birth |
23/07/1962 |
|
Officers Title |
Mr |
Nationality |
British |
|
Present Appointments |
15 |
Function |
Director |
|
Appointment Date |
17/09/1998 |
|
|
|
Address |
37 Downham Chase,
Timperley, Altrincham, |
||
|
Name |
Stephen Frank Bell |
Date of Birth |
06/08/1957 |
|
Officers Title |
Mr |
Nationality |
British |
|
Present Appointments |
6 |
Function |
Director |
|
Appointment Date |
25/07/2005 |
|
|
|
Address |
8 Darkie Meadow,
Bunbury, Tarporley, |
||
Current Company Secretary
|
Name |
Anthony Simon Marsden |
Date of Birth |
23/07/1962 |
|
Officers Title |
Mr |
Nationality |
British |
|
Present Appointments |
15 |
Function |
Company Secretary |
|
Appointment Date |
01/06/1999 |
|
|
|
Address |
37 Downham Chase,
Timperley, Altrincham, |
||
Previous Director/Company Secretaries
|
Name |
Current Directorships |
Previous Directorships |
|
Thomas Maurice Clarke |
0 |
6 |
|
Patricia Jill Cox |
0 |
1 |
|
WATERLOW NOMINEES
LIMITED |
3006 |
104288 |
|
WATERLOW SECRETARIES
LIMITED |
3102 |
107211 |
NEGATIVE INFORMATION
CCJ
|
Total Number of Exact
CCJs - |
0 |
Total Value of Exact
CCJs - |
|
|
Total Number of Possible
CCJs - |
0 |
Total Value of Possible
CCJs - |
|
|
Total Number of
Satisfied CCJs - |
0 |
Total Value of Satisfied
CCJs - |
|
|
Total Number of Writs - |
- |
|
|
Exact CCJ Details
|
No CCJs found |
Possible CCJs Details
|
There are no possible
CCJ details |
Writ Details
|
No writs found |
SHARE & SHARE CAPITAL
INFORMATION
Top 20 Shareholders
|
Name |
Currency |
Share Count |
Share Type |
Nominal Value |
% of Total Share Count |
|
ANTHONY SIMON MARSDEN |
GBP |
40 |
ORDINARY |
1 |
44.44 |
|
NEIL RUSSELL CLARKE |
GBP |
40 |
ORDINARY |
1 |
44.44 |
|
STEPHEN FRANK BELL |
GBP |
10 |
ORDINARY |
1 |
11.11 |
PAYMENT INFORMATION
Payment Trend
Worsening
GROUP STRUCTURE & AFFILIATED
COMPANIES
Statistics
|
Group |
2 companies |
|
Linkages |
0 companies |
|
Countries |
In 0 countries |
Summary
|
Holding Company |
RECYCLING UK LIMITED |
|
Ownership Status |
Ultimately Owned |
|
Ultimate Holding Company
|
RECYCLING UK LIMITED |
Group structure
|
Company Name |
|
Registered Number |
Latest Key Financials |
Consol. Accounts |
Turnover |
|
|
|
03562710 |
30.06.2013 |
Y |
£15,923,171 |
|
|
|
07156752 |
30.06.2013 |
N |
|
FINANCIAL INFORMATION
Profit & Loss
|
Date Of Accounts |
30/06/13 |
(%) |
30/06/12 |
(%) |
30/06/11 |
(%) |
30/06/10 |
(%) |
30/06/09 |
|
Weeks |
52 |
(%) |
52 |
(%) |
52 |
(%) |
52 |
(%) |
52 |
|
Currency |
GBP |
(%) |
GBP |
(%) |
GBP |
(%) |
GBP |
(%) |
GBP |
|
Consolidated A/cs |
Y |
(%) |
Y |
(%) |
Y |
(%) |
N |
(%) |
N |
|
Turnover |
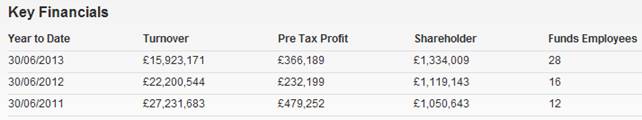
£15,923,171 |
-28.3% |
£22,200,544 |
-18.5% |
£27,231,683 |
50.7% |
£18,064,926 |
18.1% |
£15,291,726 |
|
Export |
- |
- |
£4,768,433 |
-25% |
£6,354,883 |
40.4% |
£4,527,657 |
20.9% |
£3,744,635 |
|
Cost of Sales |
£13,493,712 |
-34.8% |
£20,709,900 |
-19.9% |
£25,862,553 |
53.3% |
£16,874,177 |
20.1% |
£14,044,640 |
|
Gross Profit |
£2,429,459 |
63% |
£1,490,644 |
8.9% |
£1,369,130 |
15% |
£1,190,749 |
-4.5% |
£1,247,086 |
|
Wages & Salaries |
£963,622 |
68.9% |
£570,394 |
2% |
£559,238 |
7.4% |
£520,719 |
- |
- |
|
Directors Emoluments |
£347,226 |
0.3% |
£346,334 |
4.2% |
£332,385 |
-0.1% |
£332,686 |
-18.9% |
£410,194 |
|
Operating Profit |
£369,478 |
57% |
£235,403 |
-50.8% |
£478,890 |
103.1% |
£235,804 |
-33.4% |
£354,255 |
|
Depreciation |
£173,048 |
119.6% |
£78,801 |
78% |
£44,261 |
9.9% |
£40,259 |
-8.6% |
£44,059 |
|
Audit Fees |
£11,500 |
-11.5% |
£13,000 |
109.7% |
£6,200 |
3.3% |
£6,000 |
- |
£6,000 |
|
Interest Payments |
£3,291 |
-0.8% |
£3,319 |
- |
- |
-100% |
£5,409 |
-19.6% |
£6,729 |
|
Pre Tax Profit |
£366,189 |
57.7% |
£232,199 |
-51.5% |
£479,252 |
107.9% |
£230,558 |
-36.8% |
£364,809 |
|
Taxation |
-£97,323 |
-41.7% |
-£68,699 |
42.5% |
-£119,575 |
-135.7% |
-£50,733 |
41.5% |
-£86,689 |
|
Profit After Tax |
£268,866 |
64.4% |
£163,500 |
-54.5% |
£359,677 |
100% |
£179,825 |
-35.3% |
£278,120 |
|
Dividends Payable |
£54,000 |
-43.2% |
£95,000 |
26.7% |
£75,000 |
-64.4% |
£210,400 |
999.9% |
£15,000 |
|
Retained Profit |
£214,866 |
213.7% |
£68,500 |
-75.9% |
£284,677 |
999.9% |
-£30,575 |
-111.6% |
£263,120 |
Balance Sheet
|
Date Of Accounts |
30/06/13 |
(%) |
30/06/12 |
(%) |
30/06/11 |
(%) |
30/06/10 |
(%) |
30/06/09 |
|
Tangible Assets |
£1,058,311 |
-22.4% |
£1,364,615 |
754.9% |
£159,625 |
17.9% |
£135,404 |
-24.1% |
£178,396 |
|
Intangible Assets |
£857,981 |
7.3% |
£799,818 |
- |
0 |
- |
0 |
- |
0 |
|
Total Fixed Assets |
£1,916,292 |
-11.5% |
£2,164,433 |
999.9% |
£159,625 |
17.9% |
£135,404 |
-24.1% |
£178,396 |
|
Stock |
£32,889 |
87% |
£17,592 |
- |
0 |
- |
0 |
- |
0 |
|
Trade Debtors |
£1,621,141 |
-28.3% |
£2,262,061 |
-36.5% |
£3,564,851 |
29.1% |
£2,762,010 |
30.4% |
£2,117,520 |
|
Cash |
£198,282 |
-24.4% |
£262,270 |
-53.1% |
£559,470 |
-0.2% |
£560,657 |
306.6% |
£137,880 |
|
Other Debtors |
£220,576 |
-28.6% |
£308,951 |
-1% |
£312,011 |
77.9% |
£175,397 |
-5.2% |
£185,094 |
|
Miscellaneous Current
Assets |
0 |
- |
0 |
- |
0 |
- |
0 |
- |
0 |
|
Total Current Assets |
£2,072,888 |
-27.3% |
£2,850,874 |
-35.7% |
£4,436,332 |
26.8% |
£3,498,064 |
43.3% |
£2,440,494 |
|
Trade Creditors |
£1,343,416 |
-31.3% |
£1,954,494 |
-32.8% |
£2,908,923 |
30.2% |
£2,234,617 |
92.6% |
£1,160,061 |
|
Bank Loans &
Overdrafts |
0 |
-100% |
£7,412 |
- |
0 |
- |
0 |
- |
0 |
|
Other Short Term Finance |
£115,040 |
40% |
£82,196 |
-0.9% |
£82,967 |
-49.4% |
£163,962 |
322.3% |
£38,829 |
|
Miscellaneous Current
Liabilities |
£853,043 |
-33.5% |
£1,283,203 |
161.8% |
£490,107 |
21.5% |
£403,340 |
-22.3% |
£518,880 |
|
Total Current
Liabilities |
£2,311,499 |
-30.5% |
£3,327,305 |
-4.4% |
£3,481,997 |
24.3% |
£2,801,919 |
63.1% |
£1,717,770 |
|
Bank Loans &
Overdrafts and LTL |
£343,672 |
-40.4% |
£576,271 |
810.1% |
£63,317 |
306.3% |
£15,583 |
-71.4% |
£54,579 |
|
Other Long Term Finance |
£53,518 |
7% |
£50,036 |
-16.3% |
£59,801 |
314.7% |
£14,420 |
-70.6% |
£48,999 |
|
Total Long Term Liabilities |
£343,672 |
-39.6% |
£568,859 |
798.4% |
£63,317 |
306.3% |
£15,583 |
-71.4% |
£54,579 |
.
Capital & Reserves
|
Date Of Accounts |
30/06/13 |
(%) |
30/06/12 |
(%) |
30/06/11 |
(%) |
30/06/10 |
(%) |
30/06/09 |
|
Called Up Share Capital |
£90 |
- |
£90 |
- |
£90 |
-10% |
£100 |
- |
£100 |
|
P & L Account
Reserve |
£1,333,909 |
19.2% |
£1,119,043 |
6.5% |
£1,050,543 |
28.8% |
£815,866 |
-3.6% |
£846,441 |
|
Revaluation Reserve |
- |
- |
- |
- |
- |
- |
- |
- |
- |
|
Sundry Reserves |
£10 |
- |
£10 |
- |
£10 |
- |
- |
- |
- |
|
Shareholder Funds |
£1,334,009 |
19.2% |
£1,119,143 |
6.5% |
£1,050,643 |
28.8% |
£815,966 |
-3.6% |
£846,541 |
Other Financial Items
|
Date Of Accounts |
30/06/13 |
(%) |
30/06/12 |
(%) |
30/06/11 |
(%) |
30/06/10 |
(%) |
30/06/09 |
|
Net Worth |
£476,028 |
49.1% |
£319,325 |
-69.6% |
£1,050,643 |
28.8% |
£815,966 |
-3.6% |
£846,541 |
|
Working Capital |
-£238,611 |
49.9% |
-£476,431 |
-149.9% |
£954,335 |
37.1% |
£696,145 |
-3.7% |
£722,724 |
|
Total Assets |
£3,989,180 |
-20.5% |
£5,015,307 |
9.1% |
£4,595,957 |
26.5% |
£3,633,468 |
38.7% |
£2,618,890 |
|
Total Liabilities |
£2,655,171 |
-31.9% |
£3,896,164 |
9.9% |
£3,545,314 |
25.8% |
£2,817,502 |
59% |
£1,772,349 |
|
Net Assets |
£1,334,009 |
19.2% |
£1,119,143 |
6.5% |
£1,050,643 |
28.8% |
£815,966 |
-3.6% |
£846,541 |
Cash Flow
|
Date Of Accounts |
30/06/13 |
(%) |
30/06/12 |
(%) |
30/06/11 |
(%) |
30/06/10 |
(%) |
30/06/09 |
|
Net Cashflow from
Operations |
£779,970 |
15.2% |
£677,044 |
999.9% |
£59,404 |
-92.3% |
£768,051 |
- |
- |
|
Net Cashflow before
Financing |
£615,194 |
185.1% |
-£722,889 |
-999.9% |
£7,627 |
-98.4% |
£463,023 |
- |
- |
|
Net Cashflow from
Financing |
-£220,528 |
-540.1% |
-£34,453 |
-290.9% |
-£8,814 |
78.1% |
-£40,246 |
- |
- |
|
Increase in Cash |
£394,666 |
152.1% |
-£757,342 |
-999.9% |
-£1,187 |
-100.3% |
£422,777 |
- |
- |
Miscellaneous
|
Date Of Accounts |
30/06/13 |
(%) |
30/06/12 |
(%) |
30/06/11 |
(%) |
30/06/10 |
(%) |
30/06/09 |
|
Contingent Liability |
NO |
- |
NO |
- |
NO |
- |
NO |
- |
NO |
|
Capital Employed |
£1,677,681 |
-0.6% |
£1,688,002 |
51.5% |
£1,113,960 |
34% |
£831,549 |
-7.7% |
£901,120 |
|
Number of Employees |
28 |
75% |
16 |
33.3% |
12 |
20% |
10 |
- |
- |
|
Auditors |
BAKER TILLY UK AUDIT LLP |
||||||||
|
Auditor Comments |
The audit report
contains no adverse comments |
||||||||
|
Bankers |
|
||||||||
|
Bank Branch Code |
|
||||||||
Ratios
|
Date Of Accounts |
30/06/13 |
30/06/12 |
30/06/11 |
30/06/10 |
30/06/09 |
|
Pre-tax profit margin % |
2.30 |
1.05 |
1.76 |
1.28 |
2.39 |
|
Current ratio |
0.90 |
0.86 |
1.27 |
1.25 |
1.42 |
|
Sales/Net Working
Capital |
-66.73 |
-46.60 |
28.53 |
25.95 |
21.16 |
|
Gearing % |
25.80 |
51.50 |
6 |
1.90 |
6.40 |
|
Equity in % |
42.60 |
26.50 |
22.90 |
22.50 |
32.30 |
|
Creditor Days |
30.71 |
32.04 |
38.88 |
45.02 |
27.61 |
|
Debtor Days |
37.05 |
37.08 |
47.65 |
55.65 |
50.40 |
|
Liquidity/Acid Test |
0.88 |
0.85 |
1.27 |
1.24 |
1.42 |
|
Return On Capital
Employed % |
21.82 |
13.75 |
43.02 |
27.72 |
40.48 |
|
Return On Total Assets
Employed % |
9.17 |
4.62 |
10.42 |
6.34 |
13.92 |
|
Current Debt Ratio |
1.73 |
2.97 |
3.31 |
3.43 |
2.02 |
|
Total Debt Ratio |
1.99 |
3.48 |
3.37 |
3.45 |
2.09 |
|
Stock Turnover Ratio % |
0.20 |
0.07 |
- |
- |
- |
|
Return on Net Assets
Employed % |
27.45 |
20.74 |
45.61 |
28.25 |
43.09 |
Creditor Details
|
|
Total
Number |
Total
Value |
|
Trade Creditors |
0 |
- |
|
No Creditor Data |
Trade Debtors / Bad Debt Detail
|
|
Total
Number of Documented Trade |
Total
Value of Documented Trade |
|
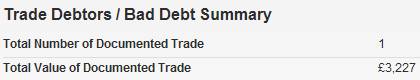
Trade Debtors |
1 |
£3,227 |
|
Company Name |
Amount |
Statement Date |
|
G A Recycling &
Distribution Ltd |
£3,227 |
25/11/2010 |
FOREIGN EXCHANGE RATES
N/a
ADDITIONAL INFORMATION
Enquiries Trend
|
There have been 73
enquiries in the last 12 months. |
|
There are an average of
6 reports taken each month. |
Status History
|
No Status History found |
Event History
|
Date |
Description |
|
29/04/2014 |
Annual Returns |
|
12/11/2013 |
New Accounts Filed |
|
12/11/2013 |
New Accounts Filed |
|
30/04/2013 |
Annual Returns |
|
22/02/2013 |
New Accounts Filed |
|
22/02/2013 |
New Accounts Filed |
|
03/05/2012 |
Annual Returns |
|
30/11/2011 |
New Accounts Filed |
|
30/11/2011 |
New Accounts Filed |
|
25/05/2011 |
Annual Returns |
|
30/12/2010 |
New Accounts Filed |
|
30/12/2010 |
New Accounts Filed |
|
19/05/2010 |
Annual Returns |
|
29/10/2009 |
New Accounts Filed |
|
29/10/2009 |
New Accounts Filed |
Previous Company Names
|
Date |
Previous Name |
|
30/11/2004 |
FIBRE RECYCLING UK
LIMITED |
|
22/06/1998 |
SPEED 7109 LIMITED |
NOTES & COMMENTS
Commentary
|
No exact match CCJs are
recorded against the company. |
|
|
Sales in the latest
trading period decreased 28.3% on the previous trading period. |
|
|
Net Worth increased by
49.1% during the latest trading period. |
|
|
A 20.5% decline in Total
Assets occurred during the latest trading period. |
|
|
Pre-tax profits
increased by 57.7% compared to the previous trading period. |
|
|
The company saw a
decrease in their Cash Balance of 24.4% during the latest trading period. |
|
|
The audit report
contains no adverse comments. |
|
|
No recent changes in
directorship are recorded. |
|
|
The company is part of a
group. |
|
|
The company was
established over 16 years ago. |
|
FOREIGN EXCHANGE RATES
|
Currency |
Unit
|
Indian Rupees |
|
US Dollar |
1 |
Rs. 60.85 |
|
|
1 |
Rs. 102.68 |
|
Euro |
1 |
Rs. 81.46 |
INFORMATION DETAILS
|
Analysis Done by
: |
DIV |
|
|
|
|
Report Prepared
by : |
DPT |
RATING EXPLANATIONS
|
RATING |
STATUS |
PROPOSED CREDIT LINE |
|
|
>86 |
Aaa |
Possesses an extremely sound financial base with the strongest
capability for timely payment of interest and principal sums |
Unlimited |
|
71-85 |
Aa |
Possesses adequate working capital. No caution needed for credit
transaction. It has above average (strong) capability for payment of interest
and principal sums |
Large |
|
56-70 |
A |
Financial & operational base are regarded healthy. General
unfavourable factors will not cause fatal effect. Satisfactory capability for
payment of interest and principal sums |
Fairly Large |
|
41-55 |
Ba |
Overall
operation is considered normal. Capable to meet normal commitments. |
Satisfactory |
|
26-40 |
B |
Capability to overcome financial difficulties seems comparatively below
average. |
Small |
|
11-25 |
Ca |
Adverse factors are apparent. Repayment of interest and principal sums
in default or expected to be in default upon maturity |
Limited with
full security |
|
<10 |
C |
Absolute credit risk exists. Caution needed to be exercised |
Credit not
recommended |
|
-- |
NB |
New Business |
-- |
This score serves as a reference to assess SC’s credit risk and
to set the amount of credit to be extended. It is calculated from a composite
of weighted scores obtained from each of the major sections of this report. The
assessed factors and their relative weights (as indicated through %) are as
follows:
Financial
condition (40%) Ownership
background (20%) Payment
record (10%)
Credit history
(10%) Market trend
(10%) Operational
size (10%)
This report is issued at your request without any
risk and responsibility on the part of MIRA INFORM PRIVATE LIMITED (MIPL)
or its officials.