MIRA
INFORM REPORT
|
Report Date : |
07.08.2014 |
IDENTIFICATION DETAILS
|
Name : |
ARCUS |
|
|
|
|
Registered Office : |
Nijverheidstraat 4 3316AP |
|
|
|
|
Country : |
|
|
|
|
|
Financials (as on) : |
2012 |
|
|
|
|
Date of Incorporation : |
01.03.1981 |
|
|
|
|
Com. Reg. No.: |
24338907 |
|
|
|
|
Legal Form : |
Private Company |
|
|
|
|
Line of Business : |
Wholesale of ferrous metals and ferrous semi-finished products |
|
|
|
|
No. of Employees |
45 |
RATING & COMMENTS
|
MIRA’s Rating : |
Ba |
|
RATING |
STATUS |
PROPOSED CREDIT LINE |
|
|
41-55 |
Ba |
Overall operation is considered normal. Capable to meet normal
commitments. |
Satisfactory |
|
Status : |
Satisfactory |
|
Payment Behaviour : |
No complaints |
|
Litigation : |
Clear |
NOTES :
Any query related to this report can be made
on e-mail : infodept@mirainform.com
while quoting report number, name and date.
ECGC Country Risk Classification List – June 1, 2014
|
Country Name |
Previous Rating (31.03.2014) |
Current Rating (01.06.2014) |
|
|
A1 |
A1 |
|
Risk Category |
ECGC
Classification |
|
Insignificant |
A1 |
|
Low |
A2 |
|
Moderate |
B1 |
|
High |
B2 |
|
Very High |
C1 |
|
Restricted |
C2 |
|
Off-credit |
D |
|
Source
: CIA |
Company name and address
|
Company name |
ARCUS |
|
Operative address |
Nijverheidstraat 4 3316AP |
|
Legal form |
Private Company |
|
Registration number |
KvK-nummer: 24338907 |
|
VAT-number |
810897581 |
Year 2012 Mutation 2011 Mutation 2010
|
Fixed assets |
1.364.808 |
|
-2,01 |
1.392.762 |
|
3,22 |
1.349.265 |
|
Total receivables |
4.472.147 |
|
0,93 |
4.431.145 |
|
9,99 |
4.028.576 |
|
|
|||||||
|
Total equity |
7.170.631 |
|
8,12 |
6.631.836 |
|
15,10 |
5.761.593 |
|
Short term liabilities |
9.362.812 |
|
28,71 |
7.274.125 |
|
20,37 |
6.043.334 |
|
|
|||||||
|
Net result |
538.795 |
|
-38,09 |
870.243 |
|
1.290,12 |
62.602 |
|
|
|||||||
|
Working capital |
5.992.739 |
|
10,01 |
5.447.625 |
|
20,40 |
4.524.788 |
|
Quick ratio |
0,54 |
% |
-11,48 |
0,61 |
|
-8,96 |
0,67 |

Contact information
Company name Arcus Nederland B.V.
Trade names Arcus Nederland B.V.
Operative address Nijverheidstraat 4
3316AP
Correspondence address Postbus 846
3300AV
Telephone number 0786483648
Fax number 0786483600
Email address sales@arcus.nl
Website www.arcus.nl
Registration
Registration number KvK-nummer: 24338907
Branch number 000018905943
VAT-number 810897581
Status Active
First registration company register 2002-09-02
Memorandum 2002-08-21
Establishment date 1981-03-01
Legal form Private Company
Activities
SBI Wholesale of ferrous metals and ferrous semi-finished products (46722)
Exporter No
Importer No
Goal Wholesale stainless steel
Relations
Shareholders
Arcus Holding B.V.
Nijverheidstraat 4
3316AP
Registration number: 230454930000
Percentage: 100%
COMPANIES ON SAME ADDRESS
Arcus Holding B.V.
Registration number: 230454930000
Sosta B.V.
Registration number: 243304950000
Sosta Holding B.V.
Registration number: 243481560000
Bank details
Accounts Fortis Bank (
Account number: 64.27.00.044
Management
ACTIVE MANAGEMENT
Arcus Holding B.V.
Nijverheidstraat 4
3316AP
Registration number: 230454930000
Competence: Fully authorized
Function: Manager
Starting date: 2002-08-22
Employees
|
|||
|
Year |
2014 2012 |
2011 |
2010 2009 |
|
Total |
45 45 |
30 |
46 50 |
|
Key figures |
|||||
|
|
|||||
|
Year |
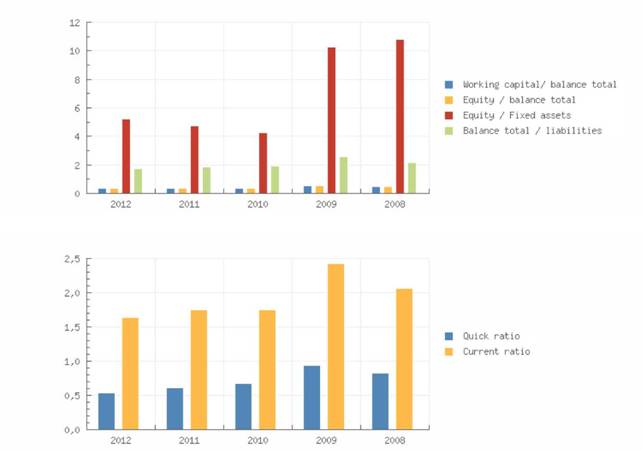
2012 |
2011 |
2010 |
2009 |
2008 |
|
Quick ratio |
0,54 |
0,61 |
0,67 |
0,94 |
0,82 |
|
Current ratio |
1,64 |
1,75 |
1,75 |
2,43 |
2,06 |
|
|
|||||
|
Working capital/ balance
total |
0,36 |
0,39 |
0,38 |
0,55 |
0,49 |
|
Year |
2012 |
2011 |
2010 |
2009 |
2008 |
|
Equity / balance total |
0,43 |
0,47 |
0,48 |
0,61 |
0,53 |
|
Equity / Fixed assets |
5,25 |
4,76 |
4,27 |
10,24 |
10,83 |
|
Equity / liabilities |
0,75 |
0,89 |
0,94 |
1,58 |
1,15 |
|
Balance total /
liabilities |
1,75 |
1,89 |
1,94 |
2,58 |
2,15 |
|
|
|||||
|
Working capital |
5.992.739 |
5.447.625 |
4.524.788 |
5.149.955 |
5.151.000 |
|
Equity |
7.170.631 |
6.631.836 |
5.761.593 |
5.698.991 |
5.634.000 |
|
Mutation equity |
8,12 |
15,10 |
1,10 |
1,15 |
4,83 |
|
Mutation short term
liabilities |
28,71 |
20,37 |
67,40 |
-25,79 |
-22,99 |
|
|
|||||
|
Return on total assets
(ROA) |
4,12 |
8,02 |
0,77 |
2,19 |
7,55 |
|
Return on equity (ROE) |
9,62 |
17,07 |
1,59 |
3,59 |
14,11 |
|
Gross profit margin |
3,25 |
4,94 |
1,44 |
2,07 |
4,45 |
|
Net profit margin |
1,74 |
3,07 |
0,33 |
0,77 |
2,22 |
|
|
|||||
|
Average collection ratio |
3,30 |
3,90 |
3,18 |
5,55 |
5,64 |
|
Average payment ratio |
6,91 |
6,41 |
4,77 |
6,25 |
6,90 |
|
Equity turnover ratio |
4,31 |
4,28 |
3,33 |
3,52 |
4,87 |
|
Total assets turnover
ratio |
1,85 |
2,01 |
1,61 |
2,15 |
2,61 |
|
Fixed assets turnover
ratio |
22,65 |
20,38 |
14,23 |
36,03 |
52,80 |
|
Inventory conversion ratio |
3,00 |
3,44 |
2,95 |
3,72 |
4,56 |
|
|
|||||
|
Turnover |
30.915.634 |
28.381.652 |
19.206.491 |
20.051.558 |
27.456.000 |
|
Gross margin |
6.398.013 |
6.618.939 |
4.056.752 |
4.235.974 |
|
|
Operating result |
1.005.427 |
1.403.159 |
276.825 |
415.090 |
1.223.000 |
|
Net result after taxes |
538.795 |
870.243 |
62.602 |
155.341 |
609.000 |
|
|
|||||
|
Cashflow |
765.071 |
1.091.524 |
222.053 |
305.656 |
774.000 |
|
Gross profit |
|
|
|
|
27.456.000 |
|
EBIT |
1.005.427 |
1.403.159 |
276.825 |
415.090 |
1.223.000 |
|
EBITDA |
1.231.703 |
1.624.440 |
436.276 |
565.405 |
1.388.000 |
Summary
The 2012 financial result structure is a postive working captial of 5.992.739 euro, which is in
agreement with 36 % of the total assets of the company.
The working capital has increase with 10.01 % compared to previous year. The ratio with
respect to the total assets of the company has however, declined.
The improvement between 2011 and 2012 has mainly been caused by a current liabilities
reduction.
The current ratio of the company in 2012 was 1.64. A company with a current ratio between
1.5 and 3.0 generally indicates good short-term financial strength.
The quick ratio in 2012 of the company was 0.54. A company with a Quick Ratio of less than
1 cannot currently pay back its current liabilities.
The 2011 financial result structure is a postive working captial of 5.447.625 euro, which is in
agreement with 39 % of the total assets of the company.
The working capital has increased with 20.4 % compared to previous year. The ratio, with
respect to the total assets of the company has however, increased.
The improvement between 2010 and 2011 has mainly been caused by an increase of the
current assets.
The current ratio of the company in 2011 was 1.75. A company with a current ratio between
1.5 and 3.0 generally indicates good short-term financial strength.
The quick ratio in 2011 of the company was 0.61. A company with a Quick Ratio of less than
1 cannot currently pay back its current liabilities.
Financial statement
Type of annual account Corporate
Annual account Arcus
Nederland B.V.
Nijverheidstraat 4
3316AP
Registration number: 243389070000
Balance
|
Year |
2012 |
2011 |
2010 |
2009 |
2008 |
|
End date |
2012-12-31 |
2011-12-31 |
2010-12-31 |
2009-12-31 |
2008-12-31 |
|
Other tangible fixed
assets |
|
|
|
|
520.000 |
|
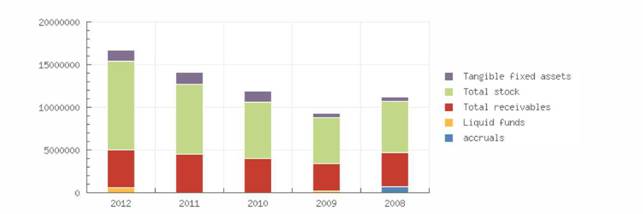
Tangible fixed assets |
1.364.808 |
1.392.762 |
1.349.265 |
556.536 |
520.000 |
|
Fixed assets |
1.364.808 |
1.392.762 |
1.349.265 |
556.536 |
520.000 |
|
|
|||||
|
Other stock |
|
|
|
|
6.024.000 |
|
Total stock |
10.317.516 |
8.262.134 |
6.519.816 |
5.383.017 |
6.024.000 |
|
Accounts receivable |
4.133.188 |
4.034.730 |
3.372.147 |
2.681.697 |
3.317.000 |
|
Other receivables |
338.959 |
396.415 |
656.429 |
527.589 |
660.000 |
|
Total receivables |
4.472.147 |
4.431.145 |
4.028.576 |
3.209.286 |
3.978.000 |
|
Liquid funds |
565.888 |
28.471 |
19.730 |
167.824 |
14.000 |
|
accruals |
|
|
|
|
660.000 |
|
Current assets |
15.355.551 |
12.721.750 |
10.568.122 |
8.760.127 |
10.016.000 |
|
Year |
2012 |
2011 |
2010 |
2009 |
2008 |
|
End date |
2012-12-31 |
2011-12-31 |
2010-12-31 |
2009-12-31 |
2008-12-31 |
|
Total assets |
16.720.359 |
14.114.512 |
11.917.387 |
9.316.663 |
10.536.000 |
|
|
|||||
|
Issued capital |
50.000 |
50.000 |
50.000 |
50.000 |
50.000 |
|
Share premium reserve |
2.487.049 |
2.487.049 |
2.487.049 |
2.487.049 |
2.487.000 |
|
Other reserves |
4.094.787 |
3.224.544 |
3.161.942 |
3.006.601 |
2.487.000 |
|
Non-distributable profit |
538.795 |
870.243 |
62.602 |
155.341 |
609.000 |
|
Total reserves |
7.120.631 |
6.581.836 |
5.711.593 |
5.648.991 |
5.583.000 |
|
Total equity |
7.170.631 |
6.631.836 |
5.761.593 |
5.698.991 |
5.634.000 |
|
|
|||||
|
Provisions |
186.916 |
208.551 |
112.460 |
|
|
|
Long term interest
yielding debt |
|
|
|
7.500 |
|
|
Other long term
liabilities |
|
|
|
|
38.000 |
|
Long term liabilities |
|
7.500 |
38.000 |
||
|
Accounts payable |
3.316.998 |
2.783.228 |
2.629.545 |
1.485.988 |
1.413.000 |
|
Other short term
liabilities |
6.045.814 |
4.490.897 |
3.413.789 |
2.124.184 |
3.452.000 |
|
Short term liabilities |
9.362.812 |
7.274.125 |
6.043.334 |
3.610.172 |
4.865.000 |
|
Total short and long term
liabilities |
9.549.728 |
7.482.676 |
6.155.794 |
3.617.672 |
4.903.000 |
|
Total liabilities |
16.720.359 |
14.114.512 |
11.917.387 |
9.316.663 |
10.536.000 |
Summary
The total assets of the company increased with 18.46 % between 2011 and 2012.
Despite the assets growth, the non current assets decreased with -2.01 %.
The asset growth has mainly been financed by a debt increase of 27.62 %. The Net Worth,
however, grew with 8.12 %.
In 2012 the assets of the company were 8.16 % composed of fixed assets and 91.84 % by
current assets. The assets are being financed by an equity of 42.89 %, and total debt of
57.11 %.
The total assets of the company increased with 18.44 % between 2010 and 2011.
The fixed asset growth of 3.22 % is lower than the total asset growth.
The asset growth has mainly been financed by a debt increase of 21.56 %. The Net Worth,
however, grew with 15.1 %.
In 2011 the assets of the company were 9.87 % composed of fixed assets and 90.13 % by
current assets. The assets are being financed by an equity of 46.99 %, and total debt of
53.01 %.

Profit and loss
|
Year |
2012 |
2011 |
2010 |
2009 |
2008 |
|
Revenues |
30.915.634 |
28.381.652 |
19.206.491 |
20.051.558 |
27.456.000 |
|
Net turnover |
30.915.634 |
28.381.652 |
19.206.491 |
20.051.558 |
27.456.000 |
|
|
|||||
|
Gross margin |
6.398.013 |
6.618.939 |
4.056.752 |
4.235.974 |
|
|
|
|||||
|
Wages and salaries |
2.373.166 |
2.170.794 |
1.708.928 |
1.647.430 |
1.808.000 |
|
Amorization and
depreciation |
226.276 |
221.281 |
159.451 |
150.315 |
165.000 |
|
Sales |
24.517.621 |
21.762.713 |
15.149.739 |
15.815.584 |
|
|
other operating costs |
2.793.144 |
2.823.705 |
1.911.548 |
2.023.139 |
2.221.000 |
|
Raw materials and
consumables |
|
|
|
|
22.038.000 |
|
Operating expenses |
29.910.207 |
26.978.493 |
18.929.666 |
19.636.468 |
26.233.000 |
|
Operating result |
1.005.427 |
1.403.159 |
276.825 |
415.090 |
1.223.000 |
|
|
|||||
|
Financial income |
|
23.177 |
|
|
12.000 |
|
Financial expenses |
|
294.234 |
185.291 |
210.627 |
440.000 |
|
Financial result |
-315.881 |
-271.057 |
-185.291 |
-210.627 |
-428.000 |
|
Result on ordinary
operations before taxes |
689.546 |
1.132.102 |
91.534 |
204.463 |
795.000 |
|
Taxation
on the result of ordinary activities |
150.751 |
261.859 |
28.932 |
49.122 |
186.000 |
|
Result of ordinary
activities after taxes |
538.795 |
870.243 |
62.602 |
155.341 |
609.000 |
|
|
|||||
|
Net result |
538.795 |
870.243 |
62.602 |
155.341 |
609.000 |
Summary
The turnover of the company grew with 8.93 % between 2011 and 2012.
The gross profit of the company decreased by -3.34 % between 2011 and 2012.
The operating result of the company declined with -28.35 % between 2011 and 2012. This
evolution implies an decrease of the company's economic profitability.
The result of these changes is a reduction of the company's Economic Profitability of -48.63
% of the analysed period, being equal to 2011 % in the year 2012.
This fall has contributed to a asset turnover decrease, whose index evolved from -7.96 to a
level of 1.85.
The Net Result of the company increased by -38.09 % between 2011 and 2012.
The company's Financial Profitability has been positively affected by the financial activities in
comparison to the EBITs behaviour. The result of these variations is a profitability increase of
-43.64 % of the analysed period, being 9.62 % in the year 2012.
The company's financial profitability has been positively affected by its financial structure.
The turnover of the company grew with 47.77 % between 2010 and 2011.
The gross profit of the company grew with 63.16 % between 2010 and 2011.
The operating result of the company grew with 406.88 % between 2010 and 2011. This
evolution implies an increase of the company's economic profitability.
The result of these changes is an increase of the company's Economic Profitability of 941.56
% of the analysed period, being equal to 2010 % in the year 2011.
This growth has contributed to the increase in assets turnover, increasing by 24.84 %
reaching 2.01.
The Net Result of the company decreased by 1290.12 % between 2010 and 2011.
The company's Financial Profitability has been negatively affected by the financial activities in
comparison to the EBITs behaviour. The result of these variations is a profitability reduction
of 973.58 % of the analysed period, being 17.07 % in the year 2011.
The company's financial structure has slowed down its financial profitability.

Analysis
Branch (SBI) Wholesale trade (no motor vehicles and motorcycles) (46)
Region Zuid-Holland Oost
In the Netherlands 109662 of the companies are registered with the SBI code 46
In the region Zuid-Holland Oost 4943 of the companies are registered with the SBI code 46
In the Netherlands 2387 of the bankrupcties are published within this sector
In the region Zuid-Holland Oost 86 of the bankruptcies are published within this sector
The risk of this specific sector in the Netherlands is normal
The risk of this specific sector in the region Zuid-Holland Oost is normal
Publications
Filings 08-11-2013: De jaarrekening over 2012 is gepubliceerd.
20-08-2012: De jaarrekening over 2011 is gepubliceerd.
17-05-2011: De jaarrekening over 2010 is gepubliceerd.
09-09-2010: De jaarrekening over 2009 is gepubliceerd.
Company structure
Arcus Holding B.V.
Nijverheidstraat 4
3316AP DORDRECHT
Netherlands
Registration number: 230454930000
• Arcus Nederland B.V.
Nijverheidstraat 4
3316AP Dordrecht
Netherlands
Registration number: 243389070000
FOREIGN EXCHANGE RATES
|
Currency |
Unit
|
Indian Rupees |
|
US Dollar |
1 |
Rs.61.34 |
|
|
1 |
Rs.103.44 |
|
Euro |
1 |
Rs.81.96 |
INFORMATION DETAILS
|
Analysis Done by
: |
SUB |
|
|
|
|
Report Prepared
by : |
NIS |
RATING EXPLANATIONS
|
RATING |
STATUS |
PROPOSED CREDIT LINE |
|
|
|
>86 |
Aaa |
Possesses an extremely sound financial base with the strongest
capability for timely payment of interest and principal sums |
Unlimited |
|
|
71-85 |
Aa |
Possesses adequate working capital. No caution needed for credit
transaction. It has above average (strong) capability for payment of interest
and principal sums |
Large |
|
|
56-70 |
A |
Financial & operational base are regarded healthy. General unfavourable
factors will not cause fatal effect. Satisfactory capability for payment of
interest and principal sums |
Fairly Large |
|
|
41-55 |
Ba |
Overall
operation is considered normal. Capable to meet normal commitments. |
Satisfactory |
|
|
26-40 |
B |
Capability to overcome financial difficulties seems comparatively
below average. |
Small |
|
|
11-25 |
Ca |
Adverse factors are apparent. Repayment of interest and principal sums
in default or expected to be in default upon maturity |
Limited with
full security |
|
|
<10 |
C |
Absolute credit risk exists. Caution needed to be exercised |
Credit not
recommended |
|
|
-- |
NB |
New Business |
-- |
|
This score serves as a reference to assess SC’s credit risk and
to set the amount of credit to be extended. It is calculated from a composite
of weighted scores obtained from each of the major sections of this report. The
assessed factors and their relative weights (as indicated through %) are as
follows:
Financial
condition (40%) Ownership
background (20%) Payment
record (10%)
Credit history
(10%) Market trend
(10%) Operational
size (10%)
This report is issued at your request without any
risk and responsibility on the part of MIRA INFORM PRIVATE LIMITED (MIPL)
or its officials.