MIRA
INFORM REPORT
|
Report Date : |
07.08.2014 |
IDENTIFICATION DETAILS
|
Name : |
KLAAS PUUL B.V. |
|
|
|
|
Registered Office : |
Lupinestraat 117 1131JT Volendam |
|
|
|
|
Country : |
|
|
|
|
|
Financials (as on) : |
31.03.2013 |
|
|
|
|
Date of Incorporation : |
07.06.1990 |
|
|
|
|
Com. Reg. No.: |
36036035 |
|
|
|
|
Legal Form : |
Besloten Vennootschap |
|
|
|
|
Line of Business : |
Wholesale trade (no motor vehicles and motorcycles |
|
|
|
|
No. of Employees : |
131 |
RATING & COMMENTS
|
MIRA’s Rating : |
Ba |
|
RATING |
STATUS |
PROPOSED CREDIT LINE |
|
|
41-55 |
Ba |
Overall operation is considered normal. Capable to meet normal
commitments. |
Satisfactory |
|
Status : |
Satisfactory |
|
Payment Behaviour : |
No complaints |
|
Litigation : |
Clear |
NOTES :
Any query related to this report can be made
on e-mail : infodept@mirainform.com
while quoting report number, name and date.
ECGC Country Risk Classification List – June 01, 2014
|
Country Name |
Previous Rating (31.03.2014) |
Current Rating (01.06.2014) |
|
|
A1 |
A1 |
|
Risk Category |
ECGC
Classification |
|
Insignificant |
A1 |
|
Low Risk |
A2 |
|
Moderate Low Risk |
B1 |
|
Moderate Risk |
B2 |
|
Moderate High Risk |
C1 |
|
High Risk |
C2 |
|
Very High Risk |
D |
|
Source
: CIA |
Summary
|
Company name |
Klaas Puul B.V. |
|
|
Operative address |
Lupinestraat 117 1131JT Volendam |
|
|
Legal form |
Besloten Vennootschap |
|
|
Registration number |
KvK-nummer: 36036035 |
|
|
VAT-number |
008563500 |
|
|
Year |
2013 |
|
Mutation |
2012 |
|
Mutation |
2011 |
|
Fixed assets |
4.789.132 |
|
-16,80 |
5.755.829 |
|
-37,95 |
9.276.225 |
|
Total receivables |
15.475.806 |
|
8,97 |
14.202.282 |
|
22,58 |
11.586.144 |
|
|
|||||||
|
Total equity |
28.338.591 |
|
2,43 |
27.667.236 |
|
7,06 |
25.843.482 |
|
Short term liabilities |
22.600.059 |
4 |
-32,96 |
33.711.862 |
|
5,24 |
32.032.694 |
|
|
|||||||
|
Net result |
671.355 |
|
-63,19 |
1.823.754 |
t |
42,97 |
1.275.596 |
|
|
|||||||
|
Working capital |
28.598.208 |
|
5,63 |
27.074.153 |
t |
51,28 |
17.897.034 |
|
Quick ratio |
0,69 |
* |
46,81 |
0,47 |
t |
27,03 |
0,37 |
Contact information
Company name Klaas Puul B.V.
Trade names HSG
Holland Seafood Group
E.E.G. 6136 : Volendam Holland
Klaas Puul B.V.
Operative address Lupinestraat 117
1131JT Volendam
Correspondence address Postbus 231
1130AE Volendam
Telephone number 0299364247
Fax number 0299367247
Email address info@klaaspuul.com
Website www.klaaspuul.com
Registration
Branch number 000016328159
VAT-number 008563500
Status Active
First registration company
register 1990-06-07
Memorandum 1990-05-31
Establishment date 1968-06-15
Legal form Besloten
Vennootschap
Last proposed admendment 2006-07-17
Activities
SBI Wholesale trade (no motor vehicles and
motorcycles) (46)
Wholesale of fish (46382)
Retail sale of fish (4723)
Exporter Yes
Importer Yes
Goal Im- en export van en groot- en
kleinhandel in vis en garnalen en aanverwante producten
Relations
Shareholders Klaas Puul Beheer B.V.
Lupinestraat 117
1131JT VOLENDAM
Registration number: 360387690000
Percentage: 100%
Branches Klaas Puul B.V.
Hamerstraat 26
1135GA
Registration number: 360360350001
Management
Active management
Klaas Puul Holding B.V.
Lupinestraat
117
1131JT
VOLENDAM
Registration
number: 360012330000
Competence:
Fully authorized
Function:
Manager
Starting
date: 1990-05-31
J.P. Bootsman (Johan Petrus)
Competence:
Fully authorized
Function:
General Director
Starting
date: 1992-05-14
Date
of birth: 1962-06-25,
Active
management
B.M.J. Mooijer (Bianca Margaretha
Johanna)
Competence:
Limited authorization
Function:
Proxy
Starting
date: 1992-06-11
Date
of birth: 1970-02-19,
Employees
Year 2014 2013 2012 2011
2010
Total 131 192 200 206
191
Payments
Score 7,6
Description Payments
made under regular condition
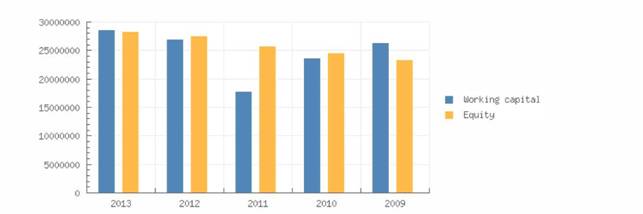
Key figures
|
|
|||||
|
Year |
2013 |
2012 |
2011 |
2010 |
2009 |
|
Quick ratio |
0,69 |
0,47 |
0,37 |
0,58 |
0,50 |
|
Current ratio |
2,27 |
1,80 |
1,56 |
1,81 |
1,81 |
|
|
|||||
|
Working capital/ balance total |
0,51 |
0,41 |
0,30 |
0,40 |
0,40 |
|
Equity / balance total |
0,51 |
0,42 |
0,44 |
0,41 |
0,35 |
|
Equity / Fixed assets |
5,92 |
4,81 |
2,79 |
3,71 |
3,41 |
|
Equity / liabilities |
1,02 |
0,71 |
0,77 |
0,70 |
0,57 |
|
Equity |
28.338.591 |
27.667.236 |
25.843.482 |
24.567.886 |
23.415.000 |
|
Mutation equity |
2,43 |
7,06 |
5,19 |
4,92 |
-5,63 |
|
Mutation short term liabilities |
-32,96 |
5,24 |
9,36 |
-10,91 |
132,39 |
|
|
|||||
|
Return on total assets (ROA) |
1,65 |
3,96 |
2,44 |
2,32 |
-2,67 |
|
Return on equity (ROE) |
3,25 |
9,53 |
5,60 |
5,64 |
-7,54 |
|
Gross profit margin |
0,96 |
2,35 |
1,63 |
1,78 |
-0,11 |
|
Net profit margin |
0,42 |
1,27 |
0,91 |
0,82 |
-1,01 |
|
|
|||||
|
Average collection ratio |
7,04 |
4,25 |
4,39 |
4,79 |
4,21 |
|
Average payment ratio |
10,28 |
10,10 |
12,15 |
8,47 |
9,36 |
|
Equity turnover ratio |
5,61 |
5,18 |
5,45 |
5,72 |
5,91 |
|
Total assets turnover ratio |
2,84 |
2,15 |
2,38 |
2,35 |
2,09 |
|
Fixed assets turnover ratio |
33,21 |
24,91 |
15,17 |
21,20 |
20,13 |
|
Inventory conversion ratio |
4,46 |
3,19 |
3,71 |
3,90 |
3,21 |
|
|
|||||
|
Turnover |
159.068.463 |
143.372.563 |
140.763.224 |
140.439.329 |
138.287.000 |
|
Operating result |
1.534.793 |
3.362.452 |
2.296.931 |
2.500.756 |
-154.000 |
|
Net result after taxes |
671.355 |
1.823.754 |
1.275.596 |
1.152.783 |
-1.398.000 |
|
Gross Profit |
--- |
-- |
-- |
-- |
138.287.0000 |
|
EBIT |
1.534.793 |
3.362.452 |
2.296.931 |
2.500.756 |
-154.000 |
Summary
The
2013 financial result structure is a postive working captial of 28.598.208
euro, which is in
agreement
with 51 % of the total assets of the company.
The
working capital has increased with 5.63 % compared to previous year. The ratio,
with
respect
to the total assets of the company has however, increased.
The
improvement between 2012 and 2013 has mainly been caused by an increase of the
current
assets.
The
current ratio of the company in 2013 was 2.27. A company with a current ratio
between
1.5
and 3.0 generally indicates good short-term financial strength.
The quick
ratio in 2013 of the company was 0.69. A company with a Quick Ratio of less
than
1
cannot currently pay back its current liabilities.
The
2012 financial result structure is a postive working captial of 27.074.153
euro, which is in
agreement
with 41 % of the total assets of the company.
The
working capital has increased with 51.28 % compared to previous year. The
ratio, with
respect
to the total assets of the company has however, increased.
The
improvement between 2011 and 2012 has mainly been caused by an increase of the
current
assets.
The
current ratio of the company in 2012 was 1.8. A company with a current ratio
between
1.5
and 3.0 generally indicates good short-term financial strength.
The
quick ratio in 2012 of the company was 0.47. A company with a Quick Ratio of
less than
1
cannot currently pay back its current liabilities
Financial statement
Type of annual account Corporate
Annual account Klaas Puul B.V.
Lupinestraat 117
1131JT Volendam
Registration number: 360360350000
Balance
|
Year |
2013 |
2012 |
2011 |
2010 |
2009 |
|
End date |
2013-03-31 |
2012-03-31 |
2011-03-31 |
2010-03-31 |
2009-03-31 |
|
Intangible fixed assets |
1.543.390 |
2.068.665 |
2.540.559 |
3.039.452 |
3.350.000 |
|
Other tangible fixed assets |
|
|
|
|
3.477.000 |
|
Tangible fixed assets |
3.184.983 |
3.605.573 |
4.197.479 |
3.535.270 |
3.477.000 |
|
Other financial fixed assets |
|
|
|
|
41.000 |
|
Financial fixed assets |
60.759 |
81.591 |
2.538.187 |
49.989 |
41.000 |
|
Fixed assets |
4.789.132 |
5.755.829 |
9.276.225 |
6.624.711 |
6.868.000 |
|
|
|||||
|
Other stock |
|
|
|
|
43.048.000 |
|
Total stock |
35.632.061 |
44.896.968 |
37.985.418 |
35.993.553 |
43.048.000 |
|
Accounts receivable |
12.197.801 |
10.841.014 |
9.203.257 |
10.757.513 |
10.444.000 |
|
Other receivables |
3.278.005 |
3.361.268 |
2.382.887 |
5.816.378 |
4.327.000 |
|
Total receivables |
15.475.806 |
14.202.282 |
11.586.144 |
16.573.891 |
14.770.000 |
|
Year |
2013 |
2012 |
2011 |
2010 |
2009 |
|
End date |
2013-03-31 |
2012-03-31 |
2011-03-31 |
2010-03-31 |
2009-03-31 |
|
Liquid funds |
90.400 |
1.686.765 |
358.166 |
484.304 |
1.535.000 |
|
accruals |
|
|
|
|
4.327.000 |
|
Current assets |
51.198.267 |
60.786.015 |
49.929.728 |
53.051.748 |
59.353.000 |
|
Total assets |
55.987.399 |
66.541.844 |
59.205.953 |
59.676.459 |
66.221.000 |
|
|
|||||
|
Issued capital |
18.152 |
18.152 |
18.152 |
18.152 |
18.000 |
|
Share premium reserve |
612.838 |
612.838 |
612.838 |
612.838 |
613.000 |
|
Other reserves |
27.036.246 |
25.212.492 |
23.936.896 |
22.784.113 |
24.182.000 |
|
Non-distributable profit |
671.355 |
1.823.754 |
1.275.596 |
1.152.783 |
-1.398.000 |
|
Total reserves |
28.320.439 |
27.649.084 |
25.825.330 |
24.549.734 |
23.397.000 |
|
Total equity |
28.338.591 |
27.667.236 |
25.843.482 |
24.567.886 |
23.415.000 |
|
|
|||||
|
Provisions |
548.749 |
571.981 |
577.053 |
304.579 |
1.582.000 |
|
Long term interest yielding debt |
4.500.000 |
4.590.765 |
252.724 |
5.512.791 |
|
|
Financial debts |
|
|
500.000 |
|
|
|
Other long term liabilities |
|
|
|
|
8.344.000 |
|
Long term liabilities |
4.500.000 |
4.590.765 |
752.724 |
5.512.791 |
8.344.000 |
|
Accounts payable |
2.098.294 |
2.815.174 |
2.674.463 |
2.900.181 |
1.872.000 |
|
Other short term liabilities |
20.501.765 |
30.896.688 |
29.358.231 |
26.391.022 |
31.008.000 |
|
Short term liabilities |
22.600.059 |
33.711.862 |
32.032.694 |
29.291.203 |
32.879.000 |
|
Total short and long term liabilities |
27.648.808 |
38.874.608 |
33.362.471 |
35.108.573 |
41.223.000 |
|
Total liabilities |
55.987.399 |
66.541.844 |
59.205.953 |
59.676.459 |
66.221.000 |
Summary
The
total assets of the company decreased with -15.86 % between 2012 and 2013.
This
downturn is mainly retrievable in the fixed asset decrease of -16.8 %.
The
asset reduction is in contrast with the equity growth of 2.43 %. Due to this
the total debt
decreased
with -28.88 %.
In
2013 the assets of the company were 8.55 % composed of fixed assets and 91.45 %
by
current
assets. The assets are being financed by an equity of 50.62 %, and total debt
of
49.38
%.
The
total assets of the company increased with 12.39 % between 2011 and 2012.
Despite
the assets growth, the non current assets decreased with -37.95 %.
The
asset growth has mainly been financed by a debt increase of 16.52 %. The Net
Worth,
however,
grew with 7.06 %.
In
2012 the assets of the company were 8.65 % composed of fixed assets and 91.35 %
by
current
assets. The assets are being financed by an equity of 41.58 %, and total debt
of
58.42
%.
Profit and loss
|
|
|||||
|
Year |
2013 |
2012 |
2011 |
2010 |
2009 |
|
Revenues |
159.068.463 |
143.372.563 |
140.763.224 |
140.439.329 |
138.287.000 |
|
Net turnover |
159.068.463 |
143.372.563 |
140.763.224 |
140.439.329 |
138.287.000 |
|
|
|||||
|
other operating costs |
|
|
|
|
138.441.000 |
|
Operating expenses |
157.533.670 |
140.010.111 |
138.466.293 |
137.938.573 |
138.441.000 |
|
Operating result |
1.534.793 |
3.362.452 |
2.296.931 |
2.500.756 |
-154.000 |
|
|
|||||
|
Financial income |
61.639 |
42.747 |
99.519 |
3.573 |
3.000 |
|
Financial expenses |
674.280 |
767.489 |
950.396 |
1.119.803 |
1.613.000 |
|
Financial result |
-612.641 |
-724.742 |
-850.877 |
-1.116.230 |
-1.610.000 |
|
Result on ordinary operations before taxes |
922.152 |
2.637.710 |
1.446.054 |
1.384.526 |
-1.765.000 |
|
|
|||||
|
Taxation on the result of ordinary activities |
250.797 |
813.956 |
170.458 |
231.743 |
-366.000 |
|
Result of ordinary activities after taxes |
671.355 |
1.823.754 |
1.275.596 |
1.152.783 |
-1.398.000 |
|
|
|||||
|
Net result |
671.355 |
1.823.754 |
1.275.596 |
1.152.783 |
-1.398.000 |
Summary
The turnover
of the company grew with 10.95 % between 2012 and 2013.
The
operating result of the company declined with -54.35 % between 2012 and 2013.
This
evolution
implies an decrease of the company's economic profitability.
The
result of these changes is a reduction of the company's Economic Profitability
of -58.33
% of
the analysed period, being equal to 2012 % in the year 2013.
Despite
the decline the assets turnover increased by 32.09 % reaching 2.84.
The
Net Result of the company increased by -63.19 % between 2012 and 2013.
The
company's Financial Profitability has been positively affected by the financial
activities in
comparison
to the EBITs behaviour. The result of these variations is a profitability
increase of
-65.9
% of the analysed period, being 3.25 % in the year 2013.
The
company's financial profitability has been positively affected by its financial
structure.
The
turnover of the company grew with 1.85 % between 2011 and 2012.
The
operating result of the company grew with 46.39 % between 2011 and 2012. This
evolution
implies an increase of the company's economic profitability.
The
result of these changes is an increase of the company's Economic Profitability
of 62.3 %
of
the analysed period, being equal to 2011 % in the year 2012.
Despite
the growth the assets turnover decreased, whose index evolved with -9.66 % to a
level
of 2.15.
The
Net Result of the company decreased by 42.97 % between 2011 and 2012.
The
company's Financial Profitability has been positively affected by the financial
activities in
comparison
to the EBITs behaviour. The result of these variations is a profitability
increase of
70.18
% of the analysed period, being 9.53 % in the year 2012.
The
company's financial structure has slowed down its financial profitability.
Analysis
Branch (SBI) Wholesale trade (no motor vehicles and motorcycles)
(46)
Region Groot
In
the
In the
region Groot Amsterdam 10512 of the companies are registered with the SBI code
46
In
the
In
the region Groot Amsterdam 209 of the bankruptcies are published within this
sector
The
risk of this specific sector in the
The
risk of this specific sector in the region Groot Amsterdam is normal
Publications
Filings 02-10-2013: De jaarrekening over
2013 (gebroken boekjaar) is gepubliceerd.
07-08-2012:
De jaarrekening over 2012 (gebroken boekjaar) is gepubliceerd.
19-09-2011:
De jaarrekening over 2011 (gebroken boekjaar) is gepubliceerd.
15-07-2010:
De jaarrekening over 2010 (gebroken boekjaar) is gepubliceerd.
29-10-2009:
De jaarrekening over 2009 (gebroken boekjaar) is gepubliceerd.
FOREIGN EXCHANGE RATES
|
Currency |
Unit
|
Indian Rupees |
|
US Dollar |
1 |
Rs.61.33 |
|
|
1 |
Rs.103.43 |
|
Euro |
1 |
Rs.81.96 |
INFORMATION DETAILS
|
Analysis Done by
: |
SUB |
|
|
|
|
Report Prepared
by : |
PDT |
RATING EXPLANATIONS
|
RATING |
STATUS |
PROPOSED CREDIT LINE |
|
|
|
>86 |
Aaa |
Possesses an extremely sound financial base with the strongest
capability for timely payment of interest and principal sums |
Unlimited |
|
|
71-85 |
Aa |
Possesses adequate working capital. No caution needed for credit
transaction. It has above average (strong) capability for payment of interest
and principal sums |
Large |
|
|
56-70 |
A |
Financial & operational base are regarded healthy. General unfavourable
factors will not cause fatal effect. Satisfactory capability for payment of
interest and principal sums |
Fairly Large |
|
|
41-55 |
Ba |
Overall operation is considered normal. Capable to meet normal
commitments. |
Satisfactory |
|
|
26-40 |
B |
Capability to overcome financial difficulties seems comparatively
below average. |
Small |
|
|
11-25 |
Ca |
Adverse factors are apparent. Repayment of interest and principal sums
in default or expected to be in default upon maturity |
Limited with
full security |
|
|
<10 |
C |
Absolute credit risk exists. Caution needed to be exercised |
Credit not
recommended |
|
|
-- |
NB |
New Business |
-- |
|
This score serves as a reference to assess SC’s credit risk and
to set the amount of credit to be extended. It is calculated from a composite
of weighted scores obtained from each of the major sections of this report. The
assessed factors and their relative weights (as indicated through %) are as
follows:
Financial
condition (40%) Ownership
background (20%) Payment
record (10%)
Credit history
(10%) Market trend
(10%) Operational
size (10%)
This report is issued at your request without any
risk and responsibility on the part of MIRA INFORM PRIVATE LIMITED (MIPL)
or its officials.