MIRA
INFORM REPORT
|
Report Date : |
07.08.2014 |
IDENTIFICATION DETAILS
|
Name : |
PERUNA GROUP LIMITED |
|
|
|
|
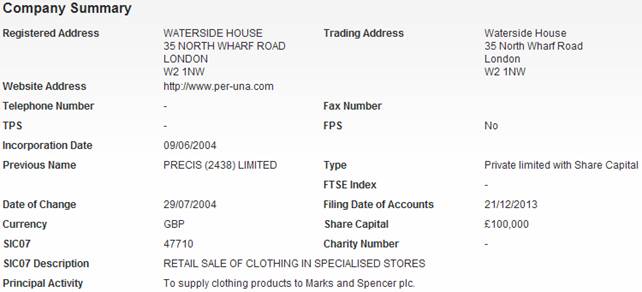
Registered Office : |
Waterside House 35 North Wharf Road london W2 1NW |
|
|
|
|
Country : |
|
|
|
|
|
Financials (as on) : |
31.03.2013 |
|
|
|
|
Date of Incorporation : |
09.06.2004 |
|
|
|
|
Legal Form : |
Private Limited with Share Capital |
|
|
|
|
Line of Business : |
Retail sale of clothing in specialised stores |
|
|
|
|
No. of Employees : |
Not Available |
RATING & COMMENTS
|
MIRA’s Rating : |
Ba |
|
RATING |
STATUS |
PROPOSED CREDIT LINE |
|
|
41-55 |
Ba |
Overall operation is considered normal. Capable to meet normal
commitments. |
Satisfactory |
|
Status : |
Satisfactory |
|
|
|
|
Payment Behaviour : |
No complaints |
|
|
|
|
Litigation : |
Clear |
NOTES :
Any query related to this report can be made
on e-mail : infodept@mirainform.com
while quoting report number, name and date.
ECGC Country Risk Classification List – June 01, 2014
|
Country Name |
Previous Rating (31.03.2014) |
Current Rating (01.06.2014) |
|
|
A1 |
A1 |
|
Risk Category |
ECGC
Classification |
|
Insignificant |
A1 |
|
Low Risk |
A2 |
|
Moderate Low Risk |
B1 |
|
Moderate Risk |
B2 |
|
Moderate High Risk |
C1 |
|
High Risk |
C2 |
|
Very High Risk |
D |
The
|
Source
: CIA |
REGISTERED NAME & COMPANY
SUMMARY
PERUNA GROUP LIMITED
DIRECTORS/MANAGEMENT
Current Directors
|
Name |
Date of Birth |
07/03/1964 |
|
|
Officers Title |
Ms |
Nationality |
British |
|
Present Appointments |
60 |
Function |
Director |
|
Appointment Date |
30/07/2009 |
|
|
|
Address |
|
||
|
Other Actions |
|||
|
|
|
||
|
Name |
Date of Birth |
04/04/1974 |
|
|
Officers Title |
Mr |
Nationality |
British |
|
Present Appointments |
3 |
Function |
Director |
|
Appointment Date |
10/02/2011 |
|
|
|
Address |
Waterside House, |
||
|
Other Actions |
|||
|
|
|
||
Current Company Secretary
|
Name |
Date of Birth |
10/04/1958 |
|
|
Officers Title |
Mr |
Nationality |
British |
|
Present Appointments |
75 |
Function |
Company Secretary |
|
Appointment Date |
01/05/2006 |
|
|
|
Address |
Waterside House, |
||
Previous Director/Company
Secretaries
|
Name |
Current Directorships |
Previous Directorships |
|
14 |
12 |
|
|
14 |
12 |
|
|
1 |
5 |
|
|
48 |
514 |
|
|
9 |
1 |
|
|
0 |
2 |
|
|
0 |
3 |
|
|
11 |
9 |
|
|
2579 |
263489 |
|
|
163 |
1272 |
|
|
17 |
44 |
|
|
14 |
81 |
|
|
2 |
27 |
NEGATIVE INFORMATION
Mortgage Summary
Total Mortgage 0
Outstanding 0
Satisfied 0
Trade Debtors / Bad Debt
Summary
Total Number of Documented
Trade 0
Total Value of Documented
Trade £0
CCJ
|
Total Number of Exact
CCJs - |
Total Value of Exact
CCJs - |
||
|
Total Number of Possible
CCJs - |
Total Value of Possible
CCJs - |
||
|
Total Number of
Satisfied CCJs - |
Total Value of Satisfied
CCJs - |
||
|
Total Number of Writs - |
- |
|
|
Exact CCJ Details
|
No CCJs found |
Possible CCJs Details
|
There are no possible
CCJ details |
Writ Details
|
No writs found |
SHARE & SHARE CAPITAL
INFORMATION
Top 20 Shareholders
|
Name |
Currency |
Share Count |
Share Type |
Nominal Value |
% of Total Share Count |
|
MARKS & SPENCER PLC |
GBP |
100,000 |
ORDINARY |
1 |
100 |
PAYMENT INFORMATION
|
Average Invoice Value |
n/a |
|
Invoices available |
n/a |
|
Paid |
n/a |
|
Outstanding |
n/a |
|
Trade Payment Data is
information that we collect from selected third party partners who send us
information about their whole sales ledger. |
|
|
Within Terms |
0-30 Days |
31-60 Days |
61-90 Days |
91+ Days |
|
Paid |
|
|
|
|
|
|
Outstanding |
|
|
|
|
|
GROUP STRUCTURE & AFFILIATED
COMPANIES
Group structure
|
Group |
|
|
Linkages |
6 companies |
|
Countries |
In 2 countries |
Other Linked companies
|
Number |
Latest Key Financials |
|||||
|
34287696 |
30.03.2013 |
85 |
€77,000 |
|
||
|
33225985 |
24.02.2013 |
77 |
€970,000 |
|
||
|
33235552 |
24.02.2013 |
N/R |
- |
|
||
|
55457398 |
30.03.2013 |
3 |
€0 |
|
||
|
IE210097 |
16.03.2013 |
85 |
€1,000 |
|
||
|
IE210098 |
18.03.2013 |
94 |
€1,550,000 |
|
FINANCIAL INFORMATION
Profit & Loss
|
Date Of Accounts |
31/03/13 |
(%) |
31/03/12 |
(%) |
02/04/11 |
(%) |
31/03/11 |
(%) |
03/04/10 |
|
Weeks |
52 |
(%) |
52 |
(%) |
52 |
(%) |
52 |
(%) |
53 |
|
Currency |
GBP |
(%) |
GBP |
(%) |
GBP |
(%) |
GBP |
(%) |
GBP |
|
Consolidated A/cs |
N |
(%) |
N |
(%) |
N |
(%) |
N |
(%) |
N |
|
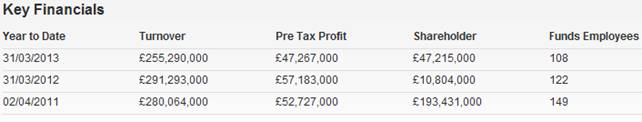
Turnover |
£255,290,000 |
-12.4% |
£291,293,000 |
4% |
£280,064,000 |
- |
£280,064,000 |
9% |
£256,972,000 |
|
Export |
- |
- |
- |
- |
- |
- |
- |
- |
- |
|
Cost of Sales |
£198,147,000 |
-10.7% |
£221,870,000 |
1.7% |
£218,151,000 |
- |
£218,151,000 |
11.1% |
£196,340,000 |
|
Gross Profit |
£57,143,000 |
-17.7% |
£69,423,000 |
12.1% |
£61,913,000 |
- |
£61,913,000 |
2.1% |
£60,632,000 |
|
Wages & Salaries |
£5,956,000 |
6% |
£5,618,000 |
-18.2% |
£6,871,000 |
- |
£6,871,000 |
-5.4% |
£7,261,000 |
|
Directors Emoluments |
- |
- |
- |
-100% |
£293,000 |
- |
£293,000 |
-28.4% |
£409,000 |
|
Operating Profit |
£47,267,000 |
-17.3% |
£57,184,000 |
8.5% |
£52,728,000 |
- |
£52,728,000 |
5.9% |
£49,781,000 |
|
Depreciation |
£108,000 |
-52.8% |
£229,000 |
-28.7% |
£321,000 |
- |
£321,000 |
10.3% |
£291,000 |
|
Audit Fees |
- |
- |
- |
- |
- |
- |
- |
- |
- |
|
Interest Payments |
- |
-100% |
£1,000 |
- |
£1,000 |
- |
£1,000 |
-50% |
£2,000 |
|
Pre Tax Profit |
£47,267,000 |
-17.3% |
£57,183,000 |
8.5% |
£52,727,000 |
- |
£52,727,000 |
5.9% |
£49,779,000 |
|
Taxation |
-£11,298,000 |
23.8% |
-£14,826,000 |
-0.8% |
-£14,711,000 |
- |
-£14,711,000 |
-6.4% |
-£13,822,000 |
|
Profit After Tax |
£35,969,000 |
-15.1% |
£42,357,000 |
11.4% |
£38,016,000 |
- |
£38,016,000 |
5.7% |
£35,957,000 |
|
Dividends Payable |
- |
-100% |
£225,000,000 |
- |
- |
- |
- |
- |
- |
|
Retained Profit |
£35,969,000 |
119.7% |
-£182,643,000 |
-580.4% |
£38,016,000 |
- |
£38,016,000 |
5.7% |
£35,957,000 |
Balance Sheet
|
Date Of Accounts |
31/03/13 |
(%) |
31/03/12 |
(%) |
02/04/11 |
(%) |
31/03/11 |
(%) |
03/04/10 |
|
Tangible Assets |
£160,000 |
-72% |
£571,000 |
-25.7% |
£769,000 |
- |
£769,000 |
11.9% |
£687,000 |
|
Intangible Assets |
£228,000 |
16.9% |
£195,000 |
11.4% |
£175,000 |
- |
£175,000 |
-49.7% |
£348,000 |
|
Total Fixed Assets |
£388,000 |
-49.3% |
£766,000 |
-18.9% |
£944,000 |
- |
£944,000 |
-8.8% |
£1,035,000 |
|
Stock |
£5,002,000 |
-21.5% |
£6,369,000 |
-40.9% |
£10,778,000 |
- |
£10,778,000 |
-35.9% |
£16,818,000 |
|
Trade Debtors |
0 |
- |
0 |
- |
0 |
- |
0 |
- |
0 |
|
Cash |
£1,681,000 |
-89.4% |
£15,910,000 |
-90.3% |
£164,021,000 |
- |
£164,021,000 |
10.8% |
£148,031,000 |
|
Other Debtors |
£87,583,000 |
101% |
£43,574,000 |
-30.7% |
£62,922,000 |
- |
£62,922,000 |
80.3% |
£34,901,000 |
|
Miscellaneous Current
Assets |
£106,000 |
-78.1% |
£483,000 |
-5.3% |
£510,000 |
- |
£510,000 |
-77.9% |
£2,312,000 |
|
Total Current Assets |
£94,372,000 |
42.3% |
£66,336,000 |
-72.2% |
£238,231,000 |
- |
£238,231,000 |
17.9% |
£202,062,000 |
|
Trade Creditors |
£16,265,000 |
-42.7% |
£28,399,000 |
58.9% |
£17,877,000 |
- |
£17,877,000 |
206.6% |
£5,831,000 |
|
Bank Loans &
Overdrafts |
0 |
- |
0 |
- |
0 |
- |
0 |
- |
0 |
|
Other Short Term Finance |
£7,843,000 |
520% |
£1,265,000 |
-61.6% |
£3,294,000 |
- |
£3,294,000 |
-77.6% |
£14,682,000 |
|
Miscellaneous Current
Liabilities |
£22,773,000 |
-12.3% |
£25,970,000 |
6.6% |
£24,364,000 |
- |
£24,364,000 |
0.2% |
£24,323,000 |
|
Total Current
Liabilities |
£46,881,000 |
-15.7% |
£55,634,000 |
22.2% |
£45,535,000 |
- |
£45,535,000 |
1.6% |
£44,836,000 |
|
Bank Loans &
Overdrafts and LTL |
£664,000 |
- |
£664,000 |
217.7% |
£209,000 |
- |
£209,000 |
-76.1% |
£876,000 |
|
Other Long Term Finance |
0 |
- |
0 |
-100% |
£8,000 |
- |
£8,000 |
-38.5% |
£13,000 |
|
Total Long Term
Liabilities |
£664,000 |
- |
£664,000 |
217.7% |
£209,000 |
- |
£209,000 |
-76.1% |
£876,000 |
.
Capital & Reserves
|
Date Of Accounts |
31/03/13 |
(%) |
31/03/12 |
(%) |
02/04/11 |
(%) |
31/03/11 |
(%) |
03/04/10 |
|
Called Up Share Capital |
£100,000 |
- |
£100,000 |
- |
£100,000 |
- |
£100,000 |
- |
£100,000 |
|
P & L Account
Reserve |
£47,115,000 |
322.7% |
£11,146,000 |
-94.2% |
£193,789,000 |
- |
£193,789,000 |
24.4% |
£155,773,000 |
|
Revaluation Reserve |
- |
- |
- |
- |
- |
- |
- |
- |
- |
|
Sundry Reserves |
- |
100% |
-£442,000 |
3.5% |
-£458,000 |
- |
-£458,000 |
-130.3% |
£1,512,000 |
|
Shareholder Funds |
£47,215,000 |
337% |
£10,804,000 |
-94.4% |
£193,431,000 |
- |
£193,431,000 |
22.9% |
£157,385,000 |
Other Financial Items
|
Date Of Accounts |
31/03/13 |
(%) |
31/03/12 |
(%) |
02/04/11 |
(%) |
31/03/11 |
(%) |
03/04/10 |
|
Net Worth |
£46,987,000 |
342.9% |
£10,609,000 |
-94.5% |
£193,256,000 |
- |
£193,256,000 |
23.1% |
£157,037,000 |
|
Working Capital |
£47,491,000 |
343.8% |
£10,702,000 |
-94.4% |
£192,696,000 |
- |
£192,696,000 |
22.6% |
£157,226,000 |
|
Total Assets |
£94,760,000 |
41.2% |
£67,102,000 |
-71.9% |
£239,175,000 |
- |
£239,175,000 |
17.8% |
£203,097,000 |
|
Total Liabilities |
£47,545,000 |
-15.5% |
£56,298,000 |
23.1% |
£45,744,000 |
- |
£45,744,000 |
0.1% |
£45,712,000 |
|
Net Assets |
£47,215,000 |
337% |
£10,804,000 |
-94.4% |
£193,431,000 |
- |
£193,431,000 |
22.9% |
£157,385,000 |
Cash Flow
|
Date Of Accounts |
31/03/13 |
(%) |
31/03/12 |
(%) |
02/04/11 |
(%) |
31/03/11 |
(%) |
03/04/10 |
|
Net Cashflow from
Operations |
-£14,975,000 |
-119.6% |
£76,532,000 |
366.7% |
£16,400,000 |
- |
£16,400,000 |
-44.7% |
£29,650,000 |
|
Net Cashflow before
Financing |
-£15,157,000 |
-119.7% |
£76,882,000 |
381.2% |
£15,976,000 |
- |
£15,976,000 |
-45.4% |
£29,271,000 |
|
Net Cashflow from
Financing |
- |
100% |
-£225,000,000 |
- |
- |
- |
- |
- |
- |
|
Increase in Cash |
-£15,157,000 |
89.8% |
-£148,118,000 |
-999.9% |
£15,976,000 |
- |
£15,976,000 |
-45.4% |
£29,271,000 |
Miscellaneous
|
Date Of Accounts |
31/03/13 |
(%) |
31/03/12 |
(%) |
02/04/11 |
(%) |
31/03/11 |
(%) |
03/04/10 |
|
Contingent Liability |
NO |
- |
NO |
- |
NO |
- |
NO |
- |
NO |
|
Capital Employed |
£47,879,000 |
317.5% |
£11,468,000 |
-94.1% |
£193,640,000 |
- |
£193,640,000 |
22.4% |
£158,261,000 |
|
Number of Employees |
108 |
-11.5% |
122 |
-18.1% |
149 |
- |
149 |
3.5% |
144 |
|
Auditors |
PRICEWATERHOUSECOOPERS
LLP |
||||||||
|
Auditor Comments |
The audit report
contains no adverse comments |
||||||||
|
Bankers |
|
||||||||
|
Bank Branch Code |
|
||||||||
Ratios
|
Date Of Accounts |
31/03/13 |
31/03/12 |
02/04/11 |
31/03/11 |
03/04/10 |
|
Pre-tax profit margin % |
18.52 |
19.63 |
18.83 |
18.83 |
19.37 |
|
Current ratio |
2.01 |
1.19 |
5.23 |
5.23 |
4.51 |
|
Sales/Net Working
Capital |
5.38 |
27.22 |
1.45 |
1.45 |
1.63 |
|
Gearing % |
1.40 |
6.10 |
0.10 |
0.10 |
0.60 |
|
Equity in % |
49.90 |
16.10 |
80.90 |
80.90 |
77.60 |
|
Creditor Days |
23.19 |
35.48 |
23.23 |
23.23 |
8.41 |
|
Debtor Days |
- |
- |
- |
- |
- |
|
Liquidity/Acid Test |
1.90 |
1.07 |
4.99 |
4.99 |
4.13 |
|
Return On Capital
Employed % |
98.72 |
498.63 |
27.22 |
27.22 |
31.45 |
|
Return On Total Assets
Employed % |
49.88 |
85.21 |
22.04 |
22.04 |
24.50 |
|
Current Debt Ratio |
0.99 |
5.14 |
0.23 |
0.23 |
0.28 |
|
Total Debt Ratio |
1 |
5.21 |
0.23 |
0.23 |
0.29 |
|
Stock Turnover Ratio % |
1.95 |
2.18 |
3.84 |
3.84 |
6.54 |
|
Return on Net Assets
Employed % |
100.11 |
529.27 |
27.25 |
27.25 |
31.62 |
FOREIGN EXCHANGE RATES
N/a
ADDITIONAL INFORMATION
Status History
|
No Status History found |
Event History
|
Date |
Description |
|
09/07/2014 |
Annual Returns |
|
08/01/2014 |
New Accounts Filed |
|
08/01/2014 |
New Accounts Filed |
|
30/09/2013 |
Annual Returns |
|
05/01/2013 |
New Accounts Filed |
|
05/01/2013 |
New Accounts Filed |
|
26/06/2012 |
Annual Returns |
|
15/10/2011 |
New Accounts Filed |
|
15/10/2011 |
New Accounts Filed |
|
09/07/2011 |
Annual Returns |
|
09/03/2011 |
Mr A.M. Skinner has left
the board |
|
09/03/2011 |
New Board Member Mr S.I.
Fyfe appointed |
|
20/10/2010 |
New Accounts Filed |
|
20/10/2010 |
New Accounts Filed |
|
06/07/2010 |
Annual Returns |
Previous Company Names
|
Date |
Previous Name |
|
29/07/2004 |
PRECIS (2438) LIMITED |
NOTES & COMMENTS
Commentary
|
No exact match CCJs are
recorded against the company. |
|
|
Sales in the latest
trading period decreased 12.4% on the previous trading period. |
|
|
Net Worth increased by
342.9% during the latest trading period. |
|
|
A 41.2% growth in Total
Assets occurred during the latest trading period. |
|
|
Pre-tax profits
decreased by 17.3% compared to the previous trading period. |
|
|
The company saw a
decrease in their Cash Balance of 89.4% during the latest trading period. |
|
|
The audit report
contains no adverse comments. |
|
|
No recent changes in
directorship are recorded. |
|
|
The company is part of a
group. |
|
|
The company has changed
its year end on multiple occasions. |
|
|
The company was
established over 10 years ago. |
|
FOREIGN EXCHANGE RATES
|
Currency |
Unit
|
Indian Rupees |
|
US Dollar |
1 |
Rs.61.33 |
|
|
1 |
Rs.103.43 |
|
Euro |
1 |
Rs.81.96 |
INFORMATION DETAILS
|
Analysis Done by
: |
SUB |
|
|
|
|
Report Prepared
by : |
PDT |
RATING EXPLANATIONS
|
RATING |
STATUS |
PROPOSED CREDIT LINE |
|
|
|
>86 |
Aaa |
Possesses an extremely sound financial base with the strongest
capability for timely payment of interest and principal sums |
Unlimited |
|
|
71-85 |
Aa |
Possesses adequate working capital. No caution needed for credit
transaction. It has above average (strong) capability for payment of interest
and principal sums |
Large |
|
|
56-70 |
A |
Financial & operational base are regarded healthy. General
unfavourable factors will not cause fatal effect. Satisfactory capability for
payment of interest and principal sums |
Fairly Large |
|
|
41-55 |
Ba |
Overall operation is considered normal. Capable to meet normal
commitments. |
Satisfactory |
|
|
26-40 |
B |
Capability to overcome financial difficulties seems comparatively
below average. |
Small |
|
|
11-25 |
Ca |
Adverse factors are apparent. Repayment of interest and principal sums
in default or expected to be in default upon maturity |
Limited with
full security |
|
|
<10 |
C |
Absolute credit risk exists. Caution needed to be exercised |
Credit not
recommended |
|
|
-- |
NB |
New Business |
-- |
|
This score serves as a reference to assess SC’s credit risk
and to set the amount of credit to be extended. It is calculated from a
composite of weighted scores obtained from each of the major sections of this
report. The assessed factors and their relative weights (as indicated through
%) are as follows:
Financial
condition (40%) Ownership
background (20%) Payment
record (10%)
Credit history
(10%) Market trend
(10%) Operational
size (10%)
This report is issued at your request without any
risk and responsibility on the part of MIRA INFORM PRIVATE LIMITED (MIPL)
or its officials.